ExtraHop 6.2 Web UI Guide
|
|
|
- Neal Lucas
- 5 years ago
- Views:
Transcription
1 ExtraHop 6.2 Web UI Guide
2 2018 ExtraHop Networks, Inc. All rights reserved. This manual in whole or in part, may not be reproduced, translated, or reduced to any machinereadable form without prior written approval from ExtraHop Networks, Inc. For more documentation, see Published: ExtraHop Networks Seattle, WA (US) +44 (0) (EMEA) (APAC)
3 Contents About this guide 11 Introduction to the ExtraHop system 12 ExtraHop platform architecture Data sources in the ExtraHop system Wire data Flow data Device discovery Device Discovery FAQ Software frame deduplication Introduction to the ExtraHop Web UI Global navigation Top menu Navigation bar Time Selector Specify a global or region time interval Specify a previous time interval Specify a custom time interval Specify a custom time range Zoom in on a time range Compare metric deltas Compare metric deltas on a protocol page Compare metric deltas on a dashboard page Dashboards Get started with dashboards Types of dashboards Activity dashboard page Network dashboard page Navigate dashboards Plan a dashboard Dashboard components Region Widget Charts FAQ Create a dashboard Edit a chart widget Dynamic baseline Add a dynamic baseline Add a static threshold line Display rates or counts in a chart Display percentiles or a mean Filter outliers Display detail metrics by key in a chart Regular expression filter examples Change drill-down chart labels Display device group members in a chart Change chart title
4 Custom metric labels Change a metric label in a chart legend Change chart appearance to grayscale Change chart units Display chart legend Abbreviate metric values in a chart Sort chart data Change percentile precision Include sparklines Display alert status in a chart Chart types Area chart Bar chart Box plot chart Candlestick chart Column chart Heatmap chart Histogram chart Line chart Line & column chart List chart Pie chart Status chart Table chart Value chart Alert history widget Edit a text box widget Format text in Markdown syntax Add images in Markdown syntax Add metrics in Markdown Metric variable examples Edit a dashboard layout Add a region Copy a region Delete a region Rename a region Modify sources Add a widget Copy a widget Delete a widget Print a widget Change dashboard properties Share a dashboard Remove access to a dashboard View a dashboard Organize dashboards Create a folder for dashboards Add a dashboard to a folder Arrange dashboard folders Copy a dashboard Sort dashboards Filter dashboards Export dashboard data Print a dashboard from a Discover appliance Print a dashboard to PDF from a Command appliance Delete a dashboard
5 Drill down on metrics from a dashboard Metrics Get started with metrics Top-level metrics and detail metrics Types of top-level metrics Time interval and data roll up Drill-down functionality Explore drill-down metrics by key Navigate metrics Metric Catalog Metric Explorer Sources and groups Applications Drill down on metrics from application protocol pages Devices Find a device Find peer devices talking to a specific device Change the name of a device Change a device role Drill down on metrics from device protocol pages Networks View configured network captures Change the name of a network capture or VLAN View configured flow networks Change the name of a flow network Assign triggers to a flow network or flow interface Set a custom speed for a flow interface Flow network summary pages Modify flow network chart display Create a chart from flow network data Drill down on flow network metrics Drill down on network capture and VLAN metrics Activity groups Find a device within an activity group Device groups Create a static device group Create a dynamic device group Modify a device group name Modify a device group description View device group metrics Trouble groups View trouble groups Aborted HTTP/DB transactions ADC SNAT pool too small ADC TCP connection throttling Database server backups DNS missing entries Excessive CIFS metadata queries Excessive HTTP authorizations HTTP broken links Path MTU mismatch Problematic TCP offloading engine Server TCP connection throttling SPAN oversubscription SSL Key Size <
6 Virtual packet loss Search metrics by protocol Learn about the new 6.2 layout Switch to old layout Manage protocol data Export data to CSV Export data to Excel Create a PDF of a protocol page Create a chart from a protocol page Pin a protocol page to a dashboard Create an activity map Sort metrics Detect anomalies with Addy Records Collect and store flow records on an Explore appliance Collect and store L7 records on an Explore appliance Collect and store custom records Write and assign a trigger Query for your custom record type Create a custom record format to display your record results in a table Query for your custom record type in table view Record format settings Query for stored records from a Discover or Command appliance Filter your records with a simple query Filter your records with advanced query rules Packets Creating a new packet query Filtering criteria Drill down from a device page Drill down from record query results Download a packet capture file Triggers Get started with triggers Navigate triggers Plan a trigger Build a trigger Configure the trigger Write the trigger script Assign the trigger to devices View runtime log output Monitor trigger performance Create a trigger Advanced trigger options Assign a trigger View triggers Trigger attributes Copy a trigger Enable a trigger Disable a trigger Delete a trigger
7 Alerts Detect anomalies with Addy Get started with alerts Navigate alerts View alerts Configuring alerts Create an alert Copy an alert Assign an alert Assign an alert to an application or network Assign an alert to a single device Enable an alert Disable an alert Delete an alert View alert settings Alert settings Exclusion intervals Create an exclusion interval Copy an exclusion interval Assign an exclusion interval Delete an exclusion interval View exclusion intervals Exclusion interval settings Reports Create a report Download a PDF report file Schedule a report (Command appliance only) Reports FAQ Bundles Essentials bundle Apply the Essentials bundle Enable triggers for the Essentials bundle Create a bundle Modify a bundle Upload a bundle Apply a bundle Delete a bundle Upload a bundle to the ExtraHop website Update a bundle on the ExtraHop website Remove a bundle from the ExtraHop website Geomaps Generate a geomap for a single device Create a geomap for a device group or an application Assign a geomap to a device group or application Open a geomap for a device group or application View regional details provided on a geomap View alert details provided on a geomap Track geomap locations with the most activity with Autopilot Geomaps FAQ How do I change the appearance of a geomap?
8 What does the Updater do? What are the graphs in the left pane? How do I save display changes I ve made to my geomap? Can I copy a geomap? System Health Get started with system health Navigate the System Health page System Health FAQ How do I check for possible data loss? How do I monitor resource consumption? How do I check the performance of my RPCAP deployments? Are my triggers running properly? How do triggers affect my appliance? How are my open data streams performing? What is the estimated lookback capacity? How many devices is the appliance monitoring? Are my SSL certificates decrypting as expected? How do I add system health metrics to a dashboard? What other tools can help me evaluate system health? Capture charts Incoming packets breakdown Incoming throughput breakdown Packet capture disk throughput Drops TCP desyncs External timestamps Capture heap allocation RPCAP packets RPCAP throughput Trigger executes Trigger executes by trigger Trigger load Trigger load by trigger Trigger load by thread Trigger exceptions by trigger Trigger drops Trigger heap allocation Remote charts Connections Messages sent Message throughput Message errors Messages dropped Message queue length Remote heap allocation Datastore charts Datastore disk read throughput Datastore disk write throughput Store read throughput Store write throughput Block object combinations Working set size Active devices Total devices Datastore metric size
9 Store lookback Datastore heap allocation Datastore trigger executes Datastore trigger load Datastore trigger load by trigger Datastore trigger drops Datastore trigger exceptions by trigger Datastore trigger heap allocation Trend charts Performance overview Trend details SSL certificates Admin UI status and diagnostics Health statistics Audit log Exception files Support packs System Settings Changes to System Settings and protocol pages in ExtraHop 6.2 Custom devices Create a custom device Delete a custom device Enable a custom device Disable a custom device Migrate pseudo devices to custom devices View custom devices Custom metrics Configure a custom metric Delete a single custom metric Delete multiple custom metrics View a custom metric Custom pages Create a page Assign a page Configure a page Add a chart to a page Add a trend chart to a page Copy a page Delete a page Enable a page Disable a page View custom pages Device limits and limited analysis View the device limit for your Discover appliance View the current device count on your Discover appliance Add devices to the whitelist Add multiple devices from System Settings Add a batch of devices based on activity from System Settings Add an individual device from a protocol page Remove a device from the whitelist Device tags Add device tags Rename device tags Remove device tags from a device Delete device tags
10 Flex grids Migrate flex grids to a table widget Create a flex grid Assign an object to a flex grid Copy a flex grid Delete a flex grid Add a metric to a flex grid Remove a metric from a flex grid View flex grids Setup, administration, and maintenance Log into the ExtraHop Admin UI Contact us 208 Appendix 209 ExtraHop modules Supported Browsers Common acronyms Keyboard shortcuts Built-in pages Application overview page Custom application page Application geomaps page Application alert history page Device overview page Device alert history page Device geomaps page Group geomaps page Custom device page Group devices page Network alert history page Network devices page Custom network page Alert History page Device overview page Device network page Group network page Group overview page
11 About this guide This guide provides information about the web-based user interface (Web UI) for the ExtraHop Discover and Command appliances. The purpose of this guide is to help users understand the ExtraHop system architecture and functionality as well as learn how to operate the controls, fields, and options available throughout the Web UI. Additional resources are available through the following links: See information about administrator features and functions for the ExtraHop Discover and Command appliances in the ExtraHop Admin UI Guide See the complete ExtraHop documentation set: See online training modules on the ExtraHop website: 11

12 Introduction to the ExtraHop system The ExtraHop system helps you to monitor network activity and all your applications. For example, you can learn how well applications are consuming network resources, how systems and devices are communicating with each other, and how to identify transactions that are flowing across the data link layer (L2) up to application layer (L7) in your network. Overall, the ExtraHop platform works in the following ways: Collecting data from transactions observed on your wire data capture feed or receiving NetFlow, sflow, IPFIX, and AppFlow traffic from remote flow networks Automatically discovering and classifying devices that are communicating on the network Providing you with 4,000 built-in metrics for dozens of protocols Enabling you to create custom metrics, alerts, and reports Note: To learn more about how ExtraHop works, view the following training modules: Getting Started with ExtraHop Explore Your Environment with Wire Data Wire Data Fundamentals Troubleshooting Principles ExtraHop platform architecture The ExtraHop platform comprises a suite of appliances that are designed to passively monitor the network traffic in your environment in real time. The ExtraHop system provides you with top-level and detailed metrics about the devices on your network, which you can analyze to determine where problems in your network might be developing. ExtraHop Discover appliance The ExtraHop Discover appliance (EDA) provides the ability to analyze and visualize all of your network, application, client, infrastructure, and business data. The Discover appliance passively collects unstructured wire data all of the transactions on your network and transforms this data into structured wire data. Deploy a single Discover appliance, either physical or virtual, anywhere in your network environment. ExtraHop Explore appliance The ExtraHop Explore appliance (EXA) integrates with the ExtraHop Discover appliance to store transaction and flow records sent from the Discover appliance. You can see, save, and search the structured flow and transaction information about events on your network with a simple, unified UI, with no modifications to your existing applications or infrastructure. Deploy a cluster of three or more Explore appliances to take advantage of data redundancy and performance improvements. 12

13 ExtraHop Trace appliance The ExtraHop Trace appliance (ETA) continuously collects network packets and integrates with the ExtraHop Discover and Command appliances to enable you to quickly retrieve all packets that match a set of search criteria within a given time interval. You can then download the packet capture file for further inspection in a packet analyzer, such as Wireshark. Deploy a Trace appliance when you need access to more than the summary data collected by the Discover appliance. ExtraHop Command appliance The ExtraHop Command appliance (ECA) provides centralized management and reporting across multiple ExtraHop Discover, Explore, and Trace appliances that are distributed across datacenters, branch offices, and the public cloud. You can pair an Explore appliance or cluster to multiple Discover appliances, and then query the records stored by each Discover appliance from the Command appliance. When you add a Trace appliance, you can search, download, and analyze the collected packets to gain further insight about the information flowing across your network. For most large ExtraHop deployments, a dedicated Command appliance is the most efficient way to manage all of your remote appliances. To learn more about the ExtraHop platform, view the following training modules: Planning ExtraHop deployment Planning for data acquisition Data sources in the ExtraHop system ExtraHop enables you to collect and analyze both wire and machine data. Wire data is observed in real time, which provides information about what s happening on your network. Flow data, a type of machine 13
14 data, can also be collected from a network device and sent to the ExtraHop for analysis or storage. Flow data is an alternative option if wire data cannot be collected from a remote network. Wire data With wire data, the ExtraHop system passively collects a copy of unstructured packets through a port mirror or tap and stores the data in the appliance datastore. The copied data goes through real-time stream processing, which transforms the packets into structured wire data through the following stages: TCP state machines are recreated to perform full-stream reassembly. Packets are constructed into flows. The structured data is analyzed and processed in the following ways: a. b. c. Transactions are identified Devices are automatically discovered by MAC and IP address and then classified by their activity. Metrics are generated and associated with protocols and sources, and the metric data is then aggregated into metric cycles. For more information, see the Sources and groups section. Note: Aggregation roll ups, also referred to as metric cycles, help determine the granularity of metric data in time series analyses. For more information, see the Time interval and data roll up section. As new metrics are generated and stored, and the datastore becomes full, the oldest existing metrics are overwritten according to the first-in first-out (FIFO) principle. Flow data A flow is a set of packets that are part of a single transaction between two endpoints. Similar to how the ExtraHop system can identify flows from wire data, flows from machine data on remote networks can be sent to a Discover appliance for analysis. Flows are identified through their unique combination of IP protocol (TCP/UDP), source and destination IP addresses, and source and destination ports. The ExtraHop system supports the following types of flow data: NetFlow v5 The Cisco proprietary protocol that defines a flow as a unidirectional flow of packets all sharing the following values: Ingress interface, source and destination IP address, IP protocol, source and destination ports, and the type of service. NetFlow v5 has a fixed record format with 20 fields and cannot be customized. NetFlow v9 An adapted version of NetFlow v5 where the record format is template based. NetFlow v9 has 60+ fields in the records and can be customized. In the Discover appliance, these records are only partially parsed until the template packet is detected. IPFIX An open standard based on the NetFlow v9 standard. ExtraHop supports only the native format; formats where the Enterprise bit is set outside of a trigger is not supported. AppFlow The Citrix implementation of IPFIX with customized extensions to include application-level information such as HTTP URLs, HTTP request methods, status codes, and so on. sflow A sampling technology for monitoring traffic in data networks. sflow samples every nth packet and sends it to the collector whereas NetFlow sends data from every flow to the collector. The primary difference between sflow and NetFlow is that sflow is network layer independent and can sample anything. NetFlow v5 is IP based, but v9 and IPFIX can also look at Layer The Discover appliance enables you to add any of the above flow data sources. You can then view metrics for flow networks and their interfaces. 14
15 Flow networks A flow network is a network device that sends information about flows seen across the device. Similar to how the ExtraHop system can identify flows from wire data, the ExtraHop system can receive flow information from remote network devices, also called flow exporters. Flow interfaces A flow network device can have multiple interfaces. Instead of looking at flow information for the entire device, you can look at flow information for a specific interface on the device. A typical flow monitoring setup consists of three main components: Flow exporter Aggregates packets into flows and exports the flow network traffic to one or more flow collectors. A flow exporter might be a router or switch on remote network that has been configured to send NetFlow or AppFlow traffic to your Discover appliance. Flow collector Receives, stores, and pre-processes flow network traffic received from a flow exporter. Flow analyzer Analyzes received flow network traffic in the context of intrusion detection, resource management, or traffic profiling. With the Discover appliance working as a flow collector and analyzer, you can collect the flow network traffic through the following stages: Flow exporters detect and format traffic, caching information about the flow, including source and destination IP addresses, port, IP protocol, and number of bytes and packets. The flow exporter sends the cached information from the flow network to the Discover appliance, which acts as a collector and analyzer for the flow data. The flow network traffic is analyzed, flows are identified, and metrics are aggregated for the total number of bytes and total number of packets in each flow. For example, when a client initiates a request to a server, the packet is sent to the router, which directs the packet to the destination server through the network topology. If that router is configured to be a flow network exporter, information about the flow is then formatted and sent to the Discover appliance for analysis. By analyzing flows of network traffic, such as NetFlow traffic, an administrator can identify the top network flows (most bytes consumed), top network talkers (highest throughput), total number of bytes, and the total number of packets per router interface. Device discovery The ExtraHop system automatically discovers devices based on what is happening on the network. There are two device discovery modes: layer 2 (L2) discovery and layer 3 (L3) discovery. The default discovery mode is L3 discovery. L2 discovery Creates an L2 device for every locally observed MAC address over the wire. All IP addresses associated with a MAC address are aggregated into one device. L3 discovery Creates an L3 device for every locally observed IP address over the wire that meets the following criteria: A device responds to an Address Resolution Protocol (ARP) request for the IP address, allowing the ExtraHop appliance to associate the IP address with an MAC address. The associated MAC address is not the MAC address of an L3-routing device. 15
16 In addition to creating L3 devices, the Discover appliance also creates an L2 device for each unique MAC address. If the MAC address and IP address are associated with the same device, the Discover appliance links the parent L2 device and the child L3 device. The IP address and MAC address for a device are displayed in the overview section on the Device page in the Metrics section of the Web UI. The following characteristics apply to L2 devices created by L3 device discovery mode: L2 metrics that cannot be associated with a particular child L3 device (for example, L2 broadcast traffic) are associated with the parent L2 device. In the device list view in the Metrics section of the Web UI, you can filter the full device list for L2 devices only, L3 devices only, or both types of devices. Learn more in the Find a device section. L2 devices that exist solely as parents to L3 child devices do not count against licensed device count limits. Device names and roles After a device is discovered, the ExtraHop system tracks all of the wire data traffic associated with the device. The ExtraHop system discovers device names by passively monitoring naming protocols, including DNS, DHCP, NETBIOS, and Cisco Discovery Protocol (CDP). A device can be identified by multiple names, which are all searchable. If a name is not discovered through a naming protocol, the default name is derived from device attributes (MAC address for L2 devices and the IP address for L3 devices). You can also create a custom name for a device. Learn more in the Change the name of a device section. Note: If a device name does not include a hostname, the ExtraHop system has not yet observed naming protocol traffic associated with that device. The ExtraHop system does not perform DNS lookups for device names. Based on the type of traffic associated with the device, the ExtraHop system assigns a role to the device, such as a gateway, file server, database, or load balancer. Learn more in the Change a device role section. Remote device discovery and custom devices The ExtraHop system automatically discovers local L3 devices based on observed ARP traffic that is associated with IP addresses. By default, all IP addresses that are observed outside of locally-monitored broadcast domains are aggregated at one of the incoming routers in your network. To identify and learn about individual devices outside of these routers, which are beyond your local network, you can create custom devices and enable reporting on these devices. For example, you can create a single device encompassing several known IP addresses for a remote site or cloud service. For more information on how to create a custom device, see the Custom devices section. Note: If you have a proxy ARP configured in your network, the ExtraHop system might automatically discover remote devices. For more information, see this ExtraHop forum post. To identify and learn about individual devices located outside of local routers beyond your local network, complete one of the following options: Configure remote discovery in the ExtraHop Admin UI to discover L3 devices for a range of IP addresses that are not on the local network. Create a custom device to collect metrics for a remote IP address or a range of IP addresses into one device. For example, you can create a single device that collects metrics for several known IP addresses that belong to remote sites or cloud services. Next steps Learn about device limits and limited analysis Review frequently asked questions about device discovery 16
17 Device Discovery FAQ Here are some answers to frequently asked questions about device discovery. How does the ExtraHop system discover devices? What is an L3 device? What is an L2 device? Why can't I find a device? What is a custom device? What is a device limit? What is limited analysis? How do I check my device limit and device counts? What does eligible for licensing mean? What is the whitelist? How do I know which devices are in the whitelist? How do I add devices to the whitelist in batches? Can I change the role of my device in the ExtraHop system? Can I change the name of my device in the ExtraHop system? How does the ExtraHop system discover devices? The ExtraHop system automatically discovers devices that are active on your local network. First, the ExtraHop system creates an L2 device entry for every locally observed MAC address over the wire. Then, the ExtraHop system creates an L3 device entry for every locally observed IP address included in an Address Resolution Protocol (ARP) response. Here are some important considerations about L3 device discovery: The IP address for the new L3 device is associated with a single MAC address. To discover L3 devices outside of your network, you can create a custom device or enable remote device discovery. If a router has proxy ARP enabled, the ExtraHop system creates an L3 device for each IP address that the router answers ARP requests for. After a device is discovered, the ExtraHop system begins to collect metrics for the device. As soon as metrics are available for a device, you can search for L2 and L3 devices in the ExtraHop system by their IP address, MAC address, or name (either a hostname observed from DNS traffic or a custom name that you assign to the device). For more information, see Device discovery. What is an L3 device? An L3 device entry in the ExtraHop system includes an IP address that is observed from local traffic or traffic detected from a router. ExtraHop automatically creates an L3 device entry for every locally observed IP address. When an L3 device is in not in limited analysis, L2 - L7 protocol activity is tracked against that L3 device. The ExtraHop appliance also tracks a single L2 parent device entry for each router MAC address that is associated with the same IP address. What is an L2 device? An L2 device entry in the ExtraHop system includes a MAC address only. ExtraHop automatically creates an L2 device entry for every locally observed MAC address, and network throughput activity for that MAC address is tracked against that L2 device. If the ExtraHop system later observes a local IP address associated with an L2 device's MAC address, the ExtraHop system then creates a child L3 device entry. L2 parent devices have a parent relationship with any L3 devices having the same MAC address. The L2 parent device entry remains in the ExtraHop system and does not count against licensed device limits. L2 parent devices are also exempt from the whitelist. 17
18 Why can't I find a device? If you cannot find a device in the ExtraHop system, it could be related to one of the following reasons: The device is outside of a locally-monitored broadcast domain. You can configure remote discovery in the ExtraHop Admin UI to create devices for a subnet or range of remote IP addresses. For example, if you want to monitor traffic associated with a remote branch office, the ExtraHop system can be configured to discover devices for each IP address at that office. You can also manually create a custom device in the Discover appliance to monitor traffic for a specific IP address. The device has not been active since the ExtraHop system was deployed. An active device is one that sends data over the wire to other devices. Devices that only receive traffic are not discovered. What is a custom device? Custom devices are manually created in the Discover appliance, and can be configured to collect metrics across IP addresses and ports as a single device. You might create a custom device to track individual devices outside of your local broadcast domain or you might create a single custom device to collect metrics for several known IP addresses for a remote site or cloud service. For more information, see Remote device discovery and custom devices. What is a device limit? A device limit is the total number of devices that can be in full analysis. Full analysis means that the Discover appliance collects complete L2-L7 protocol metrics for that device. If more devices are discovered on your network after the device limit is reached, those devices are placed into limited analysis. The device limit for your appliance is determined by the license you acquired. The device limit ensures that your ExtraHop appliance operates efficiently when there are too many devices on your network. What is limited analysis? Devices that are discovered after the device limit is exceeded can be placed into limited analysis. When a device limit is reached, there are too many devices on your network for the Discover appliance to fully analyze. The ExtraHop system only collects network metrics from L2 and L3 protocols for devices placed into limited analysis. For more information, see View the device limit and device counts. How do I check my device limit and device counts? Log into the ExtraHop Web UI and click the System Settings icon. Then, click Device Limits. The device limit for your appliance is listed at the top. Next to the device limit is the number of active devices that are in limited analysis. This number will be zero if the active device count, or number of active devices discovered on your appliance, is below the device limit. If the number of limited analysis devices is not zero, then the device limit is the same as the number of devices in full analysis. To see the current device count, or the number of active devices discovered by the ExtraHop system, select Eligible for Licensing in the drop down menu to the left of the Search button and then click Search. Note the number displayed at the bottom left of the page. For more information, see View the device limit and device counts. What does eligible for licensing mean? Devices that are actively communicating with other devices on your network are eligible for licensing. Devices that are not active, or have not been discovered by the ExtraHop appliance, are not considered eligible for licensing. However, inactive devices that were discovered in the past can be added to the Eligible for Licensing list again if they become active. 18
19 For more information, see View the device limit and device counts. What is the whitelist? The whitelist is a way to prioritize devices that you want to make sure receive full analysis in case your device limit is exceeded. Devices that are added to the whitelist are reserved for full analysis when they are actively communicating with other devices. If a device is not on the whitelist, it might be placed into limited analysis. For more information, see Add or remove devices from the whitelist. How do I know which devices are in the whitelist? Log into the Web UI on the Discover appliance and click the System Settings icon. Then, click Device Limits. Click the number displayed next to Whitelist to view each device that has been added to the whitelist. How do I add devices to the whitelist in batches? Log into the Web UI on the Discover appliance and click the System Settings icon. Then, click Device Limits. In the table of devices, select the checkbox next to all of the devices that you want to add to the whitelist. Then, click the Add to Whitelist icon in the upper right corner above the table. For more information, see Add or remove devices from the whitelist. Can I change the role of my device in the ExtraHop system? Yes, you can update the device role in device properties. The ExtraHop system assigns a device type, or role, to a newly discovered device based on the type of observed wire data traffic associated with the device. For more information, see Change a device role in the ExtraHop Web UI Guide. Can I change the name of my device in the ExtraHop system? Yes, you can change the device name in device properties. For more information, see Add a custom device name in the ExtraHop Web UI Guide. Software frame deduplication The ExtraHop system removes duplicate L2 and L3 frames and packets when metrics are collected and aggregated from your network activity by default. L2 deduplication removes identical Ethernet frames (where the Ethernet header and the entire IP packet must match); L3 deduplication removes TCP or UDP packets with identical IP ID fields on the same flow (where only the IP packet must match). The ExtraHop system checks for duplicates and removes only the immediately-previous packet both on the flow (for L3 deduplication) or globally (for L2 deduplication) if the duplicate arrives within 1 millisecond of the original packet. By default, the same packet traversing different VLANs is removed by L3 deduplication. In addition, packets must have the same length and the same IP ID, and TCP packets also must have the same TCP checksum. L2 duplication usually only exists if the exact same packet is seen through the data feed, which is typically related to an issue with port mirroring. L3 duplication is often the result of mirroring the same traffic across multiple interfaces of the same router, which can show up as extraneous TCP retransmissions in the ExtraHop system. 19
20 The System Health page in the ExtraHop Web UI contains charts that display L2 and L3 duplicate packets that were removed by the ExtraHop system. Deduplication works across 10Gbps ports by default and across 1Gbps ports if software RSS is enabled. L3 deduplication currently is supported only for IPv4, not IPv6. 20
21 Introduction to the ExtraHop Web UI The ExtraHop Discover and Command appliances provide access to your network, application, client, and infrastructure data through a dynamic and highly customizable Web UI. After you log into the ExtraHop appliance with a browser over HTTPS, you can immediately view your network activity through built-in system dashboards. If your environment includes a Command appliance, you can monitor all of the activity on your distributed Discover appliances from a single, centralized Command appliance. Log into the ExtraHop Web UI and explore your network environment through the following options: Top-down workflows Start with high-level charts and device groups that display all of the activity on your network. When you see something interesting, you can drill-down to specific devices and transaction details. Bottom-up workflows Search for a particular device, URI, or database. You can then explore real-time metrics and activity associated with that device, and pivot to different devices and protocols to learn more. Review system dashboards When you log into the ExtraHop system, you will see the Activity dashboard. This dashboard is a good starting point because it shows you everything happening on your network. For more information about this dashboard, and how to build your own, see the Get started with dashboards section. Drill down on interesting data When you see a spike in traffic or other interesting data, you can drill down to see which devices are associated with that data. For more information, see the Drill-down functionality section. Explore activity groups Another way to get a top-down view of specific activity is to explore activity groups. For more information, see the Activity groups section. Search for a device ExtraHop automatically discovers devices that communicate on the network. You can search for devices by IP address, URI, or other attributes. For more information, see the Find a device section. Create a group After you have found devices that are important to you, you can build a device group of devices and track their activity. For more information, see the Device groups section. Build a dashboard You can create a custom dashboard view of your devices to see real-time information that is most relevant to you. For more information, see the Dashboards section. Set up alerts Configure threshold and trend-based alerts that notify you when there is a potential issue with a network device. For more information, see the Alerts section. Create reports Generate reports on network metrics for a particular time interval, and export the information as a PDF file or as CSV data. For more information, see the Reports section. Build a geomap Geomaps display metrics across a global map, which indicates where metrics activity has occurred. For more information, see the Geomaps section. 21
22 Apply a bundle Bundles are system objects saved as a JSON file. A bundle contains information about a selected ExtraHop system configuration, such as triggers, dashboards, applications, or alerts. Apply a bundle to your ExtraHop system, or create a bundle to share with others. For more information, see the Bundles section. Build a trigger Create a custom metric with a trigger. Triggers are custom scripts that perform an action upon a predefined event. Triggers require planning to make sure a trigger doesn t negatively impact system performance. For more information, see the Triggers section. In addition, if your ExtraHop Discover appliance is connected to an ExtraHop Explore appliance, you can directly access stored transaction records through the Discover Web UI. Or, if you are monitoring multiple Discover appliances through a Command appliance, you can retrieve record information by node through the Command Web UI. Global navigation The ExtraHop Web UI provides a framework of elements that remain static as you move around the system. The information and options in the left and content panes of the Web UI change based on your selections in the top menu. The following figure identifies both global navigation elements and the areas of the Web UI that will change based on your selection. Top menu The following elements are located across the top of the Web UI. Dashboards Provides built-in system dashboards that give you an instant view of the activity on your network. You can also create and share dashboards with other users. 22
23 Metrics Provides access to system metrics sources, group metrics, and record queries. Records Runs a record query for the selected time interval and displays the New Record Query page, where you can add filters to refine your search. Packets Runs a packet query for the selected time interval and displays the New Packet Query page, where you can add filters to refine your search. Global search field Enables you to type any object or search criteria and find a match on your Discover appliance. If you have an ExtraHop Explore appliance configured, you can also search for saved records. Community icon Launches a new tab in your web browser to the ExtraHop forums and to other external resources. Help icon Launches documentation for the page that you are currently viewing. System Settings Provides access to system configuration options. User Icon Enables you to log in and log out of your Discover appliance or Command appliance, change your password, and access API options. Navigation bar The following elements are located across the top of the Web UI, below the top menu. Pane toggle Enables you to collapse or expand the left pane. Global Time Selector Enables you to determine the global time interval that is applied to all system metrics. Recent Pages Enables you to see the most recent pages you visited. Repeated pages are deduplicated and condensed to save space. Navigation Path Displays where you are in the system and provides available pivot points so you can search for the same metrics across multiple protocols, devices, or other swappable criteria. Command menu drop-down Appears throughout the Web UI and contains context-sensitive actions for the area you are in. For example, when you click the Dashboards top menu, the command menu at the end of the navigation bar provides options to view dashboard properties and to create a new dashboard. The left pane and content pane change based on your selections. See the following sections to learn more about each feature. Navigate dashboards Navigate metrics Navigate alerts 23
24 Time Selector The Time Selector enables you to specify a time interval for the collection and presentation of network data. There are two types of Time Selectors: a Global Time Selector for specifying global time intervals, and a Region Time Selector for specifying region time intervals. The Global Time Selector is located at the top-left of the navigation bar. Access the Region Time Selector by clicking the command menu next to the region name and selecting Use Region Time Selector. A global time interval is applied across the Discover appliance. Navigating from one area to another will not change the time interval for the metrics you are viewing. This means that the same time interval applies whether you are viewing different metrics across the Web UI or if you are drilling-down to view detailed metrics. Note: Logging out of the Discover appliance will reset the global time interval to the Last 30 minutes. However, global time interval information is included at the end of the URL. To maintain a specific global time interval after logging out, copy or bookmark the URL. Make sure that the entire URL is copied to maintain the specified global time interval. A region time interval is applied by dashboard region and you can set different time intervals per-region. When you add a widget to an existing region, the widget inherits the time interval for that region. You can apply either a global time interval or a region time interval to a dashboard region. To toggle between time intervals, start by clicking the command menu in the region header. To apply a region time interval, select Use Region Time Selector. To apply a global time interval, select Use Global Time Selector. When the Region Time Selector disappears from the region header, this indicates that the global time interval is applied to the region. Displaying running time and snapshot time intervals For dashboards and top-level metrics pages where metrics are polled automatically you will see the running time for the global time interval displayed in the Global Time Selector. For a detailed metric page or a records query results page where metrics are not polled automatically you will see the snapshot of the global time interval, which includes a blue refresh icon and gray text that indicates when the metric or record query was last polled. To reload the metrics or query for the specified time interval, click the refresh icon in the Global Time Selector display. Specify a global or region time interval Click the Global Time Selector or the Region Time Selector. From the Time Interval tab, select one of the following options: Last 30 minutes Displays the last 30 minutes of data collected. Last 6 hours Displays the last six hours of data collected. Last day Displays the last 24 hours of data collected. Last week Displays the last seven days of data collected. Last Displays the data collected within a customized unit of time. For more information, see the Specify a custom time interval section. 24
25 Custom time range Displays the data collected within a fixed date and time range. For more information, see the Specify a custom time range section. Click Save. Note: You can view metrics in charts with different levels of granularity based on the time interval that you specify. For more information, see the Time interval and data roll up section. Specify a previous time interval Time intervals are preserved across a login session. The five most recent unique time intervals are also saved in the History tab of the Time Selector. To select a previous time interval: Click the Global Time Selector or Region Time Selector. Click History. Select a time interval. You selection will be applied to the options on the Time Interval tab. Click Save. Specify a custom time interval To view metrics that occurred in a specific unit of time that is not available by default, such as minutes or months, you can modify the settings in the custom time interval option. To specify a custom time interval for a global or region time interval: Click the Global or Region Time Selector and select the Last radio button in the Time Interval tab. Type the number of units of time. Click the drop-down list and select minutes, hours, days, weeks, months, or years. Click Save. Specify a custom time range To view metrics that occurred during a specific time, you can specify a custom time range or you can zoom in on a chart. To specify a custom time range: Click the Global Time Selector or Region Time Selector. From the Time Interval tab, and select Custom Time Range. The drop-down field will display a default time range. Click the drop-down field. A calendar dialog box opens. Click a day to specify the start date for the range. One click will specify a single day. Clicking another day will specify the end date for the range. Note: Use the back and forward arrows on the calendar to change the month displayed on the calendar. 5. Click Save. Zoom in on a time range You can click-and-drag across a region in a line chart to zoom in and specify a custom time range in the Time Selector. For example, if you observe a spike in a chart, you can click-and-drag across the spike to zoom in on the activity that occurred in that time range. Note: This option is only available for time-series charts. It is not available for bar charts, text widgets, or tables. 25
26 If you are zooming in on a chart within a dashboard region that has a region time interval applied to it, this time range will become the region time interval for every widget in that region (unless you have applied a global time interval to that dashboard region). The ability to zoom in on a time range is useful for observing other metric activity that occurred in that same time range. For more information, see the Time Selector section. If the specified time range is valid it appears green. If the specified time range is less than one minute, the range is invalid and appears red. Note: Data might not be available for the zoomed time range. Click and drag your mouse across the chart to select a time range. Release the mouse button. The graph is redrawn to the specified time range. The scales on the chart s axes update to reflect the range of values in the zoomed time range. In addition, the Custom Time Range value in the Time Selector adjusts to reflect the time range in the chart. If you want to revert from the zoomed time range back to your original time interval, click the undo icon a magnifying glass with a minus sign in the Time Selector. For example, if you originally specified Last 30 minutes as your time interval, and then perform a series of zoom operations on a chart, you can revert back to your original 30-minute time interval with one click on the undo icon. Compare metric deltas Metric delta comparison is available for dashboards and device-related protocol pages. If you save a comparison and navigate to another area of the Discover appliance, the comparison is disabled temporarily. When you return to your original page, the delta comparison you saved will be enabled again. Note: Dynamic baselines will not appear on a chart when you are comparing metric deltas. There are two ways to perform a metric delta comparison: On a protocol page, where you can compare delta changes across all metrics displayed on a device, device group, or detail metric page. On a dashboard page, where you can compare delta changes by the entire dashboard or by the region Compare metric deltas on a protocol page Find the protocol page with the metrics that you want to compare. 26
27 In the upper left hand corner of the page, click the time interval to open the Time Selector. In the Time Interval tab, click Compare. In the Delta Comparison tab, select the time interval to compare with the original time interval. 5. Click Save. Charts display metric values from each time interval side-by-side. To remove the delta comparison, complete the following steps: a) Click the time interval to open the Time Selector. b) Click Remove Delta. c) Click Save. 6. Compare metric deltas on a dashboard page Find the dashboard with the metrics you want to compare. In the upper left hand corner of the page, click the time interval to open the Time Selector. In the Time Interval tab, click Compare. In the Delta Comparison tab, select the time interval to compare with the original time interval. 5. Click Save. A new chart with a delta comparison time interval is placed on the original chart. 27
28 6. To remove the delta comparison, complete the following steps: a) Click the time interval to open the Time Selector. b) Click Remove Delta. c) Click Save. Tip: You can also apply a metric delta comparison to an individual region. Click the region title, and select Use region time interval. Follow steps 3-6 to apply a metric delta comparison to all the charts within the region. 28
29 Dashboards A dashboard is an HTML page that displays real-time and historic data for any built-in or custom metric in the ExtraHop platform. In a dashboard, data is displayed in widgets, and widgets are assembled in regions. Dashboards are stored separately for each user that accesses the ExtraHop Discover appliance. After you build a custom dashboard, you can share it with other ExtraHop users. Tip: Essentials dashboards are created by ExtraHop staff to display common and related network metrics. A set of dashboards are available in the Essentials bundle on your ExtraHop appliance. For more information, see the Essentials bundle section. This section contains information about system dashboards and procedures on how to create and manage custom dashboards. Note: To learn more about dashboards, view the following training modules: Intro to Dashboards Build Your First Dashboard Using Dashboards to Organize and Present Data Get started with dashboards The ExtraHop Discover appliance provides expansive and granular metrics about the traffic on your network. The possibilities are endless, but the initial view can be overwhelming. A dashboard is a customizable HTML page that displays different views of your network through widgets such as charts. Dashboards are a powerful feature that can help showcase the data that is most relevant to your daily operations in real-time and manage the signal to noise ratio of your network activity. The information in the following sections will help you get started. How do I navigate dashboards in the Web UI? How do I plan and build my own dashboard? Note: To learn more about dashboards, view the following training modules. Intro to Dashboards Build Your First Dashboard Using Dashboards to Organize and Present Data Types of dashboards The ExtraHop appliance provides built-in system dashboards, but you can also create custom dashboards to display only the metrics you want to see. System dashboards Any ExtraHop user with an active account can log in and view system dashboards, which are built into the ExtraHop system. The Activity dashboard and Network dashboard are system dashboards that provide a top-down perspective of all the activity happening on your network. Custom dashboards ExtraHop users can create a custom dashboard, which is one of the most effective ways to create a single view of protocols, metrics, and devices that are the most important to your organization. Before you create a custom dashboard, we recommend that you first determine which metrics you want to visualize and monitor in your dashboard. For example, it helps to have a question you want to answer, or an idea of which metric sources applications, devices, groups, and networks that you want to monitor on a regular basis. 29
30 Activity dashboard page The built-in Activity dashboard displays the following information about your network. Traffic Overview View the types of traffic on your network. For example, the Top L7 Protocols chart displays the most active application protocols. The protocol with the most area, or color, in the chart has the highest volume of packet transmissions during the selected time interval. In the Alert History widget, you can also view up to 40 of the latest alerts that were generated, and their severity levels. Active Protocols View important metrics and activity about specific application protocols. Note: In the ExtraHop Command appliance, you can display the Activity dashboard for each Discover appliance. The appliance name appears in the navigation bar; click the down arrow next to the node name to pivot the display to other Discover appliances. Network dashboard page The built-in Network dashboard displays the following information about your network. Network L2 metrics View raw data throughput at the data link layer (L2). You can view throughput, the packet rate, and the breakdown of frame counts by distribution and type. Network L4 metrics View TCP activity through connection, request, and response metrics. This data can indicate how effectively data is being sent and received across the transport layer (L4) in your network. Network Performance View overall network performance by reviewing the throughput per application protocol and the magnitude of high TCP round trip times. Network L3 metrics View data throughput at the Internet layer (L3), and see packets and traffic by TCP/IP protocols. DSCP View a breakdown of packets and traffic by Differentiated Services code points, which is part of the DiffServ network architecture. Every IP packet contains a field to express the priority of how the packet should be handled, which are called differentiated services and the values for the priorities are called code points. Multicast Groups View traffic that is sent to multiple receivers in a single transmission, and see packets and traffic by each receiver group. Multicast traffic on a network is organized into groups based on destination addresses. Note: In the ExtraHop Command appliance, you can display the Network dashboard for each Discover appliance. The appliance name appears in the navigation bar; click the down arrow next to the node name to pivot the display to other nodes. Navigate dashboards When you log into the ExtraHop appliance for the first time, you will see the Activity dashboard, which a built-in system dashboard that displays a high-level overview of all the activity happening on your network. There are several ways to explore dashboards and the metrics displayed in them. The following figure shows the available navigation options that you can interact with to configure and view metrics. 30

31 Dashboard dock Access and organize custom, built-in, and shared dashboards. For more information, see the Organize dashboards section. Global Time Selector Change the time interval for the entire dashboard. For more information, see the Time Selector section. Region header Change the time interval for the region, rename the region, modify sources, or delete the region. Chart legend Drill down on metrics, isolate data (hold focus), and view metric definitions. Command menu Edit the dashboard layout and dashboard properties, create a dashboard, or copy, print, present, share, or delete your dashboard. Chart title Edit, print, copy, and rename charts. You can also navigate to protocol pages associated with chart sources (Go to...), export chart data, and view metric definitions. Plan a dashboard Building a custom dashboard is one of the most effective ways to monitor high-priority network traffic and troubleshoot an issue. There are four basic steps to building a custom dashboard from the Dashboard page: Identify the devices or traffic that you want to monitor. For example, there are three categories of metrics you might want to start with: Availability metrics: These metrics track client requests and server responses and help answer the question, is my server offline or unavailable? Reliability metrics: These metrics track error rates for server responses and help answer the question, is my server functioning properly? 31
32 Performance metrics: These metrics track server performance by measuring server processing times for sending response to requests and help answer the question, is my server properly resourced? Create a dashboard, which will provide an empty region containing an empty chart and empty text box widget. Add data to the empty chart with the Metric Explorer, which provides options for configuring metric sets and chart types. Select a metric source, which might be an important server (such as web server, database, or LDAP server) or a group of devices generating specific traffic (such as all HTTP clients). Select metrics, which might be about availability (such as HTTP request and response rates), reliability (such as database errors over time), or performance (such as server processing times). Select a chart type. Configure a dashboard, by adding more widgets and regions. Tip: Consider adding multiple chart types for a single metric to create multiple views of that data. Note: You can also build a dashboard from a protocol page. This method enables you to quickly add charts to a new or existing dashboard around an application, device, network, or group that you are exploring in the Web UI. For more information, see the Create a chart from a protocol page section. Note: Learn more by taking the Build Your First Dashboard training. Dashboard components Dashboards are composed of customizable regions and widgets. Regions are spaces that hold and compartmentalize widgets. Widgets are objects contained within regions. A widget is a chart, text box, alert history list, activity group list, or network list. Understanding how these components work and the type of information each widget displays can help you build your dashboard. Region A region is a compartment that contains widgets. You can modify regions in the following ways: Apply a specific time interval or range to all of the widgets within a region. Note: See the Time Selector section to learn about the differences between the global time interval and region time interval. Rename the title of your region. Modify the metric source for all of the widgets within a region. Delete a region, which will also delete all of the widgets within that region. You can click and drag from the lower right corner of the region to resize the compartment and make room for additional widgets. For more information, see the Edit a dashboard layout section. Widget Widgets are configurable dashboard components that can be added to a region for different functions. Drag-and-drop different types of widgets into a region, or drag-and-drop a new region onto your dashboard. The following widget types are available: Chart widget A chart contain metrics. When you configured the chart for the first time, you need to select which chart is best for visualizing data. For example, candlestick chart is effective for seeing outliers easily. For more information, see Edit a chart widget section. 32
33 Text box widget A text box contains that text that you write and format in Markdown. Text boxes are useful for adding descriptive information about charts and regions. For more information, see Edit a text box widget section. Alert History widget Displays details about active alerts for metric sources on your network. For example, with this widget, you can quickly identify emergency alerts that have fired, and then navigate to the source of the alert. Activity Groups widget Displays the number of devices in activity groups. The Discover appliance automatically generates activity groups, which are groups of devices based on the type of network traffic they generate. A device might appear in more than one activity group if it has multiple types of traffic. For example, with this widget, you can see how many CIFS clients are actively generating requests on your network. Networks widget (Command appliance only) Displays the details about network captures that the Command appliance is configured to monitor. You can see how many devices and applications are active on each network. Charts FAQ Here are some answers to frequently asked questions about charts. This topic provides answers to frequently asked questions about how dashboard charts work in the ExtraHop system. How do I create a chart? How do I edit an existing chart? Which chart type should I select to compare data? Which chart type should I select to observe changes over time? When should I create a box plot, candlestick, or histogram chart? When should I create a heatmap? What are maximum, minimum, and average rates? Can I add trend lines to my chart? How do I add a rate to my chart? How do I change the units in my chart? How do I change a chart name? How do I change the labels in my chart? Why do I see Incompatible selections when I hover over a chart type? Why is there no data in my chart? How do I create a chart? You can create a chart in one of the following ways: Create a new dashboard. An empty chart will appear in your new dashboard, which you can then edit with the Metric Explorer. Add a new chart to an existing dashboard by editing the dashboard layout. In the upper right corner, click the properties menu and select Edit Dashboard Layout. You can then add new empty chart widgets to your dashboard. Create a new chart based on a built-in chart from a protocol page. Click the chart title and select Create Chart from... You can then save your chart to a dashboard. 33
34 How do I edit an existing chart? Click on the chart title and select Edit. You edit a chart with the chart-building tool called the Metric Explorer. In the Metric Explorer, you select a source, protocol metrics to display from that source, and a chart type. Which chart type should I select to compare data? The following chart types are helpful if you want to compare two metrics together, for example the total number of requests compared to the total number of responses. Bar chart List chart Table chart Value chart Which chart type should I select to observe changes over time? The following chart types are helpful if you want to observe how a metric, such as errors, changes over time. Line chart Area chart Column chart When should I create a box plot, candlestick, or histogram chart? Box plot, candlestick, and histogram charts help you visualize the statistical distribution of data for timing metrics in the ExtraHop system. Timing metrics include server processing time and round trip time. Box plot chart: Displays the distribution summary of a single metric. You can compare different metrics such as processing time (for application latency) and round trip time (for network latency) side-by-side. Candlestick chart: Displays changes to the distribution summary for a single metric over time. Histogram chart: Displays the entire distribution for a single metric. Data is placed into bins instead of percentiles. Histograms help you quickly find outliers, because you can interpret the value of each bin, rather than interpret percentiles. Note: Depending on the type of metric you select, you can view the distribution of metric activity as percentiles or as a mean and standard deviation. The box plot and candlestick charts display inner quartiles by default (5th, 25th, 50th, 75th, and 95th percentiles). Drill down on a timing metric to view the mean and standard deviation of a timing metric broken down by client, server, and other factors. When should I create a heatmap? A heatmap displays a distribution of percentiles over time. You can only view timing metrics such as server processing time and round trip time in a heatmap. For example, a heatmap is useful for identifying concentrations of high server latency at a specific time. What are maximum, minimum, and average rates? Network byte and packet data can be displayed in a chart as a maximum, minimum and average per second rate. The Rate Summary in a chart displays these three rates together. Configuring a chart to display the Rate Summary is only available for high-precision metrics, where metric data is aggregated into 1-second intervals. In the ExtraHop system, high-precision metrics are Network Bytes and Network Packets. For more information, see Display a rate or count in a chart. 34
35 Can I add trend lines to my chart? You can add a dynamic baseline to your chart. A baseline is essentially a trend line that is calculated based on historical data. Baselines help you distinguish between normal and abnormal activity in your chart data. The Discover appliance does not begin calculating a dynamic baseline until the setting is enabled from the Options tab in the Metric Explorer. Therefore, dynamic baselines only appear for time periods that occur after the baseline was enabled. For more information, see Add a dynamic baseline to a chart. You can also add a static threshold line to your chart. A threshold line helps you determine if activity is falling above or below a specific value, which is helpful for monitoring service level agreement (SLA) compliance. For more information, see Add a static threshold line to a chart How do I add a rate to my chart? Count metrics, such as errors, requests, and responses, are displayed as total counts in charts by default. But you can also display these metrics as a rate in a chart. Below the metric name in the Metric Explorer, click Count, and select the type of rate to display. For more information, see Display a rate or count in a chart. How do I change the units in my chart? You can change units from bytes to bits, linear to log scale, or from the decimal prefix (1,000 bytes) to binary prefix (1,024 bytes). You can also abbreviate values in bar, value, and list chart types. Click the Options tab when editing a chart in the Metric Explorer. How do I change a chart name? Click the chart title and select Rename. How do I change the labels in my chart? You can rename metric labels that appear in the legend for most charts. Click on the metric label in the chart and select Rename. This option is not available for box plot, candlestick, heatmaps, or status chart types. Why do I see Incompatible selections when I hover over a chart type? Some chart types are only compatible with certain types of metrics. When editing a chart, you might see an Incompatible selections message as you hover over a chart type. This message means that the metric you already selected is incompatible with the chart type. For example, If you selected an error, request, response, or network bytes metric, you will see an Incompatible selection message as you hover over the following chart types: Heatmap Histogram Candlestick Box plot These chart types are only compatible with timing metrics such as server processing time and round trip time. Why is there no data in my chart? There might not be activity for the source or protocol metric you selected for your chart during the time interval you selected. Adjust the time interval to see if data appears in your chart. If you are not seeing the traffic you are expecting, contact ExtraHop Support for help. 35
36 Create a dashboard When you create a dashboard, a region containing an empty chart and text widget appear for you to configure. You can expand the region to include a maximum of six charts that are of minimum width. Region and dashboard length are unlimited. On the Dashboards page, create a dashboard by: Click New Dashboard at the bottom of the left pane (dashboard dock). Click the command menu in the upper right corner of the page and select New Dashboard. In the Dashboard Properties window, review the following: Title Type a name for the dashboard. Author Type your name. Description Type a brief description of the dashboard. Permalink (Optional) To change the five-character unique identifier, also known as a short code, click the link and type a meaningful name. The identifier appears after /Dashboard in the URL. Note: The permalink can have up to 100 characters combining letters, numbers, and the following symbols: dot (.), underscore (_), dash (-), plus sign (+), parentheses ( ), and brackets ([ ]). The name cannot contain spaces. Editors Specifies the names of users that have editing access for the dashboard. The default editor is the author. Add editors to your dashboard by sharing your dashboard. For more information, see the Share a dashboard section. Theme Select a radio button to specify a style for the dashboard. Select Light, Dark, or Space. Click Create. The new dashboard is populated with a region that contains an empty chart and text box widget. You can now edit your chart and edit your text box. Click Exit Layout Mode when you are satisfied with your changes. Important: You can also create a dashboard from protocol pages. For more information, see the Create a chart from a protocol page section. Next steps Edit a chart widget Edit a text box widget Edit a dashboard layout Edit a chart widget The following steps show the general flow for editing a chart widget in the Metric Explorer tool. Begin by specifying sources and metrics to add data to your chart. Then choose a chart type to visualize the data. Finally configure data calculations and adjust the chart appearance. Note: You can display rates (such as an average rate, maximum rate, or minimum rate) or percentiles in your chart, depending on the metric you select. For more information, see the Display rates or counts in a chart and Display percentiles or a mean sections. 36
37 Open the Metric Explorer by completing one of the following steps: For any chart, click the chart title and then select Edit. For dashboard charts, click the command menu in the upper right corner and select Edit Layout. Click anywhere within the chart. Add sources and metrics to your chart by completing the following steps: a) Click Add Source. b) In the source search field, type the name of a source, such as an application, device, device group, or network. c) d) e) f) g) Tip: Underneath the search field, click Any Type to filter search results to a specific source type. Select the source you want to add. In the metric search field, type the keywords for the metric you want to view. For example, to view HTTP transaction data coming from a client to your web servers, type HTTP requests. Tip: Underneath the search field, click Any Protocol to filter search results to a specific protocol or custom metric. Select the metric you want to add. To remove a metric, click the x icon in the upper left corner in the metric field. Or, to replace a metric, click the metric name to open a new search. (Optional) To add more metrics to your metric set, click Add Metric and then search for the metric you want to include in the metric set. To add more sources to your chart, click Add Application, Add Device, Add Group, or Add Network, and then search for and select the source you want to add. You can only select the same source type that is currently in your metric set. A metric set contains one source type and metrics. For example, if you select the All Activity application as the source, you can only add more applications to that metric set. To include a different source type in your chart, such as a device, click Add Source to start a new metric set. Tip: If you are displaying more than one source in your chart, such as two applications, you can create an ad hoc source group by selecting Combine Sources. You can then view a single metric value for both applications. Select a chart type from the bottom of the Metric Explorer. Some charts might not be compatible with your selected metrics. For example, the heatmap chart can only display dataset metric data, such as Server Processing Time. For more information about charts and compatible metrics, see the Chart types section. Modify how data is displayed by doing the following optional steps: a) Display detail metrics by key in a chart. b) Display device group members in a chart. c) Display rates or counts in a chart. d) Display percentiles or a mean. e) Add a dynamic baseline. f) Add a static threshold line. Modify chart properties by doing the following optional steps: a) Change chart title. b) Change chart appearance to grayscale. c) Change a metric label in a chart legend. d) Abbreviate metric values in a chart. e) Change drill-down chart labels. f) Display chart legend. g) Change chart units. h) Sort chart data. (Optional) In the preview pane, click Last 30 minutes to select a different time interval and see how your data appears at different time points. 37
38 7. Note: The time interval you preview in the Metric Explorer does not apply to your saved dashboard. Click Save. Next steps Review frequently asked questions about charts Dynamic baseline Dynamic baselines help distinguish between normal and abnormal activity in your chart data. Select a baseline type that best fits your environment. For example, if you regularly see dramatic changes from one day to another, select an hour-of-week baseline that compares activity seen on specific days of the week. If HTTP activity spikes on Saturdays, this baseline can compare the current spike in HTTP activity with the level seen on other Saturdays at the same hour. Discover appliances calculate dynamic baselines based on historical data. To generate a new data point on a dynamic baseline, an appliance calculates the median value for a specified period of time. The following table displays how each type of baseline is calculated: Type Sample window Compares Baseline updated Hour of day 10 days The same hour of the day. For example, every day at 2:00 PM. Every hour Hour of week 5 weeks The same hour of week. For example, every Wednesday at 2:00 PM. Every hour Short-term trend 1 hour Every minute. Every 30 seconds For example, assume you configure an hour-of-week baseline for HTTP responses on a Sunday. At 10:00 PM, the appliance determines how many HTTP responses there were at 10:00 PM for the last 5 Sundays and calculate the median value; the median number of responses then appear as the baseline value for that hour. Discover appliances do not begin calculating a dynamic baseline until the setting is enabled. Therefore, dynamic baselines only appear for time periods that occur after the baseline was enabled. Keep in mind that an appliance can begin building a dynamic baseline only if the necessary amount of data has been collected. For example, if you create an hour-of-day baseline, and the Discover appliance has only been collecting data for six days, the appliance will not begin drawing the baseline until four more days have passed because an hour-of-day baseline requires at least 10 days of data. Dynamic baselines require a Discover appliance to calculate and store baseline data. Therefore, creating a baseline consumes system resources, and configuring too many baselines might degrade system performance. If two identical dynamic baselines exist in separate dashboards, the dashboards reuse the baseline data; however, the baselines must be identical. If you select a new baseline type, the new dynamic baseline will not share data with the previous dynamic baseline. Note: Dynamic baselines will not appear on a chart while comparing metric deltas. Add a dynamic baseline You can add a dynamic baseline to a chart to help distinguish between normal and abnormal activity. Warning: Deleting or modifying a dynamic baseline can remove dynamic baseline data from the system. If a dynamic baseline is not referenced by any dashboards, the data will be removed from the system to free unused system resources. 38
39 Note: Baselines are only supported in area, candlestick, column, line, and line & column charts. Click the chart title and then select Edit. Click Analysis. Under Dynamic Baselines, select the type of dynamic baseline you want to add. Option Description Hour of day Creates a dynamic baseline that displays the median value for a given hour of the day. This option is most useful if activity in your environment usually follows a consistent daily pattern. If you regularly see dramatically different levels of activity on different days of the week, this option is less useful because the baseline usually does not match the current values. Hour of week Creates a dynamic baseline that displays the median value for a given hour on a specific day of the week. This option is most useful if you regularly see significantly different levels of traffic during each day of the week. Short-term trend Creates a dynamic baseline that displays the median value for the last hour. This option is useful for smoothing chart data to reveal shortterm trends. Click Add to Dashboard. Add a static threshold line Displaying a static threshold line in a chart can help you determine which data points are either below or above a significant value. For example, you can create a line chart for server processing time to help you monitor the performance of an important database in your network environment. By adding a threshold line that defines an service level agreement (SLA) boundary of acceptable processing time, you can see when database performance is slowing down and address the issue. You can add one or more threshold lines as you edit a chart. These lines are local to the chart and not associated with other widgets or alerts. Threshold lines are only available for the following charts: Area Candlestick Column Line Line & Column Status To add a static threshold line to an existing chart: Click the chart title and then select Edit. Click Analysis. In the Static Thresholds section, click Add Threshold Line. In the Value field, type a number that indicates the threshold value for the line. This value determines where the line appears on the y-axis of your chart. Note: For charts that display only count metrics (such as bytes, errors, and responses), the value of the threshold line automatically scales based on data calculations that are 39
40 5. 6. configured in the chart. When the Show as rate (per second) option is not selected, the line value automatically scales to the roll up period (either 30 seconds, 5 minutes, 1 hour, or 1 day). The roll up period is determined by the time interval you specified. In the Label field, type a name for your threshold line. In the Color field, select a color (options are gray, red, orange, or yellow) for your threshold line. Display rates or counts in a chart In a chart, count metric data can be calculated as an average rate per second or displayed as a total number of events over time. After configuring your initial selection, you can toggle between these data views in the chart. In addition, you can display the maximum rate, minimum rate, and average rate in a chart for high precision, or 1-second, Network Bytes and Network Packets metrics. Note: Depending on the count metric you select, you will see the following default displays: Count For the majority of count metrics, such as errors, requests and responses, the total count is automatically displayed. Average rate For network and packet-related count metrics, the average rate per second is automatically displayed. Rate summary For specific 1-second throughput (Network Bytes) and packet (Network Packet) count metrics, the maximum, minimum, and average rates is automatically displayed. Tip: For charts with more than one count metric selected, avoid displaying rates and counts together in the same chart. It can skew the scale of the y-axis. The y-axis will include a "/s" on tick labels only if all metrics are displaying rates. Click the chart title and then select Edit. Select a count metric. Note: A count metric is associated with specific number of events that occurred over time. For example, a byte is recorded as a count metric, and can either represent a throughput rate (as seen in a time series chart) or total traffic volume (as seen in a table). Errors, packets, requests, and responses are also recorded as count metrics. Select a chart type that is compatible with count metrics (includes line, value, column, bar, pie, and list charts). Select a data calculation to display in your chart: To display the average rate per second, click the drop-down list underneath the metric name and select Average Rate. To display the count, click the drop-down list underneath the metric name and select Count. To display a maximum rate, minimum rate, and average per second, click the drop-down list underneath the metric name and select Rate Summary, Maximum Rate, or Minimum Rate. These types of rates are only available for the following sources and metrics: Network source > Network Bytes (total throughput) Network source > Network Packets (total packets) Device source > Network Bytes (combined inbound and outbound throughput by device) Device source > Network Bytes In (inbound throughput by device) Device source > Network Bytes Out (outbound throughput by device) Device source > Network Packets (combined inbound and outbound packets by device) Device source > Network Packets In (inbound packets by device) Device source > Network Packets Out (outbound packets by device) 40
41 Note: Charts that were configured in a previous version of ExtraHop firmware, with the Show as rate option selected, now display the Average rate. Display percentiles or a mean You can configure a chart to display statistical calculations for metric data, such as percentiles or a mean. A percentile is a statistical measure to determine if a data point falls below or above a given percentage amongst all of the data in a dataset metric type. A mean is the calculated average of all of the data in a sampleset metric type. You can also view the standard deviation for a sampleset metric type only. Click the chart title and then select Edit. Select a source and then a dataset or sampleset metric. The median (50th percentile) automatically displays for dataset metrics in most charts. The mean automatically displays for sampleset metrics. Note: A dataset metric is usually associated with time, such as server processing time or round trip time. Sampleset metrics are often the detail metrics for dataset metrics. Only compatible metrics are displayed in metric search results when you select a percentilebased chart, such as a heatmap, candlestick, or histogram chart. Select a chart type that is compatible with dataset or sampleset metric (includes all chart types except for the pie chart). Select a statistical calculation to display in your chart: To display a summary of percentiles (from the 5th to 95th percentiles), click the drop-down list underneath the metric name and select Summary. To display a specific percentile, click the drop-down list underneath the metric name and select Percentile. In the Set Percentiles field, type numbers separated by a comma. For example, to view the 10th, 30th, and 80th percentiles, type 10, 30, 80. To display the 100th percentile value, click the drop-down list underneath the metric name and select Maximum. To display the 0th percentile value, click the drop-down list underneath the metric name and select Minimum. To display the 50th percentile value, click the drop-down list underneath the metric name and select Median. Note: The median, percentile, maximum, and minimum displays are unavailable for heatmap and histogram charts. Filter outliers Histogram and heatmap charts display a distribution of data. However, outliers can skew how the distribution displays in your chart, making it difficult to notice patterns or average values. The default filter option for these charts excludes outliers from the data range and displays the 5th-95th percentiles. You can change the filter to view the full range of data (Min to Max), including outliers, in your chart through the following procedure. Click the chart title and then select Edit. 5. Select the histogram or heatmap chart. Click Options. From the Default filter drop-down list in the Filters section, select Min to Max. Click Save. Display detail metrics by key in a chart You can edit a chart to display metrics broken down by key. When you drill down on a metric in the Metric Explorer, you can view up to 20 top key values in a chart for a specific time interval. A key can be a client IP address, hostname, method, URI, referrer, or more. For example, if your chart displays a total count for HTTP Requests, you can drill down by client to view the IP addresses that sent the most requests to your web servers. 41
42 Log into the Web UI on the Discover appliance. Click the chart title and then select Edit. In the Details section, click Drill down by <None>, where <None> is the name of the detail metric key currently displayed in your chart. Select a key from the drop-down list. Note: If you have more than one source selected in your metric set, such as two devices, the sources are automatically combined into an ad hoc source group as you drill down. You cannot deselect the Combine Sources checkbox. To view detail metrics for each source, you must remove a source from the metric set and then click Add Source to create a new metric set. If detail metric data for a common key is available for all of the metrics in a metric set, the detail metrics automatically appear in the drop-down list, as shown in the following figure. If a detail metric in the list is grayed out, data is unavailable for all of the metrics in that metric set. For example, client, server, and URI data are available for both HTTP Requests and HTTP Responses metrics in the metric set. 5. You can filter detail metric keys with an approximate match, regular expression (regex), or exact match through one of the following steps: a) In the Filter field, select the # icon to display keys by an approximate match or with regex. You must omit forward slashes with regex in the approximate match filter. b) In the Filter field, select the = icon to display keys by an exact match. Note: Regex is unsupported in the exact match filter (Optional) In the top results field, enter the number of keys that you want to display. These keys will have the highest values. To remove a drill-down selection, click the x icon. Note: You can display an exact key match per metric, as shown in the following figure. Click the detail metric name (such as All Methods) to select a specific detail metric key (such as GET) from the drop-down list. If a key appears gray (such as PROPFIND), detail 42
43 metric data is unavailable for that specific key. You can also type a key that is not in the drop-down list. Regular expression filter examples Regular expression (regex) is supported in the Metric Explorer when drilling down for detail metrics. The following examples will help you create simple and effective regex strings for filtering detail metrics keys, such as IP addresses. Note: In the ExtraHop system, regex is most effective when you want to filter metric data by a parameter contained within the metric key, such as a number within any IP address. Regex is not effective for filtering for details by an exact match, such as filtering to specify an exact IP address. Chart Scenario Regex filter How it works Compare HTTP status codes 200 ( ) to 40 Matches 200 and 404 codes where the symbol serves as an OR function. Display all HTTP 400 and 500 error codes occurring on your network. ^[45] Matches a 4 or 5 in the status code. Display any IP address with a Matches 1, 8, and 7 characters in the IP address. Review all IP addresses containing \.18\. Matches 187 and the character. that follows the 187. For example, this filter returns results for , , or /16. Display any IP address except ^(.(?! ))*$ Matches anything except Change drill-down chart labels Each chart provides an option to display available detail metric key values by hostname or origin. If the hostname or origin value is unavailable, the IP address automatically displays. 43
44 Note: This option is not available for candlestick, histogram, heatmap, and status charts. Click the chart title and then select Edit. Click Options. In the Labels section, select one of the following options: Hostname if available. Displays the hostname for each device is collected from naming protocols such as DNS and DHCP. If you assigned a custom name to a device, the custom name displays instead of the hostname. Deselect Show custom device names to always display the hostname. Origin if available. Displays the origin for each request, which is collected from values in the HTTP origin header fields such as X-Forwarded-For or X-Client-IP. Click Save. Display device group members in a chart You can edit a chart to display up to 20 members in a device group. When you drill down by group member in the Metric Explorer, you can view metrics per device within the group in the chart. If you drill down by group member, you cannot drill down by a key for those group members. To see detail metrics by key for one or more group members, we recommend creating another chart with specific devices selected as the source. Log into the Web UI on the Discover appliance. Click the chart title and then select Edit. Make sure a device group or activity group is selected as your source. For more information about how to select sources and metrics, see the Edit a chart widget section. In the Details field, click Drill down by <None>, where <None> is the name of the detail metric currently displayed in your chart. Then, select Group Member. In the top results field, enter the number of group members that you want to display. These devices will have the highest metric values. You can display up to 20 group members. To remove the drill-down selection, click the x icon Change chart title The chart title, which is automatically determined by which source and metrics you select for your chart, can be changed to a custom title. Click the chart title and select Rename. In the Display custom title field, type a new chart title. Click Save. Note: To display the automatic title again, select Display default title. Custom metric labels You can change the default metric label in a chart to a custom label. For example, you can change "Network Bytes" to "Throughput." Note: The ability to rename a metric label is not available for box plot, candlestick, heatmap, or status charts. Custom metric labels only apply to individual charts. A custom label persists if you complete one of the following actions: Add new sources and metrics to your chart Copy the chart to another dashboard Share the dashboard with another user 44
45 To prevent the mislabeling or inaccuracy of a custom label when metric data changes, a custom label clears if you change the following data parameters: Source Metric Data calculation. For example, a custom label clears if you change the data calculation from median to percentile. But a custom label persists if you change a count metric to a rate. Drill-downs. For example, the custom label for a top-level metric, such as"requests," clears when you drill down by key, such as clients. Note: If you change the label for a metric after drilling down, and there is no data available for that metric or key, then the top-level label displays. Tip: Type the variable, $KEY, into the Display custom name field to change how the drilldown key displays within the custom label. For example: Type $KEY errors to display "17281 errors" Type [$KEY] errors to display "[17281] errors" Change a metric label in a chart legend You can rename the label for metric, which is displayed in a chart legend. Note: The custom metric label in a chart is not applied globally across the ExtraHop system. Click the chart title and then select Edit. Note: For more information, see the Edit a chart widget section. In the preview pane of the Metric Explorer, click the metric label in the legend, and select Rename. Note: You cannot directly edit the labels for delta or trend series. You can change the label for a top-level metric, which all apply to the delta or trend series. In the Display custom label field, type a custom name.the custom series name must be unique from other series in the chart. Note: For detail metrics, the custom label is prepended to the key. You can preview how the custom label appears for all top keys displayed in your chart. For more information, see the Custom metric labels section. Click Save. A custom label is saved or discarded when the chart changes are saved or discarded. Change chart appearance to grayscale Charts display data in color by default, but all charts provide the option to display data in grayscale. Note: If your chart contains an alert that is assigned to metric data, and that alert status is active, the chart data displays in color and will not display in grayscale. For example, data in the status chart will rarely be displayed in grayscale. Click the chart title and then select Edit. Click Options. From the Chart style drop-down list in the Appearance section, select Grayscale (except alert status). Change chart units Each chart provides an option to specify the units and scale for data in your chart. You can convert bytes to bits, convert linear scale to log scale, and select the suffix notation from base 2 or base 10. Click the chart title and then select Edit. Click Options. (Optional) In the Units section, select Convert bytes to bits. 45
46 Note: The bytes unit is displayed in charts as "B." The bits unit is displayed as "b." (Optional) In the Units section, select Set log scale for y-axis. Note: This option is unavailable for histogram charts. 5. (Optional) In the Units section, from the Suffix notation drop-down list, select Base 2 (Ki = 1024) or Base 10 (K = 1000). Note: This option is unavailable for histogram and heatmap charts. 6. Click Save. Display chart legend The area, column, line, line & column, and pie charts provide an option to hide a legend. Click the chart title and then select Edit. Click Options. In the Legend section, select Display legend. Abbreviate metric values in a chart Bar, list, and value charts display the full numeric value by default. You can abbreviate this value in your chart to improve readability. For example, the value of 16,130,542 bytes can be abbreviated to 16.1 MB. Click the chart title and then select Edit. Click Options. In the Units section, select Abbreviate numbers. Click Save. Sort chart data The bar, list, and value charts provide a sorting option that sorts data by the order in which the metrics were added to your chart, by the detail metric key name, or by the data value (highest to lowest, for example). Click the chart title and then select Edit. Click Options. From the Sort metric by down-down list in the Sort field, select Order Added, Key Name, or Value. Click Save. Change percentile precision The pie chart provides a percentile precision option that specifies the decimal precision, or the number of digits, displayed in your chart. Percentile precision is useful for displaying ratios of data, especially for service-level agreements (SLA) that might require a precise data for reporting Click the chart title and then select Edit. Select the pie chart. Click Options. In the Units section, select Show percents instead of counts. From the Percent precision drop-down list, select the decimal precision value, such as 0.00% or 0.000%. Click Save. 46
47 Include sparklines The list and value charts provide an option to include a sparkline for each metric selected in the chart. The sparkline is a small, gray chart that looks similar to an area chart and shows how data changes over time. 5. Click the chart title and then select Edit. Select the list or value chart. Click Options. In the Layout section, select Include sparklines. Click Save. Display alert status in a chart The list and value charts provide an option to display data with an alert status color. Different colors indicate the severity of the configured alert. For example, you can configure a value chart to display the metric data in red when an alert threshhold is crossed. For more information about creating and configuring alerts, see the Alert settings section. Note: Colors for the most severe alert assigned to the source and metric will display in the chart by default. Click the chart title and then select Edit. Click Options. In the Labels section, select Use color to show alert status. Click Save. Chart types Chart types effectively control how your data is displayed in a dashboard. The Metric Explorer has several chart types, some of which carry restrictions. For example, you can only display dataset metric types in a heatmap or histogram chart. Tip: Hover your mouse over each chart type in the ExtraHop Web UI to learn about any metric or configuration requirements. Learn more about each chart type in the following sections: Chart type Description Compatible metrics Area chart Displays metric values as a line that connects data points over time, with the area between the line and axis filled in with color. Any metric type. Bar chart Displays the total value of metric data as horizontal bars. Any metric type. Box plot chart Displays variability for a distribution of metric data as horizontal lines that contain three or five data points. Dataset and sampleset metric types. Candlestick chart Displays data calculations for a distribution of metric values over time. Dataset metric type and highprecision, or 1-second, network (L2) count metrics. Column chart Displays metric data as vertical columns over a selected time interval. Any metric type. 47
48 Chart type Description Compatible metrics Heatmap chart Displays a distribution of metric data over time, where color represents a concentration of data. Dataset metric type only. Histogram chart Dsplays a distribution of metric data as vertical bars, or bins. Dataset metric type only. Line chart Displays metric values as data points in a line over time. Any metric type. Line & column chart Displays metric values as a line, which connects a series of data points over time, with the option to display another metric as a column chart underneath the line chart. Any metric type. List chart Displays metric data as a list with optional sparklines that represent data changes over time. Any metric type. Pie chart Displays metric data as a portion or percentage of a whole. Count, maximum, snapshot metric types only. Status chart Displays metric values in a column chart and the status of an alert assigned to both the source and metric in the chart. You can only select one source and metric to display in this chart. Table chart Displays metric values in a table. Any metric type. Value chart Displays the total value for one or Any metric type. more metrics. Area chart The area chart displays metric values as a line that connects data points over time, with the area between the line and axis filled in with color. If your chart contains more than one metric, data for each metric is displayed as an individual line, or a series. Each series is stacked together to illustrate the cumulative value of the data. Select the area chart to see how the accumulation of multiple metric data points over time contribute to a total value. For example, an area chart can reveal how various protocols contribute to total protocol activity. Tip: You can isolate individual series in the chart by clicking on the legend. Available metrics for this chart This chart is compatible with any metric type. The types of data calculations that you can display in this chart include rates, percentiles, and the mean. Bar chart The bar chart displays the total value of metric data as horizontal bars. Select the bar chart when you want to compare the data for more than one metric for a selected time interval. Available metrics for this chart This chart is compatible with any metric type. 48
49 The types of data calculations that you can display in this chart include rates, percentiles, and the mean. Note: This chart does not support baselines or threshold lines. Box plot chart The box plot chart displays variability for a distribution of metric data. Each horizontal line in the box plot includes three or five data points. With five data points, the line contains a body bar, a vertical tick mark, an upper shadow line, and a lower shadow line. With three data points, the line contains a vertical tick mark, an upper shadow, and lower shadow. Tip: Hover over the line to view all percentiles and count values (total number of events that occurred) for the chart. Available metrics for this chart This chart is compatible with the dataset and sampleset metric types. You can display the following data calculations in this chart: Summary For dataset metrics, the Summary displays the 95th, 75th, 50th, 25th, and 5th percentile values. The line contains five data points. The body represents the range from the 25th percentile to the 75th percentile. The middle tick mark represents the 50th percentile (median). The upper shadow line represents the 95th percentile. The lower shadow represents the 5th percentile. For sampleset metrics, the Summary displays the +/-1 standard deviation and the mean values. This line contains a vertical tick mark to represent the mean, and an upper and lower shadow line to represent standard deviation values. Percentile... For dataset metrics, the Percentile displays either three or five custom percentiles. Each percentile you enter must be separated by a comma and a space. If you specify three data points, the line represents the range of percentile values. The middle tick mark represents the middle value. The upper shadow represents the top range for your selection. The lower shadow is the bottom range of your selection. Note: This chart does not support baselines or threshold lines. Candlestick chart The candlestick chart displays variability for a distribution of metric data over time. Vertical lines at each time interval displays three or five data points. If the line has five data points, it contains a body, middle tick mark, an upper shadow line, and a lower shadow line. If the line has three data points, it contains a middle tick mark. Select the candlestick chart to view the variability of data calculations for a specific period of time. Available metrics for this chart This chart is compatible with the dataset metric type and high-precision, or 1-second, network (L2) count metrics. The types of data calculations that you can display in this chart include: Summary Summary displays the 95th, 75th, 50th, 25th, and 5th percentile values for dataset metrics. The line will contain five data points. The body represents the range from the 25th percentile to the 75th percentile. The middle tick mark represents the 50th percentile (median). The upper shadow line represents the 95th percentile. The lower shadow represents the 5th percentile. 49
50 Percentiles... Percentile displays either three or five custom percentiles for dataset metrics. Each percentile you enter must be separated by a comma and space. If you specify three data points, the line represents the range of percentile values. The middle tick mark represents the middle value. The upper shadow represents the top range for your selection. The lower shadow is the bottom range of your selection. Rate summary The Rate Summary displays the maximum, minimum, and average rates for the following 1-second network bytes and packets metrics: Network source > Network Bytes (total throughput) Network source > Network Packets (total packets) Device source > Network Bytes (combined inbound and outbound throughput by device) Device source > Network Bytes In (inbound throughput by device) Device source > Network Bytes Out (outbound throughput by device) Device source > Network Packets (combined inbound and outbound packets by device) Device source > Network Packets In (inbound packets by device) Device source > Network Packets Out (outbound packets by device) The upper and lower parts of the line represent the range from the maximum and minimum rates. A middle tick mark represents the average rate. Tip: Hover over a line to view the values of percentiles and count (total number of events that occurred) for a data point. Column chart The column chart displays metric data as vertical columns over a selected time interval. If your chart contains more than one metric, data for each metric is displayed as an individual column, or a series. Each series is stacked together to illustrate the cumulative value of the data. Select the column chart to compare how accumulation of multiple metric data points at a specific time point contribute to a total value. Tip: Click the legend to isolate individual series. Available metrics for this chart This chart is compatible with any metric type. The types of data calculations that you can display in this chart include rates, percentiles, and the mean. Heatmap chart The heatmap chart displays a distribution of metric data over time, where color represents a concentration of data. The heatmap legend displays the color gradient that corresponds to the data range in the chart. For example, the darker color on the heatmap indicates a higher concentration of data points. Select the heatmap when you want to identify patterns in the distribution of data. Note: The dashboard properties theme, such as Light, Dark, or Space, affects whether a darker or lighter color indicates a higher concentration of data points. The chart displays a default data range between the 5th and 95th percentiles, which filters outliers from the distribution. Outliers can skew the scale of data displayed in your chart, making it more difficult to spot trends and patterns for the majority of your data. However, you can choose to view the full range of data by changing the default filter in the Options tab. For more information, see the Filter outliers section. Available metrics for this chart This chart requires a dataset metric type only. The types of data calculations that you can display in this chart include include percentiles. 50
51 Note: This chart does not support baselines or threshold lines. Histogram chart The histogram chart displays a distribution of metric data as vertical bars, or bins. The default view displays a data range from the 5th to 95th percentile (5th-95th), which filters outliers from the distribution. The minimum to maximum (Min-Max) view displays the full data range. Click the magnifying glass in the upper right corner of the chart to toggle between the two views. Select the histogram chart to view the shape of how data is distributed. Note: Your toggle selection (between the 5th-95th and Min-Max views) will persist for your chart, but not for the users that you shared your dashboard and chart with. To set a persistent toggle selection before sharing a dashboard, see the Filter outliers section. Data is distributed into bins on a linear or log scale. First, the data range automatically determines whether the chart has a linear or log scale. Then, data is placed into bins. When the data range spans several orders of magnitude, data is placed into bins on a log scale, and Min-Max (log) appears in the upper right corner of the chart. Typically, the 5th to 95th percentile data range does not require a log scale. Click-and-drag to zoom in on multiple bins or a specific bin. Click the magnifying glass again in the upper right corner of the chart to zoom out to the original view (either 5th-95th or Min to Max). Note: Zooming in to view a custom time interval does not change the global or region time interval. Available metrics for this chart This chart requires a dataset metric type only. The types of data calculations that you can display in this chart include include percentiles. Note: This chart does not support baselines or threshold lines. Line chart The line chart type displays metric values as data points in a line over time. If your chart contains more than one metric, data for each metric is displayed as an individual line, or a series. Each series overlaps. Select the line chart to compare changes over time. Tip: Click the legend to isolate individual series. Available metrics for this chart This chart is compatible with any metric type. The types of data calculations that you can display in this chart include rates, percentiles, and the mean. Line & column chart The line & column chart type displays metric values as a line, which connects data points over time, with the option to display another metric as a column chart underneath the line chart. If your chart contains more than one metric (for example, HTTP Requests and HTTP Errors), you can select Display as Columns to display one of the metrics as a column chart underneath the line chart. Select the line & column chart to compare different metrics at different scales in one chart. For example, you can view error rates and the total number of HTTP responses in one chart. Note: Columns are displayed in the color red by default. To remove the red color, click Options and clear Display columns in red. Available metrics for this chart This chart is compatible with any metric type. 51
52 The types of data calculations that you can display in this chart include rates, percentiles, and the mean. List chart The list chart displays metric data as a list with optional sparklines that represent data changes over time. Select the list chart to view long lists of metric values, such as detail metrics. Available metrics for this chart This chart is compatible with any metric type. The types of data calculations that you can display in this chart include rates, percentiles, and the mean. Note: This chart does not support baselines or threshold lines. Pie chart The pie chart displays metric data as a portion or percentage of a whole. If your chart contains more than one metric, data for each metric will be represented as single slice, or series, in the pie chart. Select the pie chart to compare the metric values that are mutually exclusive, such as status code detail metrics for the top-level HTTP Response metric. You can configure your pie chart to display as a donut chart by selecting Show total value from the Option tab. To set a specific number of digits displayed in your chart, see the Change percentile precision section. Available metrics for this chart This chart is requires a count, maximum, snapshot metric type only. You can only view rates and count in this chart. Note: This chart does not support baselines or threshold lines. Status chart The status chart type displays metric values in a column chart and the status of an alert assigned to both the source and metric in the chart. The color of each column represents the most severe alert status of the configured alert for that time interval. Select the status chart to see how data and the alert status for your metric change over time. For more information about configuring alerts, see the Alert settings section. To view the status of all of the alerts associated with the selected metric category, click Show Related Alerts. A list of alerts will then be displayed underneath the column chart. Available metrics for this chart You can only select one source and metric to display in this chart. This chart is compatible with any metric type. The types of data calculations that you can display in this chart include rates, percentiles, and the mean. However, you cannot display a summary of percentiles (from the 5th to 95th percentiles). Note: This chart does not support baselines. Table chart The table chart displays metric values across rows and columns in a table. Add rows to the table by selecting more than one source. Add columns to the table by adding metrics. 52
53 Available metrics for this chart This chart is compatible with any metric type. You can only select one metric set to display in the table. A metric set contains one type of source, such as applications or devices, and metrics. The types of data calculations that you can display in this chart include rates, percentiles, and the mean. Note: This chart does not support baselines or threshold lines. Value chart The value chart type displays the total value for one or more metrics. If you select more than one metric, metric values are displayed side-by-side. You can also add optional sparklines that represent data changes over time. Select the value chart to see the total value of important metrics, such as the total number of HTTP errors occurring on your network. Available metrics for a chart This chart is compatible with any metric type. The types of data calculations that you can display in this chart include rates, percentiles, and the mean. Note: This chart does not support baselines or threshold lines. Alert history widget The alert history widget displays details about active alerts that are assigned to a metric source. You can configure the alert history widget with the Metric Explorer. Note: The alert history widget can only display up to 40 alerts. If you have more than 40 active alerts, click Show All Alerts in the bottom row of the table. Available metrics for this widget This widget requires metric sources only. You cannot add metrics to the alert history chart. Edit a text box widget The text box widget enables you to type and display custom text in a dashboard region. It is a helpful tool for adding notes about a chart or data in a dashboard. The text box widget supports the Markdown syntax, which enables you to format text and add metric variables that display updated metric data dynamically. Markdown is a simple formatting syntax that converts plain text into HTML with non-alphabetic characters, such as # or *. A new text box widget contains sample text that is already formatted in Markdown. Open the Metric Explorer window by doing one of the following steps: On the Dashboards page, click the command menu in the upper right corner of the page and select Edit Layout. Click anywhere within the text box widget. Click the title and then select Edit. In the Metric Explorer: Edit Text Widget window, type and edit text in the left Editor pane. The HTML output text dynamically displays in the right Preview pane. Click Save. Format text in Markdown syntax The following table shows common Markdown formats that are supported in the text box widget. 53
54 Note: Additional Markdown format examples are provided in the GitHub Guides: Mastering Markdown. However, not all Markdown syntax formatting options are supported in the text box widget. Format Description Example Headings Place a number sign (#) before your text to format headings. The level of heading is determined by the amount of number signs. ####Example H4 heading Unordered lists Place a single asterisk (*) before your text to format bulleted lists. * Example 1 * Example 2 Ordered lists Place a single number and period Example 1 Example 2 () before your text to format numbered lists. Bold Place double asterisks before and **bold text** after your text to format bold. Italics Place an underscore before and after your text to format italics. _italicized text_ Hyperlinks Place link text in brackets before the URL in parentheses. Or type your URL. [Visit our home page]( Note: Links to external websites open in a new browser tab. Links within the ExtraHop Web UI,such as dashboards or custom pages, open in the current browser tab. Blockquotes Place a right angle bracket and a On the ExtraHop website: space before your text to format a > Access the live demo and blockquote. review case studies. Monospace font Place a backtick (`) before and after your text to format in a monospace font. `example code block` Note: Adding emojis in Markdown syntax is unsupported. However, copying and pasting a Unicode block emoji is supported in the text box widget. For more information, see Unicode Emoji Chart website. Add images in Markdown syntax You can add images to the text box widget by linking to them. Make sure your image is hosted on a network that is accessible to the Discover appliance. Links to images must be specified in the following format: Where <alt_text> is the alternative text and <file_path> is the path of the image. For example: 54
55 Note: You also can add images by encoding them to Base6 For more information, see the following post on the ExtraHop customer forum, Putting Images in Text Boxes. Add metrics in Markdown You can add metric variables to a text box widget by writing metric queries in Markdown. The Markdown format for writing metric queries is: %%metric:<definition>%% Where <definition> is replaced with a JSON-defined structure that is based on the ExtraHop REST API query structure. Note: The following metric queries are unsupported in the text box widget: Time-series queries Mean calculations Multiple object_ids Multiple metric_spec Multiple percentiles A metric query must contain the following parameters: object_type object_ids metric_category metric_spec To retrieve the object_type, metric_spec, and metric_category values for a metric name: Click Settings Click Metric Catalog Type the metric name in the search field Select the metric, and look for the values in the REST API Parameters section. For more information, see the Metric Catalog section. You can retrieve object_ids from the URL that you are browsing. Object Type URL Parameter Application applicationoid= Network networkoid= Group devicegroupoid= Device deviceoid= Metric variable examples The following examples show you how to write top-level metric queries for application, device, and network objects, and detail metric queries. Application queries To specify the All Activity object, the object_ids is 0. 55
56 This example query shows how you can retrieve HTTP metrics from the All Activity object, and displays the following output: Getting [value] HTTP requests and [value] HTTP responses from All Activity. Getting %%metric:{ "object_type": "application", "object_ids": [0], "metric_category": "http", "metric_specs": [{"name":"req"}] }%%HTTP requests and %%metric:{ "object_type": "application", "object_ids": [0], "metric_category": "http", "metric_specs": [{"name":"rsp"}] }%% HTTP responses from All Activity. Device queries You must specify either a client ( _client ) or server ( _server ) in the metric_category. To retrieve metrics for a specific device, specify the device object ID number in object_ids. To retrieve the device object ID (deviceoid), search for the device object in the ExtraHop global search. Select the device from your search results. The deviceoid= value will be embedded in the URL query string. This example query shows how to retrieve metrics from a device client object, and displays the following output: Getting [value] CLIENT DNS response errors from a specific device. Getting %%metric:{"object_type": "device", "object_ids": [8], "metric_category": "dns_client", "metric_specs": [{"name":"rsp_error"}] }%% CLIENT DNS response errors from a specific device. This example query shows how to retrieve metrics from a device server object, and displays the following output: Getting [value] SERVER DNS response errors from a specific device. Getting %%metric:{ "object_type": "device", "object_ids": [156], "metric_category": "dns_server", "metric_specs": [{"name":"rsp_error"}] }%% SERVER DNS response errors from a specific device. Network queries To specify All Networks, the object_type is capture and the object_ids is 0. To specify a specific VLAN, the object_type is vlan and the object_ids is the VLAN number. This example query shows how to retrieve metrics for all networks, and displays the following output: Getting [value] broadcast packets from all networks. Getting %%metric:{ "object_type": "capture", 56
57 "object_ids": [0], "metric_category": "net","metric_specs": [{"name":"frame_cast_broadcast_pkts"}] }%% broadcast packets from all networks. This example query shows how to retrieve metrics for a specific VLAN and displays the following output: Getting [value] broadcast packets from VLAN Getting %%metric:{ "object_type": "vlan", "object_ids": [3], "metric_category": "net", "metric_specs": [{"name":"frame_cast_broadcast_pkts"}] }%% broadcast packets from VLAN Group queries To specify a group, the object_type is activity_group or device_group. You must specify either a client ( _client ) or server ( _server ) in the metric_category. The object_ids for the specific group must be retrieved from the REST API Explorer. This example query shows how to retrieve metrics for all networks, and displays the following output: Getting [value] HTTP responses from the HTTP Client Activity Group. Getting %%metric:{ "object_type": "activity_group", "object_ids": [17], "metric_category": "http_client", "metric_specs": [{"name":"req"}] }%% HTTP responses from the HTTP Client Activity Group. Detail metric queries If you want to retrieve detail metrics, your metric query should contain additional key parameters, such as key1 and key2: object_type object_ids metric_category metric_spec name key1 key2 Note: The key parameters act as a filter for displaying detail metric results. For built-in detail metrics, you can retrieve detail metric parameters from the Metric Catalog. For example, type HTTP Responses by URI, and then look at the parameter values in the REST API Parameters section. Note: You must supply the object_ids in your query. 57
58 This example shows how to retrieve HTTP requests by URI for the All Activity application (object_ids is 0 ): %%metric:{ "object_type": "application", "object_ids": [0], "metric_category": "http_uri_detail", "metric_specs": [{"name":"req"}] }%% This example query shows you how to retrieve HTTP requests by URIs that contain a key value for pagead2 for the All Activity application (object_ids is 0 ): %%metric:{ "metric_category": "http_uri_detail", "object_type": "application", "object_ids": [0], "metric_specs": [ { "name": "req", "key1": "/pagead2/" } ] }%% This example query shows how to retrieve count metrics for all networks and displays the following output: Getting [value] detail ICA metrics on all networks. Getting %%metric:{ "object_type": "capture", "object_ids": [0], "metric_category": "custom_detail", "metric_specs": [{ "name":"custom_count", "key1":"network-app-byte-detail-ica" }] }%% detail ICA metrics on all networks. This example query shows how to retrieve a custom dataset statistic with topn keys and percentiles, and displays the following output: The fifth percentile is: [value]. The fifth percentile is: %%metric:{ "object_type": "vlan", "object_ids": [1], "metric_category": "custom_detail", "metric_specs": [{ "name": "custom_dset", "key1": "mycustomdatasetdetail", "key2": "/ /", "calc_type": "percentiles", "percentiles": [5] }] }%%. Note: Sampleset metrics are unsupported in the text box widget. For example, adding the calc_type : mean parameter to your text box query is unsupported. 58
59 Edit a dashboard layout Add and arrange the placement of regions and widgets on your dashboards. Click the command menu in the upper right corner of the page and select Edit Layout. Click and drag dashboard components, such as a region or widgets, from the bottom of the page to add them to your custom dashboard. Note: For more information, see the Add a region, Delete a region, Add a widget, and Delete a widget sections. To arrange dashboard components, click and drag the edge of a region or widget to resize them. Click the header of a region or widget to drag them into a different location. Note: If dashboard components overlap, they will be outlined in red. You must click and drag the sides of the widgets and regions to make room. Click Remove Extra Space to remove the empty vertical white space around widgets. Note: Empty vertical white space will be removed from every region on the dashboard. 5. After making your changes, click Exit Layout Mode. Note: If an error message appears, another user might be making changes. It is best practice for each ExtraHop user to have an individual account. Add a region Click the command menu in the upper right corner of the page and select Edit Layout. From the bottom of the page, click and drag a region onto the dashboard. Click the Exit Layout Mode button in the upper right corner of the dashboard to return to the Dashboards page. You can now add widgets to your empty region and rename it. When you are finished modifying your region, click Exit Layout Mode in the upper right corner of the dashboard to return to the Dashboards page. Copy a region You can copy a region and paste it into another dashboard or new dashboard. All of the widgets in that region will be copied. Click the region title. Hover over Copy to to expand the menu and make one of the following selections: If you are copying the region to a new dashboard, select New Dashboard. In the Dashboard Properties window, in the Title section, type a name for the new dashboard. Tip: You can edit dashboard properties at any time. For more information, see the Change dashboard properties section. If you are copying the region to an existing dashboard, select the dashboard from the menu. The dashboard page opens and displays the location of the copied region. Drag and drop the region to a desired location and then click Exit Dashboard Layout. Note: If the copied region is placed on top of another region, it will appear red, indicating that regions are overlapping and will not display properly when you click Exit Layout Mode. Move the region to a new location until it is no longer red. Delete a region Click the command menu in the upper right corner of the page and select Edit Layout. 59
60 On the region you want to delete, click Delete. Click Exit Layout Mode in the upper right corner of the dashboard. Rename a region Do one of the following steps: Click the region title and select Rename. Click the command menu in the upper right corner of the page and select Edit Layout. In the region toolbar, click Rename. Type the new name for your region. Click Save. Modify sources You can change the sources for charts and widgets within a region without opening the Metric Explorer for each chart. This feature helps you to quickly update a copied dashboard. Complete one of the following steps: Click the region title and select Modify Sources Click the command menu in the upper right corner of the page and select Edit Layout. In the region toolbar, click Modify Sources. In the Modify Sources window, select the object that you want to change from the list on the right and choose a new metric source. Tip: You can also change the title of the region by clicking on the region name to the right. Click Save Dashboard. Add a widget You can add widgets, such as a chart or text box, to an empty space in a region on your dashboard. Click the command menu in the upper right corner of the page and select Edit Layout. Make sure you have space within the region for a new widget. Click and drag the corner of a region to make space or add a new region. Drag-and-drop one of the following widget types onto the region. Chart This widget is user-defined. Learn more in the Edit a chart widget section. Alert History This widget displays information about alerts that were detected about the objects in the list. Click Add metric source to customize the alert history. Activity Groups This widget displays a list of all activity during the specified time interval and cannot be modified. Text Box This widget provides a space for typing and displaying custom text in a dashboard region. You can format text with the Markdown syntax. Learn more in the Edit a text box widget section. Note: If you place a widget on top of another widget, overlapping widgets are outlined in red and will not display properly if you click Exit Layout Mode. To create more space in the region for the new widget, expand the region size and then move the widget to a new location. Click Exit Layout Mode in the upper right corner of the dashboard to return to Dashboards page. 60
61 Note: If an error message appears, another user might be making changes. It is best practice for each ExtraHop user to have an individual account. Copy a widget Click the widget title. Hover over Copy to to expand the menu and make one of the following selections: If you are copying the widget to a new dashboard, select New Dashboard. In the Dashboard Properties window, in the Title section, type a name for the new dashboard. Tip: You can edit dashboard properties at any time. For more information, see the Change dashboard properties section. If you are copying the widget to an existing dashboard, select the dashboard from the menu. The dashboard page opens and displays the location of the copied widget within a new region. Rename the region and then click Exit Dashboard Layout. Note: If the copied region is placed on top of another region, it will appear red, indicating that regions are overlapping and will not display properly when you click Exit Layout Mode. Move the region to a new location until it is no longer red. Delete a widget Click the command menu in the upper right corner of the page and select Edit Layout. Click the command menu in the upper right corner of the widget and select Delete. Click Delete Widget. Click Exit Layout Mode in the upper right corner of the dashboard to return to the Dashboards page. Print a widget Click the widget or chart title and then select Print. The print preview appears in a new window. Click Print Widget. Change dashboard properties After you created a dashboard, you can modify the metadata that is associated with that dashboard through the dashboard properties options. On the Dashboards page, click the command menu in the upper right corner of the page and select Dashboard Properties. In the Dashboard Properties window, you can modify the following fields: Title Change the dashboard name. Author Change the author name. Description Change the description of the dashboard. Permalink Change the URL for the dashboard. By default, the permalink, also known as a short code, is a five-character unique identifier that appears after /Dashboard in the URL. You can change the short code to a friendly name. 61
62 Note: The permalink can have up to 100 characters combining letters, numbers, and the following symbols: dot (.), underscore (_), dash (-), plus sign (+), parentheses ( ), and brackets ([ ]). The name cannot contain spaces. Sharing To share a dashboard with users who can view and edit, click the link. For more information, see the Share a dashboard section. Editors View the list of ExtraHop Web UI users with editing access to the dashboard. To change the users, click Sharing. Theme Select one of the following themes to change the colors and appearance of the dashboard: Light: White background with dark text. Dark: Black background with white text. Space: Dark background with a stylized background image and text. Click Save. Share a dashboard You can share custom dashboards with other ExtraHop users and groups and decide whether to give them view or edit access. User group information is imported from LDAP (such as OpenLDAP or Active Directory). Note: How a user interacts with a dashboard and the information they can view in the ExtraHop system is determined by user privileges, which are assigned by the ExtraHop administrator. For more information, see the User privileges section in the ExtraHop Admin UI Guide. Click Dashboards. In the left pane, under My Dashboards, click the name of a dashboard. Click the command menu in the upper right corner of the dashboard page and select Share. Grant viewing access to specific users or groups by completing one of the following steps: Click Only specified users or groups can view or edit. In the Specify users and groups field, type the name of a user or group, and select the name from the drop-down list. Select Can view and click Add User or Add User Group. Repeat this process for additional users and groups. Select All users and groups can view; only specified users and groups can edit. Grant editing access to specific users or groups by completing the following steps: a) In the Specify users and groups field, type the name of a user or group. b) Select a name from the drop-down list. c) Select Can edit. d) Click Add User or Add User Group. e) Repeat the process for additional users and groups. Click Save. Remove access to a dashboard You can modify the view and edit access privileges for dashboards that you granted to specific users and groups. Click Dashboards. In the left pane, under My Dashboards, click the name of a dashboard. Click the command menu in the upper right corner of the page and select Share. 62
63 Modify the access privileges by selecting from the following options: 5. Click the red delete (x) icon next to the user or group name to remove all access. Modify the access privileges by selecting either Can edit or Can view from the drop-down list next to the user or group name. Click Save. View a dashboard There are several ways to view information in a dashboard and present dashboard information to others. For example, you can opt to display hover-over descriptions of protocols and metrics in dashboards. You can also select between two presentation options to view dashboards: presentation mode or widget slideshow. Alert statuses can also be viewed in dashboards through widgets. Click Dashboards. To see definitions of the protocol and metrics displayed in charts, do the following steps: a) Click the chart title or legend label. b) Hover over Descriptions. The protocol and metric definition will be displayed. Note: You can also view descriptions in charts that display traffic from individual ports. Descriptions are provided for protocols that the Discover appliance parses. To present a full-screen display of your dashboard, do the following steps: a) Click the command menu in the upper right corner of the page. b) Select Presentation Mode. c) Click Exit Presentation Mode in the upper right corner to return to the previous display. Note: You can open a dashboard in presentation mode directly by appending / presentation to the URL. For example: extrahop/#/dashboard/437/presentation. 5. To view a dashboard as a widget slideshow, do the following steps: a) Click the command menu in the upper right corner of the page. b) Select Widget Slideshow. c) Select a time increment to view a slideshow of widgets within the current region. d) Click the x icon in the upper right corner of the screen to return to the previous display. To display alert statuses for metrics, you can configure the status chart or alert status display options in dashboard charts such as the list and value chart. For more information, see the Status chart and Display alert status in a chart sections. Organize dashboards To organize dashboards in the dashboard dock (left pane), you can create folders, copy dashboards, filter dashboards, and sort dashboards in ascending, descending, or custom order. The following fields and controls are available in the dashboard dock. Filter dashboards... field Enables you to limit the displayed list of items. Dashboard sort buttons Enables you to switch between ascending, descending, and custom sort views. For more information, see the Sort dashboards section. Dashboard Inbox Displays a list of dashboards that have been shared with you by other users. The Dashboard Inbox appears only if the inbox contains one or more dashboards. To share your dashboard with others, see the Share a dashboard section. 63
64 My Dashboards Displays a list of dashboards that you created. To organize your dashboards within custom folders, you can create a folder, add a dashboard to a folder, and arrange folders within the dashboard dock. You can keep these dashboards private or share them with other users. Editing access to your dashboard can be granted on a per-user or user group basis. For more information, see the Share a dashboard section. System Dashboards Displays the default built-in dashboards that provide you with a high-level overview of everything happening on your network in real-time. The two system dashboards, which are the Activity dashboard and the Network dashboard, cannot be deleted, modified, or shared. For more information, see the Types of dashboards section. New Dashboard Enables you to create a new dashboard. Create a folder for dashboards In the bottom corner of the dashboard dock, click the command menu. Click New Folder. Note: To add a new folder through a keyboard shortcut, type N then F. Type a name for the folder and click Save. Add a dashboard to a folder In the bottom corner of the dashboard dock, click the command menu. Click Edit Dock. Tip: To add a new folder through a keyboard shortcut, type O then D. Drag-and-drop dashboards that you created into a folder. Note: If dashboards are sorted in ascending or descending order, the drag-and-drop functionality is disabled. To enable this functionality again, click the sort icon in the upper right header of the dashboard dock until the custom sort icon displays. Click the Exit Edit Mode icon in the bottom corner of the dashboard dock to save your changes and exit edit mode. Note: You cannot click-and-drag system dashboards or shared dashboards to a new folder. Arrange dashboard folders To change the location of folders in the dashboard dock: Click the command menu in the bottom corner of the dashboard dock. Click Edit Dock. Click and drag the folders to change their location. Copy a dashboard Select a dashboard. Click the command menu in the upper right corner of the dashboard page. Click Copy and do one of the following steps: Click Keep Sources to maintain chart and widget configurations in the new dashboard. Click Modify Sources to update charts and widgets with new sources in the new dashboard. 64
65 In the Modify Sources window, click the source name. Search for a new source (either an application, device, or network) that you want to replace the original source with. Click Create Dashboard. Tip: You can also change the title of the dashboard by clicking on the pencil icon next to the dashboard name. To change the new dashboard title, select the dashboard and update its dashboard properties. For more information, see the Change dashboard properties topic. Note: You cannot drag a dashboard to a folder to copy it. Sort dashboards You can reorganize the order in which dashboards appear in the dashboards dock. In the top right corner of the dashboards dock, click the sort icon. The dashboard will be reorganized according to one of the following sorting modes: Ascending Lists dashboards in ascending alphabetical order. Descending Lists dashboards in descending alphabetical order. Custom Order Lists dashboards according to a customized order. To modify the order, in the bottom corner of the dashboard dock, click the command menu, and then click Edit Dock. Make sure that the sorting mode is set to Custom Order, and then click and drag to reorganize dashboards and folders. You can also move dashboards from one folder to another; however, you cannot move dashboards into or out of the System Dashboards folder. Filter dashboards You can filter the dashboards that are displayed in the dashboard dock to locate a specific dashboard. In the dashboard dock, in the Filter dashboards... field, type all or part of a dashboard name or folder. Only dashboards or folders that contain the specified string will appear in the dashboard dock. Export dashboard data You can export data from charts or tables to a CSV or Excel file. You cannot export content from a text box widget or a heatmap chart. Click the chart or table title that you want to export. Select Export to CSV or Export to Excel. The file will be downloaded to your local computer. Print a dashboard from a Discover appliance In the Discover appliance, you can print dashboards from your browser or from the command menu on the Dashboard page. Click the command menu in the upper right corner and then select Print. Tip: To print through a keyboard shortcut, type pp. 65
66 The print preview appears in a new window. Click Print Page. Print a dashboard to PDF from a Command appliance In the Command appliance, you can print dashboards from your browser. You can also export dashboards directly to a PDF file by performing the following steps. Click the command menu in the upper right corner of the page and select Export to PDF. Tip: To access the export to PDF option through a keyboard shortcut, type pp. Type a custom name for your PDF file or accept the default name. Depending on the arrangement of widgets and the width of your dashboard, choose one of the following page width options: Narrow 5. Displays large text in chart titles and labels, but provides less space for displaying chart data. Long chart titles and labels might be truncated. Medium (Recommended) Displays an optimized view of chart titles, legends, and data. Wide Displays small text in chart titles and labels, but provides more space for displaying chart data. Depending on the number of regions in your dashboard, choose one of the following pagination options: Single page Displays the entire dashboard on a single, continuous page. Page break per region Displays the dashboard by region, separated with a page break for each region. Click Export to PDF. Note: The process for generating a PDF might take several seconds. The PDF file will download to your local computer. Each PDF file includes the dashboard title and time interval. Click View report on ExtraHop to open the original dashboard set to the time interval specified in the PDF file. Delete a dashboard Click the command menu in the upper right corner of the page, and select Delete. Click Delete Dashboard in the Confirm delete dialog box. Drill down on metrics from a dashboard If you see interesting activity in a dashboard chart, you can drill down to investigate which factors are linked to that activity. Drilling down on a metric lets you investigate metric values broken down by key, such as client IP address, server IP address, methods, or resources. Click on the metric value or label in a chart, and then select a key. Click Dashboards. Click a dashboard name in the left pane (dashboard dock). 66
67 Click on a metric value or a metric label in the chart legend. Note: Drill down by chart legend is unavailable for the box plot, candlestick, heatmap, and histogram charts. In the Drill down by field, select a key. A drill-down metrics page with a topnset of metric values by key appears. You can view up to 1,000 key values in a topnset. Next steps Explore drill-down metrics by key Display detail metrics by key in a chart Display device group members in a chart 67
68 Metrics Metrics are measurements of network behavior. Metrics help you to gain visibility into what is happening in your network in real-time. In the ExtraHop system, metrics are calculated from wire data, and then associated with devices and protocols. The ExtraHop system provides a large number of metrics, which you can explore from protocol pages in the Metrics section of the ExtraHop Web UI. You can also search for metrics in the Metric Catalog, in the Metric Explorer, and by searching for metrics by source and then protocol. Get started with metrics The ExtraHop system provides you with 4,000 built-in metrics for over a dozen protocols. A metric is a measurement of observed network behavior. Because the ExtraHop system provides so many L2 through L7 protocol metrics to view, it can be challenging to know where to find the metrics that are most important to you. How do I navigate the ExtraHop Web UI to find metrics that are important to me? How are metrics about my network collected and processed? What types of metrics are available in the ExtraHop Web UI? Top-level metrics and detail metrics Top-level metrics and detail metrics provide different views about network activity. Top-level metrics provide you with a big-picture value to help identify what is happening on your network. You can then drill down on a top-level metric to view detail metrics. Detail metrics provide you with a value for a specific key (such as a client or server IP address), which gives you insight into how a specific device, method, or resource is affecting the network. On the Dashboard page, you can configure charts to display either top-level or detail metrics. On protocol pages, you can view top-level metrics and then drill down to view detail metrics. A top-level, or base, metric gives you a sum of data for a specified time period. The ExtraHop system provides you with real-time updates about top-level metrics. For example, you can view the total number of HTTP requests sent by a device for the last 30 minutes. In the following figure, a bar chart displays the top-level metric for the total number of HTTP requests that were sent to a web server during a specific time period. Detail metrics provide you with a metric value for a specific key, such as a client IP address, server IP address, URI, hostname, referrer, certificate, or method. For example, you can drill down on the total number of HTTP requests to break out the number of requests sent per client. When you drill down, the ExtraHop system provides you with a topnset of detail metrics. A topnset is the top 1,000 key-value pairs calculated for the time interval you specify in the Time Selector. A topnset is not a complete data 68
69 set because a topnset only represents the key-values that are recorded for a specific aggregation roll up (based on a specified time interval), and is limited to up to 1,000 keys per topnset. In the following figure, a Bar chart displays detail metric values by client (which is a key) after drilling down on the top-level metric for HTTP requests. Specifically, the chart displays eight clients that sent the most requests to the web server during a specific time period. You can configure charts to show you either a specific key or a specific number of keys from a topnset. Note: When drilling down to detail metrics from protocol pages, you might encounter a chart that includes more than 1,000 keys. Some charts in the ExtraHop system combine topnsets for multiple detail metrics into one table. You can then sort keys by detail metrics. For example, when you drill down on the responses metric by URI from the Metrics > Applications > All Activity > Web page, the chart displays both a topnset of URIs for HTTP Responses and a topnset of URIs for Server Processing Time. Types of top-level metrics Each top-level metric in the ExtraHop system is classified into a metric type. Understanding the distinctions between metric types can help you configure charts or write triggers to capture custom metrics. For example, a heatmap chart can only display dataset metrics. Count The number of events that occurred over a specific time period. You can view count metrics as a rate or a total count. For example, a byte is recorded as a count, and can either represent a throughput rate (as seen in a time series chart) or total traffic volume (as seen in a table). Rates are helpful for comparing counts over different time periods. A count metric can be calculated as a persecond average over time. When viewing high-precision, or 1-second, bytes and packet metrics, you can also view a maximum rate and minimum rate. Count metrics include errors, packets, and responses. Distinct count The number of unique events that occurred during a selected time interval. The distinct count metric provides an estimate of the number of unique items placed into a HyperLogLog set during the selected time interval. Dataset A distribution of data that can be calculated into percentiles values. Dataset metrics include processing time and round trip time. Maximum A single data point that represents the maximum value from a specified time period. 69
70 Sampleset A summary of data about a detail metric. Selecting a sampleset metric in a chart enables you to display a mean (average) and standard deviation over a specified time period. Snapshot A data point that represents a single point in time. Tip: Visit the Tip of the Week: Metric Types post on the ExtraHop community forum. Time interval and data roll up The time interval you specify in the Time Selector determines how metric data is aggregated, or rolled up into buckets. The aggregation roll up, also known as a metric cycle, provides information about the level of granularity for count metric data shown in time-series charts. Note: The aggregation roll up is not displayed in list and value charts. The following table provides information about how data will be rolled up for a specific time interval. Time Interval Aggregation Roll Up (if available) Notes Less than six minutes 1-second A 1-second roll up is only available for custom metrics and for the following built-in throughput and packet metrics: 120 minutes or less 30-second Network source > Network Bytes (total throughput) Network source > Network Packets (total packets) Device source > Network Bytes (combined inbound and outbound throughput by device) Device source > Network Bytes In (inbound throughput by device) Device source > Network Bytes Out (outbound throughput by device) Device source > Network Packets (combined inbound and outbound packets by device) Device source > Network Packets In (inbound packets by device) Device source > Network Packets Out (outbound packets by device) If a 30-second roll up is not available, a 5-minute or 60minute roll up will be displayed. 70
71 Time Interval Aggregation Roll Up (if available) Notes Between 121 minutes and 24 hours 5-minute If 5-minute roll up is not available, a 60-minute roll up will be displayed. Greater than 24 hours 60-minute Note: If you have an extended datastore that is configured for 24-hour metrics, a specified time interval of 30 days or longer will display a 24-hour aggregation roll up. Explore how metric data changes over different time intervals with the Time Selector. Drill-down functionality The ExtraHop system enables you to easily drill down from a top-level metric into specific details about the devices, methods, or resources associated with that metric. Drilling down helps you to investigate root causes of interesting network activity. Click on the metric value in a table or chart and then select the detail, such as IP address, method, error, resource, or status code, that you want to know more about. For example, if you see a large number of DNS request timeouts in a dashboard chart, you can drill down to see the top DNS servers in your environment that are associated with that metric, as well as the number of times each server did not respond to repeated DNS requests. Note: When you drill down on a top-level metric by a key (such as a client IP address or resource), the ExtraHop system calculates a topnset of up to 1,000 metric value-key pairs. These metric value-key pairs are known as detail metrics. Learn more in the Top-level metrics and detail metrics and Explore drill-down metrics by key sections. Note: If your Discover appliance is connected to an ExtraHop Explore appliance, you can drill down on a protocol or metric to view stored records. Learn more in the Records section. Drill down on metrics from a dashboard Drill down on metrics from device protocol pages Drill down on metrics from application protocol pages Drill down on flow network metrics Drill down on network capture and VLAN metrics Drill down from record query results Explore drill-down metrics by key Drilling down on a metric lets you explore metric values broken down by key, such as client IP address, server IP address, methods, or resources. On the drill-down metric page, there are several ways to explore detail metrics (which are metric value-key pairs), which help you to learn how a specific device, method, or resource is linked to network activity. 71


72 The following figure shows all the available options for exploring detail metrics: Filter results You can filter drill-down results in the following ways: Type in the filter field to dynamically filter results Click the Any Field drop-down list and make a selection Choose an operator to define parameters for your filter: Select = to perform an exact string match. Select # to perform an approximate string match. The # operator supports regular expression. 72
73 Note: To exclude a result, enter a regular expression. Learn more in the Regular expression filter examples section. Select > or # to perform a match for values greater than (or equal to) a specified value. Select < or # to perform a match for values less than (or equal to) a specified value. Click Add filter to save the filter settings. You can save multiple filters for one query. Saved filters are cleared if you select another key from the Details section in the left pane. Observe changes over time in the chart You can observe how a metric value changed over the selected time interval in the chart above the table. Select an individual row or multiple rows to change chart data. Hover over data points in the chart to view more information about each data point. Pivot to more data You can view metric values for different keys by clicking key names in the Details section in the left pane. If available, click a device name in the table to navigate to a Device page, which displays traffic and protocol activity associated with that device. Adjust time interval and compare data from two time intervals You can change the time interval in the Global Time Selector to view metric values from different time intervals. You can also perform a metric delta comparison from two different time intervals in the same table. Learn more in the Compare metric deltas section. Note: The global time interval in the upper left corner of the page includes a blue refresh icon and gray text that indicates when the drill-down metrics were last polled. To reload the metrics for the specified time interval, click the refresh icon in the Global Time Selector display. Learn more in the Time interval and data roll up section. Sort data in columns You can sort by metrics to learn which keys are associated with the largest or smallest metric values. For example, when you drill down on HTTP responses by client for an HTTP server, you can sort on processing time to see which clients experienced the longest website load times. You can then click the host name to navigate to the Device page to learn more about the client. Note: When you drill down on a response, request, or network byte metric, related metrics such as processing time are included in the table. For example, when you drill down on CIFS responses by files, related metrics such as goodput bytes and access time appear in the far right columns in the table. Change data calculation for metrics You can change the following calculations for metric values displayed in the table: If you have a count metric in the table, click Count in the Options section in the left pane and then select Average Rate. Learn more in the Display rates or counts in a chart section. If you have a dataset metric in the table, click Mean in the Options section in the left pane and then select Summary. When you select Summary, you can view the mean and the standard deviation. Export data You can download a PDF, CSV, or Excel file with all the drill-down results by right-clicking on the table. Navigate metrics In the Discover and Command appliances, you can search for metrics by source, such as an application, device, flow network, or a group of devices, and then by protocol. To view all the metrics collected by the ExtraHop system for a source, click Metrics from the top menu. The following fields and controls are available in the left pane: 73
74 Sources Enables you to view metrics for applications, devices, and networks. Groups Enables you to view metrics for groups of devices based on their activity. You can also create a custom device group and view metrics associated with those groups. You can also view trouble groups, which are automatically generated based on network traffic. Trouble groups represent a collection of devices that meet specific criteria indicating potential problems. Alerts Enables you to view the alert history for saved alerts. As you specify the sources or group of devices that you want to explore in the left pane, the center pane displays the available protocol pages associated with your selection. Select a protocol page to display all available metrics in tables, lists, and charts. Tip: When looking for metrics that are relevant to you, start with a device you are already familiar with. Search for a device in the global search field, and then click on the device name. On the device protocol page, you can pivot across protocols in the left pane and view top-level metrics and charts in the center pane to see all of the network activity associated with your device. Note: If there are no results for a metric, or if a protocol appears to be missing, the ExtraHop system did not detect any related activity or traffic for that source. To learn more about how the ExtraHop system collects metrics, see the Data sources in the ExtraHop system section. Dashboards are another way to explore the metrics that are most relevant to you. For example, you can plan and build a custom dashboard with charts that highlight your top devices and most critical network traffic. For more information, see the Get started with dashboards section. Metric Catalog The Metric Catalog enables you to view information about built-in and custom metrics in the ExtraHop system. This information can be useful for writing API queries and adding metric variables in a text box widget. You also can delete and edit custom metrics through the Metric Catalog. Note: For information on modifying custom metrics in the Metric Catalog, see the Custom metrics section. Search for metrics by typing a keyword or metric name into the filter field. Click the command menu next to the Type to filter... field for sorting options. When you select a metric from the search results, information about that metric displays in the right pane in the following sections. The Parameter section provides the following information about the selected metric: Source Specifies how the metric was created. If the source is builtin, the selected metric is one of 4,000 metrics already built into the ExtraHop system. If the source is trigger, the selected metric is a custom metric created by a user. Metric Specifies the API parameter name of the selected metric. Source Type Specifies the source type (application, device, or network) that is associated with the metric. Metric Type Specifies the type of base (top-level) metric (such as a count or dataset) that is associated with the selected metric. 74
75 Type Specifies whether the metric is a base (top-level) metric or a detail metric. The Display section provides information about how the selected metric will be displayed in the Web UI: Name Specifies the display name of the metric. Units Specifies the unit for the metric, if available. Description Specifies a description for the metric. The Detail Relationships section provides the name of the base (top-level) metric or detail metric that is related to the selected metric. The REST API Parameter section provides an example of a JSON query structure for the selected metric with API parameters. Metric Explorer The Metric Explorer is a tool for creating and editing dashboard charts. In the Metric Explorer, you can add metrics to a chart and immediately view how metric data will appear in a preview pane. The preview pane dynamically updates as you make metric and chart type selections, which enables you to explore and change how your data is visualized in a dashboard. The Metric Explorer provides the following components for configuring a chart. Metrics tab Add metric sets to your chart. A metric set consists of a single type of source and one or more metrics. Note: You can add multiple metric sets to display in a single chart. For example, one metric set can contain a mix of device sources (such as servers) and another metric set can contain application sources. Source In the Source section, add a metric source, such as an application, device, group, or network capture. Metric In the Metric section, search for and select compatible metrics for the source. Depending on the type of metric you select, data calculation options are listed underneath the metric name. For example, when you select whether you select a count metric type (such as HTTP Requests or Network Bytes), you can select to display a rate or count. When you select a dataset metric type (such as Server Processing Time), you can choose to display a summary of percentile values or a specific percentile value. Detail Optionally, in the Detail section, drill down to display detail metrics for the entire metric set in your chart. Time interval Specify a time interval to view presentation of network data in your chart. You can change the time interval, but your changes will not be saved with other chart configurations. You must change the time interval with the Time Selector in your dashboard. Analysis tab Add a static threshold line and a dynamic baseline to your chart. 75
76 Options tab Select configuration options, such as changing a chart title, units, and labels. Preview section Preview how metric data will display in your chart. The chart dynamically updates as you add and remove metrics from the Metrics tab. Chart section Select a chart type to display data. Toggle between different time-series and non time-series chart types to determine which chart is the best choice for visualizing the data you are interested in. Note: Some charts have specific metric requirements. The following figure displays a configured line chart. The chart is displaying data for one metric set, Application Metrics, the average rate data calculation for the HTTP Responses metric, and detail metric keys for client IP addresses. Sources and groups In the ExtraHop system, a metric is a measurement of observed network behavior. Metrics are generated from network traffic, and then each metric is associated with a source, such as an application, device, or network. When you select a source from the Metrics section of the Web UI, or in the Metric Explorer when building a chart, you can view metrics associated with that source. Each source provides access to a different collection of metrics. Select from the following sources and groups as you configure dashboard widgets or navigate across protocol pages. Applications Applications are user-defined containers for metrics that are associated with multiple devices and protocols. These containers can represent distributed applications on your network environment. In the ExtraHop system, applications are created through triggers, which are custom scripts. Triggers can collect metrics across multiple types of network traffic to capture information with cross-tier impact. For example, if you want a unified view of all the network traffic associated with a website from web transactions to DNS requests and responses to database transactions you can write a trigger to create a custom application that contains all of these related metrics. The Applications page displays the default All Activity application, 76
77 which contains metrics for every device on your network, and all custom applications created through triggers. Note: For information about creating applications with triggers, see the Triggers section. The table on the Applications page provides the following information: Name The name assigned to the application through the trigger. Click on an application name to navigate to the metric page associated with the application. Select the checkbox next to the application name to access the following configuration options: Create a chart in the Metric Explorer from application data Assign an alert to an application Assign a custom page to an application Assign a Flex Grid to an application Assign a geomap to the application Capture On a Discover appliance, this column identifies the wire data feed that is the source for the application. On a Command appliance, this column identifies the Discover appliance where the application was created. Description A user-defined description that is assigned to the application through a trigger. You can filter applications by application name, network capture, or application description. To adjust filter criteria, click Any Column or #. Note: By default, the search feature performs a substring search on the value entered in the filter text box. For example, if you submit the letter z for a name search, the search results return all devices with a letter z in the name, regardless of position. Note: Learn more by taking the Creating and Using App Containers training. Drill down on metrics from application protocol pages When you see an interesting high-level metric about protocol activity on an Application page, you can drill down to investigate which factors are linked to that activity. Drilling down on a metric lets you explore metric values broken down by key, such as client IP address, server IP address, methods, or resources. Note: You can drill down on metrics from Device, Device Group, and Flow Network protocol pages. Learn more in the Drill down on metrics from device protocol pages and Drill down on flow network metrics sections. Drill down from an application protocol page Click Metrics. Click Applications in the left pane. Click an application name. Click a protocol in the left pane. 77

78 5. If you find an interesting metric, click the metric value. A drill-down menu appears with keys. The diagram below shows a drill-down menu for HTTP status codes with the client IP address key. For an example of a drill-down workflow that explores DNS protocol data, see the Metrics walkthrough: finding DNS failures. Devices Devices are objects on your network with a MAC address and IP address that have been automatically discovered and classified by the ExtraHop system. Metrics are available for every discovered device on your network. An L2 device has a MAC address only; an L3 device has an IP address and MAC address. Note: For more information about how devices are automatically discovered and classified by the ExtraHop system, see the Device discovery section. You can filter devices on the Devices page by name, MAC address, VLAN, IP address, or node, and then click Search. To adjust filter criteria, click Any Column or Any Device. Note: By default, the search feature performs a substring search on the value entered in the filter text box. For example, if you submit the letter z for a name search, then the list of devices returned by the search includes all devices that have a letter z in the name, regardless of position. The table on the Devices page contains the following columns: Name The primary name for the device on the network. Click a device name to navigate to a metrics page where you can view protocol metrics. MAC Address The MAC address is a unique identifier for the device network interface. VLAN The virtual Local Area Network (VLAN) for the device. VLAN information is extracted from VLAN tags, if the traffic mirroring process preserves the tag on the mirror port. Note: By default, this column does not appear on Discover appliances and values are set to null on Command appliances. VLAN information is displayed for devices only if the devices_accross_vlans setting is set to true through the running configuration file. IP Address The last IP address the device communicated from on the network. Node (Command appliance only) The name of the Discover appliance associated with the device. Discovery Time The date and time when the device was first discovered. Description An optional, user-defined description. The counter at the bottom of the table identifies the number of devices currently displayed in the table. The table can display up to 1,000 devices per page. 78
79 Find a device You can search for a specific client, server, router, or other device in the ExtraHop system by any device attribute, such as IP address, hostname, or custom name. There are several ways to find a device: From global search, where you can search by any device attribute. From the device list page in the Metrics section of the Web UI, where you can filter search results. From an activity group page, where you can find a device based on the type of protocol activity. Learn more in the Find a device within an activity group section. This procedure shows you how to find a device from the device list page. You can search for a device by entering a value in the search field, or filter search results by device attribute. You can also sort on any column title. Log into the Web UI on the Discover appliance. Click Metrics and then click Devices in the left pane. Note: By default, the search feature performs a substring search typed into the search field. For example, if you submit the letter z for a name search, then the list of devices returned by the search includes all devices that have a letter z in the name, regardless of position. (Optional) Filter devices in the search results by device attributes. Click Any Column to select one of the following device attribute categories: Any Column Matches a substring in any device element. Name Matches a substring in the device name. Learn more about device names and how to change them. MAC address Matches a substring in the device MAC address. VLAN Matches a substring in the device Virtual Local Area Network (VLAN) tag. IP address Matches a substring in the device IP address. The IP address criteria can include CIDR notation in IP address or subnet prefix length format. For example, /16 for IPv4 networks or 2001:db8::/32 for IPv6 networks. Node (Command appliance only) Matches a substring in a connected Discover appliance name. Tag Matches a substring in the user-defined device tag. Type Matches a substring to a specified device attribute type that you select from the drop-down list. Select from the following options: Activity Specify active metrics. For example, selecting Activity: HTTP Server returns devices with HTTP server metrics, and any other device with the custom type set to HTTP server. Device Type Specify a device type, such as gateway, firewall, load balancer, file server, and custom device types. 79
80 Class Specify a device class, such as node, remote, and custom devices. Vendor Matches a substring in the device vendor name as determined by the Organizationally Unique Identifier (OUI) lookup. (Optional) Filter by L2 or L3 devices. Click All Devices and select one of the following categories: L2 device An L2 device in the ExtraHop system has a MAC address only. ExtraHop automatically creates a device based on a MAC address, and all activity is tracked against that device. L3 device An L3 device in the ExtraHop system has an observed IP address that comes from local traffic or from traffic coming from a router. Note: To learn more about these types of devices, see the Device discovery section. Find peer devices talking to a specific device From a device or device group protocol page, you can drill down by Peer IPs to find information about devices that are actively communicating with other devices or device groups. Find performance metrics for peer devices Log into the Web UI on the Discover appliance. Click Metrics and then select Device, Activity Group, or Device Group in the left pane. Click Overview or Network in the left pane. In the Details section near the upper right corner of the page, click Peer IPs. A list of peer devices appears, which are broken down by IP address, hostname (if available), the average number of bytes per second, and the average number of packets per second. The ExtraHop system determines hostname for peer devices by passively monitoring naming protocol activity, such as DNS, DHCP, or NetBIOS. In the Details section in the left pane, you can select different network protocols to view different performance metrics. Tip: You can convert the average rate of network byte and packet metrics to a total count for the selected time interval. In the Options section in the left pane, click Average Rate for an individual metric and then select Count. Find network latency metrics for peer devices Log into the Web UI on the Discover appliance. Click Metrics and then select Device, Activity Group, or Device Group in the left pane. Click TCP in the left pane. In the Details section near the upper right corner of the page, click Peer IPs. A list of peer devices appears, which is broken down by IP address, hostname (if available), round trip time, accepted connections, and initiated connections. Round trip time is a measurement of total network latency as data is transferred between devices. Accepted connections are the number of TCP connections sent by the peer device. Connected connections are the number of TCP connections initiated by the device with the peer device. Change the name of a device The ExtraHop system automatically names devices by passively monitoring naming protocol traffic (DNS, DHCP, NETBIOS, CDP). If naming protocol traffic is not observed for a device, the device name instead displays the IP address for L3 devices or the MAC address for L2 devices. In either condition, you can replace the automatic device name with a custom name. The custom name will appear throughout the ExtraHop system. 80
81 Note: The ExtraHop system does not perform DNS lookups for device names. The ExtraHop system derives the DNS name for a device by observing DNS traffic over wire data. Learn more in the Device discovery section Log into the Web UI on the Discover appliance. Click Metrics and select Device in the left pane. Find a device and click the device name. A Device page appears, which displays traffic and protocol metrics associated with the device. In the Overview section in the upper left corner, click Properties. Click Display custom name. Type a custom name in the field. Click Save. Change a device role The ExtraHop system monitors all of the protocol activity associated with a device from wire data. Based on certain types of traffic and protocol activity that was observed, the ExtraHop system then assigns a role to a device. You can replace the automatic or default device role with a manually assigned role. For example, the ExtraHop system assigns the WWW server role to devices associated with sending HTTP responses. The following device roles can be automatically assigned to a device: Gateway: Assigned to an L2 device when a large amount of unique IP addresses (past a certain threshold) are associated with the device. The device name will include the router name (for example, Cisco B1B500 ). Database (DB) server: Assigned to a device when there are database responses sent from this device. File server: Assigned to a device when there are NFS and CIFS responses sent from this device. WWW server: Assigned to a device when there are HTTP responses sent from this device. Auto: Assigned to a device by default. The following device roles can be manually assigned to a device: Load balancer: Assign to your device if you want to classify the device as a reverse proxy that helps distribute traffic across multiple servers. Firewall: Assign to your device if you want to classify the device as a network security device that monitors incoming and outgoing network and blocks traffic according to security rules. To change or manually assign a device role: 5. Log into the Web UI on the Discover appliance. Find a device either through global search or the Device page in the Metrics section of the Web UI. Click the device name. A Device page appears, which displays traffic and protocol activity for the selected device. In the upper right corner, click Properties. In the Device Role section, click the drop-down list and select a role. Click Save. Drill down on metrics from device protocol pages When you see an interesting top-level metric about protocol activity on a Device, a Device Group, or an Activity Group page, you can drill down to investigate which factors are linked to that activity. Drilling down on a metric lets you investigate metric values broken down by key, such as client IP address, server IP address, methods, or resources. Click Metrics and then click Device, Device Group, or Activity Group in the left pane. Click a device or group name. 81
82 Click on a metric value or a metric label in the chart legend. A menu appears. Note: You can also click a drill-down shortcut button in the Details section in the upper right corner of the page. In the Drill down by section, select a key. A drill-down metrics page with a topnset of metric values by key appears. You can view up to 1,000 key values in a topnset. Note: If a View More link appears at the bottom of a chart, click View More to drill down on the metric displayed in the chart. Next steps Explore drill-down metrics by key Networks The Networks page provides information about network capture and flow network sources discovered by the ExtraHop system. A network capture is the entry point into network devices and virtual LANs (VLANs) that are detected from wire data by the ExtraHop system. A flow network is a network device, such as a router or switch, that sends information about flows seen across the device. A flow network can have multiple interfaces. Click a network capture or flow interface to view protocol metrics about the data from those traffic sources. This section describes the source attributes available on the Networks page. Note: When starting from the Network page, keep in mind that information collected through network captures and flow networks are determined by port mirror configuration or flow configuration in the Admin UI. In addition, if your organization manages multiple capture points or remote flow networks through the Command appliance, the Networks page displays a table of all capture points and flow networks for your entire networking environment. The Network table provides the following information: Name The name of a network capture or flow interface. Click the drop-down icon next to a network capture or flow network to display VLANs or flow interfaces, respectively. Click a network capture or VLAN to navigate to a protocol page and view top-level and detail protocol metrics. Click a flow network or flow interface to navigate to a summary page and view top-level metrics. Select the checkbox next to a network capture or flow network to access the following configuration options: Devices The number of devices in the network capture. This attribute does not apply to flow networks. IP Address The IP address of the Discover appliance responsible for the network capture or flow network. Description An optional description of the network obtained from the network capture or VLAN protocol page. You can filter network captures and flow networks by name, devices, IP address, description, or application description. To adjust filter criteria, click Any Column or #. Note: By default, the search feature performs a substring search on the value entered in the filter text box. For example, if you submit the letter z for a name search, then the list of devices returned by the search includes all devices that have a letter z in the name, regardless of position. 82
83 View configured network captures View a list of configured network captures and their associated VLANs. To configure network capture settings, see the Capture section in the Admin UI Guide. Click Metrics and then click Networks. In the content pane, the table provides the following information about the capture: Name Displays the name of the capture. Type Displays the whether the network is a Wire Network or a Flow Network. Devices The number of devices in the network capture. IP Address Displays the IP address of the Discover appliance providing wire data for the capture. Description An optional detailed description of the network. Click on the capture name to open an overview page where you can modify this description. Interface Speed This field is not applicable to network captures. Note: On a Command appliance, the table displays the capture for each Discover appliance. Click the drop-down arrow next to the capture name to see a list of associated VLANs. Click the capture name or VLAN name to view more information and built-in charts. Change the name of a network capture or VLAN Click Metrics and then click Networks. In the content pane, select the checkbox for a single capture or VLAN. Click Rename in the upper right corner. Type a new name and then click OK. View configured flow networks View a list of configured flow networks and their attributes. To configure a flow network, see the Flow Networks section in the Admin UI Guide. Click Metrics and then click Networks. In the content pane, for each configured flow network, the table provides the following information: Name Displays the name of the flow network. Type Displays the whether the network is a Wire Network or a Flow Network. Devices This field is not applicable to flow networks. IP Address Displays the IP address of the flow network device. Description This field is not applicable to flow networks. 83
84 Interface Speed Displays the speed of the network interface on the remote device. This setting requires SNMP to be enabled through the Admin UI of the Discover appliance. Click the drop-down arrow next to the flow network name to see a list of flow interfaces and their attributes. Click the flow network name or flow interface name to view built-in charts on summary pages. Change the name of a flow network Click Metrics and then click Networks. In the content pane, select the checkbox for a single flow network or flow interface in the table. Click Rename. Type a new name and then click OK. Assign triggers to a flow network or flow interface Click Metrics and then click Networks. In the content pane, select the checkbox for a flow network or flow interface. Click Assign Trigger. Select the checkboxes for the triggers that you want to assign to the flow network, and then click Assign Triggers. Set a custom speed for a flow interface Bandwidth utilization metrics about flow interfaces are calculated through the interface speed. If you have configured SNMP for your flow network, by default, the interface speed is set through SNMP. However, you can also set a custom speed for your flow interfaces on the ExtraHop Discover appliance. For information on how to configure SNMP for your flow network, see the Flow networks ExtraHop Admin UI Guide section of the Click Metrics and then click Networks. In the content pane, click on a flow network to expand the list of available flow interfaces. Select the checkbox for the flow interface you want to customize. Click Automatically set interface speed through SNMP. Select Manually set interface speed. Type a custom speed for the interface, and then click Set Interface Speed. Flow network summary pages Summary pages provide built-in charts for the IP traffic that exits and enters through remote network devices, such as NetFlow traffic, for configured flow networks and flow interfaces. Summary pages contain three regions with charts for top-level, summary data: Overview View the total amount of network throughput (average bits per second) traveling in and out of either the flow network or flow interface. For flow interfaces only, you can also view the bandwidth utilization of throughput traveling in and out of the flow interface. Protocols IP flow packets are typically transferred across the flow network or flow interface by UDP and TCP ports. View the total amount of traffic for each protocol and port that is transferring data in the bar chart. In the line chart, compare protocol and port throughput changes over time. You can also hover over the protocol and port name in the legend of the line chart to isolate protocol data in the chart. 84
85 Endpoints View the amount data that devices (endpoints) are sending and receiving across the flow network or flow interface in the following ways. Top talker charts display individual devices with the highest volume of throughput. Top sender charts display the throughput for devices sending data. Top receiver charts display the throughput for devices receiving data. Conversation charts display the highest volume of throughput by flow between two devices (endpoints). Compare the top talkers, senders, and conversations in the bar chart. In the line chart, compare changes in throughput activity for individual devices over time. Hover over a device IP address in the line chart to isolate throughput data in the chart. To create your own dashboard charts from the summary page or preview data in different chart types, see the following sections: Modify flow network chart display Drill down on flow network metrics Create a chart from flow network data To configure the time interval for a specific region, see the Time Selector section. Modify flow network chart display Summary pages for flow networks and flow interfaces have built-in charts, and you can modify a limited set of options on the page to see how your data might display differently. If you like a different view, you can then create a custom dashboard chart with those settings. 5. Click Metrics, and then click Networks. Click on a flow network or flow interface. On the Summary page, click a chart title. Select from the chart type options at the bottom of the page or select from the available Metrics options in the left pane. Note: Not all chart types are compatible for all metrics options. Warning icons appear when the chart type is incompatible with the selected option. (Optional) If you want to save the modified chart to a new custom dashboard, click the command menu in the upper right corner of the chart, and select Create a chart from. a) Edit the chart as needed. b) When you finish configuring the chart, click Add to Dashboard. c) Either select New Dashboard to create a new dashboard with your chart, or select an existing dashboard name listed beneath New Dashboard. Create a chart from flow network data If you find interesting NetFlow traffic on your flow network or flow interface summary pages, you can modify the built-in charts and save the modified charts to an existing or new dashboard Click Metrics, and then click Networks. Click on a flow network or flow interface. On the Summary page, click the command menu in the upper right corner of a chart. Select Create a chart from. Edit the chart as needed. When you finish configuring the chart, click Add to Dashboard: Select New Dashboard to create a new dashboard. Select an existing dashboard name from the list below New Dashboard. 85
86 Drill down on flow network metrics When you see an interesting top-level metric about network activity on a Flow Network or Flow Interface page, you can drill down to investigate which factors are linked to the activity. Drilling down on a metric lets you explore metric values broken down by peer IP addresses, protocols and ports, conversations, and sender and receiver IP addresses. For example, on a Flow Network page in the Endpoints region, click the chart legend label to drill down by peer IP addresses. Click Metrics and then click Networks in the left pane. Click a flow network or flow interface name. Click a metric value or a metric label in the chart legend. A menu appears. In the Drill down by section, select a key. You will navigate to a page that contains a table of metric values by key from a topnset. Note: You can view up to 1,000 key values in a topnset. Note: For drill-down metric values, which are not polled automatically, you will see the snapshot of the global time interval, which includes a blue refresh icon and gray text that indicates when the metric or record query was last polled. To reload the metrics for the specified time interval, click the refresh icon in the Global Time Selector display. Next steps Explore drill-down metrics by key Drill down on network capture and VLAN metrics When you see an interesting top-level metric about network activity on a Network capture or VLAN page, you can identify which devices are linked to that activity. Note: For information about how to drill down on metrics from a flow network or flow network interface page, see the Drill down on flow network metrics section Click Metrics. Click Networks in the left pane. Click a network capture or VLAN interface name. Click a network layer in the left pane, such as L3 or L7 Protocols. Charts that display metric values for the selected time interval appear. For most protocols and metrics, a Device table also appears at the bottom of the page. Click the chart data, which updates the list to display only the devices that are associated with the data. Click a device name. A Device page appears, which displays traffic and protocol activity associated with the selected device. Next steps Drill down on metrics from device protocol pages Activity groups Activity groups contain devices that are automatically grouped together based on their network traffic. A device with multiple types of traffic might appear in more than one activity group. Activity groups make it easy to identify all the devices associated with a protocol, or determine which devices were associated with protocol activity during a specific time interval. You can filter activity groups by name or count. To adjust filter criteria, click Any Column or the includes (#) operator. Note: By default, the search feature performs a substring search on the value entered in the filter text box. For example, if you submit the letter z for a name search, then the list of devices 86
87 returned by the search includes all devices that have a letter z in the name, regardless of position. The table on the Activity group page provides the following information: Name Specifies the name of the activity group, which is based on the type of protocol activity of the devices in the group. The name also indicates whether the group contains client or server devices. Click on the name of an activity group to navigate to a page where you can view protocol metrics for that group. For example, click the TCP Devices activity group to see the L4 TCP protocol metrics page, which lists all of the devices with TCP traffic. Count Specifies the number of devices that belong to the activity group. Find a device within an activity group Activity groups contain devices that are automatically grouped together based on their protocol traffic. Activity groups can be a quick way to find a device associated with a protocol, or discover decommissioned devices that are still active. For example, you can look at the HTTP Servers activity group and locate all devices that have sent HTTP responses over the wire. Log into the Web UI on the Discover appliance. From the top menu, click Metrics and then select Activity Group in the left pane. Select an activity group, such as HTTP Servers. The Device Group page for the activity group appears. In the top right corner of the page, click Group Members. A table with all of the devices within the activity group appears. Click on a device name in the table. The Device page appears, which displays traffic and protocol metrics associated with the selected device. All protocol activity associated with the device is listed in the left pane. Click HTTP Server in the left pane to see the number of HTTP responses sent by this device Device groups Device groups help you track metrics across designated devices, typically grouped by their activity. Device groups can be static or dynamic. While you must manually add devices to a static device group, a dynamic device group automatically adds devices to the group that matches criteria that you define. The criteria can be a hostname, IP address, MAC address, or any of the filter criteria listed for the device on the Devices page. For example, you can create a dynamic group and then configure a rule to add all devices within a certain IP address range to that group automatically. From the Metrics section in the Web UI, the Device Groups table includes the following information about all the device groups created in the ExtraHop system: Name Displays the name of the device group. The icon next to the name indicates whether the device group is a static or dynamic group. Click on the name to view the Assignments page for the device group, which has criteria for the group among other settings. Count Displays the number of devices that belong to the device group. Description Displays an optional, user-defined description for the device group. Note: Learn more by taking the Working with Device Groups online training. Next steps 87
88 Create a dynamic device group Create a static device group Create a static device group Log into the Web UI on the Discover appliance. Click Metrics and then click Device Groups. Click Add. In the Name field, type a name for the new group. For the Group Type option, select Static (add and remove devices manually). In the Description field, add information about this device group. Click OK. Your device group is now created. Next, assign devices to your group. 8. Click Devices in the left pane. 9. Find a device and then select the checkbox next to the devices you want to add to your group. 10. At the top of the device table, hover over the icons and click the Add to Group icon. 1 Select your new device group from the Select a group... drop-down list. 1 Click Add to Group. Next steps Remove devices from a static device group Modify a device group name Add devices to a static device group After creating a static device group, you must manually add devices to the group. If you know which device or devices you want to add, you can quickly add them from a list. Or you can first view information about a specific device and then add that device to the group Add one or more devices from a list 5. Click Metrics and then click Devices in the left pane. Find a device and then select the checkbox next to the devices. At the top of the device table, hover over the icons and click the Add to Group icon. Select your device group from the Select a group... drop-down list. Click Add to Group. View device information and then add a device Click Metrics and select Device in the left pane. Find a device and then click on the device name. The traffic and protocol metrics associated with the device appear. Click Properties in the upper right corner of the page. Click the Group tab. In the Include in These Static Groups section, click the search field. A drop-down list of static device group appears. Type the name of the device group into the search field to filter results. Select the device group name. Note: You can also create a new static device group at this step. Type a name for the new static device group and press Enter. The device is automatically added to the new device group. Note: If the device also belongs to a dynamic device group, the device group name is displayed in the Included in Dynamic Groups section. For more information, see the Device groups section. Next steps 88
89 View device group metrics Remove devices from a static device group You can only remove devices from a static device group individually from the Device page Log into the Web UI on the Discover appliance. Click Metrics and then click Device Groups in the left pane. Click on the device group name. In the upper right corner, click Group Members. Click the device name that you want to remove. The Device page appears. In the upper right corner, click Properties. Click the Groups tab. Locate the device group name in the Include in these Static Groups section, and then click the red x icon. Create a dynamic device group Log into the Web UI on the Discover appliance. From the top menu, click Metrics and then click Device Groups in the left pane. Click Add In the Name field, type a name for the new group. In the Group Type field, select the option for Dynamic with criteria. Click the drop-down list and select from one of the following criteria: IP address Adds devices that match a substring in the device IP address in IPv4, IPv6, or CIDR block. Name Adds devices that match a substring in the device name. Node (Command appliance only) Matches a substring in the node name. MAC address Adds devices that match a substring in the device MAC address. Tag Adds devices that match a substring in the user-defined device tag. Type Select the following options from the drop-down lists: Activity Adds devices that are associated with active metrics. For example, selecting Activity: HTTP Server adds devices with HTTP server metrics, and any other device with the custom type set to HTTP Server. Device type Adds devices that are classified as a gateway, firewall, load balancer, file server, or custom device. Note: When the Include custom devices checkbox is selected, custom devices will be added to your group. Class Adds devices that are classified as node, remote, custom, or pseudo. Vendor Adds devices that match a substring in the device vendor name as determined by the Organizationally Unique Identifier (OUI) lookup. 89
90 7. 8. VLAN Adds devices that match a substring in the device VLAN tag. VLAN information is extracted from VLAN tags, if the traffic mirroring process preserves them on the mirror port. In the Description field, add a brief description for the new group. Click OK. Next steps Modify dynamic device group criteria Modify a device group name Modify dynamic device group criteria A dynamic device group automatically adds devices to the group that match criteria that you define. The criteria can be a hostname, IP address, MAC address, device tag, or any of the device attributes listed for the device on the Devices page. 5. Log into the Web UI on the Discover appliance. Click Metrics and then click Device Groups in the left pane. Click the device group name. In the upper right corner of the page, click Properties. In the Group Type section, complete one of the following steps: Click the top drop-down field and select one of the following device attributes: Name Adds devices that match a substring in the device name. MAC address Adds devices that match a substring in the device MAC address. VLAN Adds devices that match a substring in the device Virtual Local Area Network (VLAN) tag. VLAN information is extracted from VLAN tags, if the traffic mirroring process preserves them on the mirror port. IP address Adds devices that match a substring in the device IP address in IPv4, IPv6, or CIDR block. Node (Command appliance only) Matches a substring in a connected Discover appliance name. Tag Adds devices that match a substring in the user-defined device tag. Type Select from the following options: Activity Adds devices that are associated with activity groups. For example, selecting Activity: HTTP Server adds devices with HTTP server metrics, and any other device with the custom type set to HTTP server. Device Type Adds devices that are classified as a gateway, firewall, load balancer, file server, or custom device. Note: When the Include custom devices checkbox is selected, custom devices are added to your group. Class Adds devices that are classified as node, remote, custom, or pseudo. 90
91 6. Vendor Adds devices that match a substring in the device vendor name as determined by the Organizationally Unique Identifier (OUI) lookup. In the second drop-down field, type the text you want to match for the dynamic group. For example, if you selected IP address from the list, type the IP address that you want to set as a criteria for this group in the field. Click Save. Modify a device group name You can only modify a device group name from a Device Group protocol page Log into the Web UI on the Discover appliance. From the top menu, click Metrics and then click Device Groups in the left pane. Click the name of the device group you want to modify. A Device Group page appears. In the upper right corner, click Properties. In the Group Name field, type a new name for the device group. Click Save. Modify a device group description 5. Click Metrics and then click Device Groups. Click the name of the device group you want to modify. A Device Group page appears. In the upper right corner, click Properties. In the Group Description field, type a new description for the device group. Click Save. View device group metrics You can view all the protocol activity associated with a device group. You can also drill down by group member and navigate to a Device page to view metrics for an individual device. 5. Log into the Web UI on the Discover appliance. Click Metrics and then click Device Groups in the left pane. The Device Groups list page displays all device groups on the appliance. (Optional) To filter the contents of the table, select a field and an operator, and then enter a search term. Click the device group name. A Device Group page appears, which displays traffic and protocol metrics associated with the device group. Trouble groups The Discover appliance automatically generates trouble groups based on network traffic that meet specific criteria indicating potential problems. The Trouble Groups table has the following information: Name Specifies the name of the trouble group. Count Identifies the number of devices that belong to this group. Refer to the specific trouble group sections for the criteria that defines that group. 91
92 View trouble groups To view details about the devices in a trouble group: Click Metrics and then click Trouble Groups. Click the trouble group name to view the list of devices in the group. On the device list page, click the device name. When you click a device name from the device list page, you are redirected to the Devices page where device statics are displayed. Aborted HTTP/DB transactions Aborted HTTP/DB transactions indicate a high level of aborts during active HTTP or database transactions. Aborts are generally initiated by clients, so this might indicate that the server hangs on the response or does not complete the response in a timely manner. Criteria Check for high levels of Requests Aborted or Responses Aborted Devices Devices that show HTTP or DB server activity and are not gateways or load balancers Update Hourly Remedial Actions For HTTP transactions, check for URLs that take along time to process. For database transactions, check for long-running stored procedures ADC SNAT pool too small ADC SNAT pool too small indicates that a connection failed to initiate because the current device interpreted the SYN as belonging to a previous connection. Criteria Check for any PAWS-Dropped-SYNs (In) Devices Known ADCs only (based on MAC address OID lookup) Update Hourly Remedial Actions On the BIG-IP Application Delivery Controller (ADC), the SNAT pool size should be increased ADC TCP connection throttling ADC TCP connection throttling indicates that the connections are stalling in the Application Delivery Controller (ADC) and it is unable to keep up with the rate of data sent. Criteria Check for Zero Windows (Out) as a factor of the number of established connections Devices Known ADCs only (based on MAC address OID lookup) Update Hourly Remedial Actions On the BIG-IP Application Delivery Controller (ADC), the proxy_buffer_high setting in the TCP profile should be increased Database server backups Database server backups are caused by backups taking place over CIFS, NFS, or Veritas on active database servers. 92
93 Criteria Detect large amount of storage traffic exchanged from the server Devices Devices that show CIFS, NFS, or TCP port activity (Veritas) and are not gateways or load balancers Update Every 30 minutes Remedial Actions Throttle down backups and schedule them during times with lower traffic DNS missing entries DNS missing entries might indicate a service availability problem. Criteria Compare DNS NXDOMAINS responses with the total number of responses Devices Devices that show DNS server activity and are not gateways or load balancers Update Hourly Remedial Actions If these queries are intended, add an entry to DNS. If not, find the clients making erroneous DNS requests and configure them to stop making these requests Excessive CIFS metadata queries Excessive CIFS metadata queries indicate a high level of file metadata queries compared to read/write activity (or "goodput") on a CIFS server. Criteria Compare FSInfo to the number of Read and Write bytes Devices Devices that show CIFS server activity and are not gateways or load balancers Update Hourly Remedial Actions Check clients that generate large numbers of CIFS for configuration issues that would cause them to perform an overly high level of directory scans Excessive HTTP authorizations Excessive HTTP authorizations should be checked for large numbers of HTTP authorization errors, which might indicate break-in attempts. Criteria Check for 401 errors and compare them with the number of valid responses Devices Devices that show HTTP server activity and are not gateways or load balancers Update Hourly Remedial Actions Log these HTTP authorization errors, as these errors might indicate break-in attempts 93
94 HTTP broken links HTTP broken links indicate that a resource has been moved or deleted but the document might still points to the old location. Criteria Check for 404s and compare it with the number of valid responses Devices Devices that show HTTP server activity and are not gateways or load balancers Update Hourly Remedial Actions Track down the source of 404s Path MTU mismatch Path MTU mismatch displays the list of devices for which path MTU mismatch was detected. These devices are not respecting the Fragmentation Needed ICMP announcements. Criteria Check for ICMP type 3 code 4 Devices All devices Update Hourly Remedial Actions Check documentation for devices that are not respecting path MTU announcements for configuration options Problematic TCP offloading engine Problematic TCP offloading engine. Indicates that the current device is sending too much data resulting in network congestion and dropped packets. This behavior has been seen with a number of TCP offloading engines. Criteria Check for Bad Congestion Control (Out) Devices NICs known to have problems (based on MAC address OID lookup) Update Hourly Remedial Actions Turn off TCP offloading Server TCP connection throttling Server TCP connection throttling is caused by server running out of buffer or CPU resources and throttling network connections as a result. Criteria Check for the Zero Windows (Out) as a factor of the number of established connections Devices Devices that are servers and are not gateways or load balancers Update Every 30 minutes Remedial Actions Check buffer sizes and CPU, and increase those resources, if necessary SPAN oversubscription SPAN oversubscription indicates that data coming over the SPAN port is incomplete. This can happen to data being dropped at the SPAN port due to oversubscription or microbursts. 94
95 Criteria Compare the desyncs to the number established connections Devices All devices Update Daily Remedial Actions Filter down data coming over the SPAN port or use a larger capacity SPAN port SSL Key Size < 2048 SSL key size < 2048 indicates a 1024-bit SSL key. In 2010, 1024-bit public keys have been declared insecure by NIST. As a result, certificate authorities are moving to 2048-bit keys. Criteria Check for SSL public key size less than 2048 bits Devices Devices that show SSL server activity and are not gateways Update Hourly Remedial Actions Deploy 2048-bit keys in place of potentially insecure ones Virtual packet loss Virtual packet loss indicates that a virtual instance is overwhelmed and cannot send packets out in a timely fashion. TCP interprets delayed ACKs as packet loss and sends less data. Criteria Check for large numbers of RTOs coming from devices within virtualized environments Devices Virtualized devices (based on MAC address OID lookup) Update Hourly Remedial Actions Provide more hardware resources to stressed VMs Search metrics by protocol After selecting a source, such as an application, device, or group, or network object from the Metrics section, you can access several protocol metrics for your selected source. Click on a protocol in the left pane, such as AAA, CIFS, DNS, or Web (HTTP) to display metrics and built-in charts. Learn about the new 6.2 layout We updated the Device and Device Group protocol pages in the ExtraHop Web UI to improve how you navigate and explore key system metrics. The Network and Application protocol pages will be updated in a future release. Take a look at the sections below to see where your familiar icons are now located and to learn about changed and deprecated workflows. Overview and Network Pages Each device and device group has an Overview and Network page in the left pane. These pages now contain the following metrics and menu items that were previously available from the left pane. 95


96 Figure 1: New layout L2 metrics, such as Packets, Throughputs, and Frame Counts, are now on the Network page. L3 metrics, such as IP fragments, ICMP, and DSCP, are now on the Network page. Note that the Packet Count by Protocol chart is now the IP Protocols chart. Click Peer IPs from the upper right corner of the page to see the previous Peer Devices table. L7 metrics are now on the Overview page, broken out by traffic in and traffic out. Click Peer IPs from the upper right corner of the page to see the previous Peer Devices table. Alert History is now on the Overview page. Multicast metrics are now on the Network page under Packet Distribution and are called Packet Types. Properties and Assignments are now available from the upper right corner of the Overview page or through the command menu. Client and Server Metrics Instead of toggling between Client and Server in the Metric Type drop-down, you can now access client and server metrics pages from the left pane. Figure 2: Old layout 96

97 Figure 3: New layout Protocol Page Actions Most of the action icons that appeared on the top of each protocol page have moved to the command menu in the top right corner of the page. Important: You cannot add protocol pages to reports in the new layout. To add a protocol page to a report, click Switch to old layout in the lower left corner of the page and then add the page to your report through the previous workflow. Figure 4: Old layout 97
98 Figure 5: New layout Note: On the Command appliance, the menu option is Export to PDF. Members in a Device Group The list of members in a device group has moved from the bottom of the protocol pages to a DETAILS section on each protocol page. Click Group Members in the upper right corner of the page to display information about each member. Or, you can click on any metric and select Drill down by > Group Member. 98

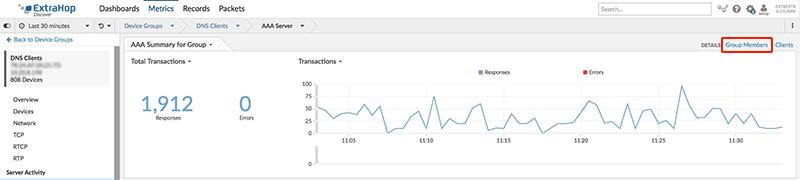
99 Figure 6: Old layout 99


100 Figure 7: New layout Drill Down Options The context-sensitive icons that appeared on the top of each protocol page have moved to the DETAILS section in the top right corner of the page. Note that Errors are now available in a value chart on the page and are no longer available through the link. Figure 8: Old layout Figure 9: New layout Instead of clicking a value to drill down on a metric, click the value to see a menu with drill down options. 100


101 Figure 10: Old layout Figure 11: New layout Search Records and Packets The Records and Packet search are still available from protocol pages, but are now in the top right corner of the page in the SEARCH section. These links only appear where records and packets are available. Records are available in the Network, Server Activity, and Client Activity pages; packets are only available in the Network page. Both records and packets are also available by clicking a metric and selecting from the menu. Figure 12: New layout 101

102 Changed and Deprecated Workflows Some workflows were deprecated and can only be accessed by switching to the old layout or through a new workflow. Device Names Device names were previously changed through the top-level page for the device. Instead, click on the Overview page, and then click Properties in the top right corner to change the name. Figure 13: New layout Geomaps You can no longer assign geomaps to a device and the geomaps assignments tab page was removed. Instead, click a count metric from a chart and then select an option from the menu for a drill down that is associated with an IP address (such as Server). A View on Map button is available below the chart and to the right. Figure 14: New layout Custom Pages You cannot view custom pages for devices or device groups from the new layout. Instead, click Switch to old layout in the lower left corner of the page, and then view custom pages through the previous workflow. Switch to old layout We updated the Device and Device Group protocol pages in the ExtraHop Web UI to improve how you navigate and explore key system metrics. However, you might still need to access the old layout for certain workflows. Revert to the old layout by completing the following steps. Click Metrics. Click Devices or Device Groups. Click the name of a device or device group from the list. In the lower left corner, click Switch to old layout. 102
103 Next steps Learn about the new 6.2 layout Manage protocol data If you discover interesting metric data from protocol pages, there are several ways to export and format data to share with others. For example, you can export data to an Excel or PDF file, add metrics to a dashboard, or generate activity maps and reports. Export data to CSV Navigate to a protocol page by clicking Metrics and then select a source, such as an application, device, network, activity group, or device group. Right-click any table, chart, or metric on the page and select Export to CSV. Export data to Excel Navigate to a protocol page by clicking Metrics and then select a source, such as an application, device, network, activity group, or device group. Right-click any table, chart, or metric on the page and select Export to Excel. Create a PDF of a protocol page In the Command appliance, you can export a PDF file directly from a protocol page. In the Discover appliance, you can print a PDF file of a protocol page from your browser. Navigate to a protocol page by clicking Metrics and then select a source, such as an application, device, network, activity group, or device group. In the Command appliance, click the command menu in the upper right corner and then select Export to PDF. In the Discover appliance, click the command menu in the upper right corner and then select Print. Tip: To print through a keyboard shortcut, type pp. The print preview appears in a new window. Click Print Page and select PDF as a print option from your browser. Next steps Export data to Excel Export data to CSV Create a chart from a protocol page Protocol pages contain a large amount of metrics and data. While you cannot modify the charts on protocol pages, you can create a copy of an interesting chart on a protocol page and then add the copied chart to a dashboard. Your dashboard can be then modified and shared with other team members. Click Metrics and then select a source in the left pane. Find the chart that you want to copy. Click the chart title and select Create Chart. The Metric Explorer opens with the source and metric selected. Note: If you find a chart on an Application or Network Capture page, click Create Chart in the upper right corner of the page. Edit the chart as needed. Click Add to Dashboard: Select New Dashboard to create a dashboard, and then click Create. 103
104 Select an existing dashboard from the list, and then click Close. Next steps Add another chart to a dashboard Change dashboard properties Share a dashboard Pin a protocol page to a dashboard Navigate to a protocol page by clicking Metrics and then select a source, such as an application, device, network, activity group, or device group. Click Pin to Dashboards. The confirmation dialog box displays the name of the dashboard that the page was added to. You can view the pinned protocol page in the My Dashboards folder in the left pane. Create an activity map An activity map is a directed graph that shows interconnections between objects on a network. On an activity map, devices labeled in red indicate user-selected devices. Devices labeled in black indicate devices that were not selected, but have connections to the selected devices. A darker colored line between devices represents a connection with a high volume of traffic. A lighter colored line represents a connection with a low volume of traffic. Well-connected devices appear slightly larger and more centrally on the map. Navigate to a protocol page by clicking Metrics and then select a device or device group. In the upper right corner, click the command menu and select Generate Activity Map. Complete the following steps: a) (Optional) Modify the default name of the activity map. b) Specify an output format, such as a PDF file. c) Select which activities to display. d) (Optional) Write a description about the activity map. Click OK. Sort metrics On an application protocol page, if a metrics section on a protocol page contains a gear icon in the upper right corner, the metrics in that section can be sorted by key or value. Navigate to a protocol page by clicking Metrics and then select an application. Click the gear icon. Select Sort by Key or Sort by Value. Detect anomalies with Addy ExtraHop Addy is a cloud-based service that applies machine learning techniques to automatically detect anomalies in your IT environment. When Addy is activated, you will see detected anomalies in the Discover appliance. Overall, Addy helps you in the following ways: Uncover potentially hidden issues Collect high-quality, actionable data to identify root causes of anomalies Discover previously unknown performance issues or infrastructure quirks Gain deeper insight into your network 104
105 Check out the following Help topics available in the ExtraHop Addy User Guide : Get started with Addy Setup Cloud Service Interpret and work with Addy anomalies Learn about Addy best practices Learn how anomaly detection works Look up what an anomaly means 105
106 Records Before you begin Before you get started with records, you must deploy an ExtraHop Explore appliance and connect it to your Discover appliance. If your ExtraHop Explore appliance is not connected to your Discover appliance, visit our Documentation website to find deployment guides that will help you get started. Records are structured information about transaction, message, and network flows that are generated and sent from a Discover appliance to an Explore appliance for storage and retrieval. After your records are stored, you can query for them from the Discover or Command appliances. With the Discover appliance, you start with a high-level view of your Discover appliance data, and then drill down to view your device data. With records stored on an Explore appliance, you can drill down to individual transactions from those devices, or you can query for outlying transactions, such as overly-long processing times or unusual response sizes. For example, if you had fifty HTTP 503 errors, you could view details about those errors by querying the records stored on the Explore appliance. The records would contain specific information about each individual HTTP transaction, which might reveal the underlying problem. There are two basic types of records: flow and L7. Flow records show network-layer communication between two devices over an (L3) IP protocol. L7 records show details from individual messages or transactions over L7 protocols. There are three types of supported L7 protocols: transactional (such as HTTP, CIFS, and NFS), message-based (such as ActiveMQ, DNS, and DHCP), and session-based (such as SSL and ICA). Important: Most users privileges let you query for records, but collecting and storing records requires full write privileges and familiarity with writing triggers. Here are a few definitions you should know about records in the ExtraHop Web UI: Records: An object that contains fields, where each field is a name and a value pair. The value can be a string, number, boolean, array, or nested object. Record types: An ID that determines what data is collected and stored on your Explore appliance. Because you must write a trigger to collect records, you need a way to identify the type of data you will collect. There are built-in record types, which collect all of the available known fields for a protocol. You can start with a built-in record type (such as HTTP) and write a trigger to collect only the fields for that protocol that matter to you (such as URI and status code). Or, advanced users can create a custom record type if they need to collect proprietary information that is not available through a built-in record type. Record formats: A schema that lets you display stored records in a formatted table (or table view) when you run a record query. The Discover appliance has record formats for each built-in record type. However, if you create a custom record type, but do not create a corresponding record format, you will only be able to view your fields in a text verbose view. Collecting and storing built-in records Any system protocol can be committed (collected and stored) as a record through a global trigger function. The basic trigger syntax is <protocol>.commitrecord(). HTTP.commitRecord() commits all detected HTTP traffic for the devices to which the trigger is assigned. The following figure shows the completed Trigger Configuration window. 106

107 For each built-in record type (such as HTTP), there is a corresponding built-in record format. Record formats control how records of a certain type are displayed in the ExtraHop Web UI, such as the display name of each field, the preferred order of fields, and which fields are visible by default. A record format is needed to show fields in the table view. Without a record format, all the fields in a record can still be viewed in verbose view, which displays all fields in plain text. (Modifying record formats for custom record types is an advanced feature.) The following figure shows record results for all HTTP transactions. Next steps Collect and store flow records on an Explore appliance Collect and store L7 records on an Explore appliance Query for stored records from a Discover or Command appliance Collect and store flow records on an Explore appliance You can automatically collect all flow records, which are network-layer communications between two devices over an IP protocol. If you enable this feature, but do not add any IP addresses or port ranges, all detected flow records are captured. Before you begin You must have full system privileges to configure automatic flow record collection. Configuring flow records for automatic collection is fairly straight-forward and can be a good way to test that your appliances are connected. Log into the Admin UI on your Discover appliance. In the ExtraHop Explore Settings section, click Automatic Flow Records. Select the Enabled checkbox. 107
108 In the Publish Interval field, type a number between 60 and This value determines how often records are sent to the Explore appliance for an active flow. The default value is 1800 seconds. In the IP Address field, type a single IP address or IP address range in IPv4, IPv6, or CIDR format. Then, click the green plus (+)_icon. (You can remove an entry by clicking the red delete (X) icon.) In the Port Ranges field, type a single port or port range. Then, click the green plus (+) icon. Click Save. Flow records that meet your criteria are now automatically sent to your connected Explore appliance. Wait a few minutes for records to be collected, and then verify that flow records are being collected. Click Records from the top navigation to launch a query. If you do not see any records, wait a few minutes and try again. If no records appear after five minutes, review your configuration or contact ExtraHop Support. Next steps Collect and store L7 records on an Explore appliance Query for stored records from a Discover or Command appliance Collect and store L7 records on an Explore appliance You can collect L7 records to store on your Explore appliance, which show details from individual messages or transactions over L7 protocols. These types of records require triggers. Before you begin These instructions assume some familiarity with ExtraHop Triggers. New users can learn about triggers in our Triggers Walkthrough. In the following example, you will learn how to collect records for any device that sends or receives an HTTP response. First, we will write a trigger to collect information from the built-in HTTP record type. Then, we will assign the trigger to a web server. Finally, we will verify that the records are being sent to the Explore appliance. Log into the Web UI on your Discover appliance. 5. Click the System Settings icon and then click Triggers. Click New to create a new trigger. In the Configuration tab, fill out the dialog box similar to the following example: a) Name: HTTP Responses. b) Author: ExtraHop c) Description: This trigger collects HTTP responses. d) Debugging: Select the checkbox to enable debugging. e) Events: HTTP_RESPONSE Click the Editor tab. 6. Type the following example code in the text box: HTTP.commitRecord() debug ( committing HTTP responses ) This code generates records for the HTTP record type when the HTTP_RESPONSE event occurs and corresponds to the built-in record format for HTTP. 7. Click Save and Close. Next, assign this trigger to a web server. 8. Click Metrics from the top menu and then click Devices in the left pane. 9. Search for an active web server that you want to collect records for. For this example, we will select a web server called web-sea-example. 10. Select the checkbox next to the web server (such as web-sea-example). 108
109 1 Click Assign Trigger from the menu above the table. 1 From the list, select the checkbox next to the trigger we previously created named HTTP Responses, and then click Assign Triggers. Records that meet your criteria are now sent to your connected Explore appliance. Wait a few minutes for records to be collected, and then verify that your records are being collected. 1 Click Records from the top menu to launch a query. If you do not see any HTTP records, wait a few minutes and try again. If no records appear after five minutes, review your configuration or contact ExtraHop Support. Next steps Collect and store custom records Query for stored records from a Discover or Command appliance Learn how to monitor activity on suspicious ports in our records walkthrough Collect and store custom records You can customize the type of record details you generate and store on your Explore appliance by writing a trigger that commits records to a custom record type. Optionally, create a record format to specify how these records are displayed in the ExtraHop Web UI. Before you begin These instructions assume some familiarity with ExtraHop Triggers. New users can learn about triggers in our Triggers Walkthrough. In the following example, you will learn how to store records for any HTTP transaction that results in a 404 status code. First, we will write a trigger to collect information from the built-in HTTP record type. Then, we will assign the trigger to a web server. Finally, we will create a record format to display selected record fields in the table view for our record query results. Write and assign a trigger 5. Log into the Web UI on the Discover appliance. Click the System Settings icon, and then click Triggers. Click New to create a new trigger. In the Configuration tab, fill out the dialog box similar to the following example: a) Name: HTTP 404 Errors. b) Author: ExtraHop c) Description: Track 404 errors on primary web server. d) Debugging: Select the checkbox to enable debugging. e) Events: HTTP_RESPONSE Click the Editor tab to write the trigger specifications. The following figure shows an example configuration that only collects records when a 404 status code is detected. We also set a name (web404) for these types of records to identify them in a record query and added identifying information for debugging. 109
110 In the next steps, assign the trigger to a device or device group for which you want to monitor 404 status codes. Click Metrics from the top menu. Click Devices. Select the checkbox for a device from the list. For our example, we will select a web server called web2-sea. Click the Assign Triggers icon, select the trigger you created in the previous steps, and then click Assign Triggers. In the following figure, we have selected our web server, web2-sea. 110

111 After assigning the trigger, return to the System Settings > Trigger page and select the trigger you created. Click the Runtime Log tab to see if the trigger is committing your records. Make sure your device has activity. For the following example, we intentionally typed unavailable web pages to generate 404 errors. Query for your custom record type Click Records from the top menu. 111

112 In the left pane, click the Record Type drop down. Your newly created record type should appear in italics at the top of the list. Select the record type and then click out of the menu. For our example, we will select web404, as displayed in the figure below. Click the Verbose View icon. Click Fields and then click Select All. All of the information collected from the trigger about these records is shown in the query results. Create a custom record format to display your record results in a table Record formats are optional, but offer a way to display your records with only the fields you want to see. The quickest way to create a custom record format is to copy and paste the schema on read from a built-in record format into a new record format Log into the ExtraHop Web UI on the Discover appliance. Click the System Settings icon and then click Record Formats. Click on the type of record you want to copy. For our example, we will copy the HTTP record format. Copy the contents in the text box below Schema on Read. Click New Record Format. Complete the following fields: a) Display Name: Type a unique name for your record format. b) Author: Identify the author for the record format. c) Record Type: Type the same record type ID you created in the trigger. In our example, this value is web40 d) Schema on Read: Paste the copied contents from step 4 into the text box. Edit the box to delete any unwanted fields. For our example in the figure below, we only kept the following fields: Client, Server, Method, Status Code, URI, and Processing Time. 112


113 Query for your custom record type in table view Click Records from the top level menu. In the left pane, click the Record Type drop down. Your newly created record format should appear in the list. Select the record type and then click out of the menu. For our example, we will select HTTP 404 from the Record Type drop down. Click the Table View icon. Click Fields and then click Select All. All of the fields in your record format are shown in the query results, as shown in our example figure below. Record format settings The Record Format Settings page displays a list of all built-in and custom record formats that are available on your local ExtraHop Discover or Command appliance. If you need to create a custom record format, we recommend that you begin by copy and paste the schema on read information from a built-in record format. Advanced users might want to create a custom record format with their own field-value pairs, and should apply the reference material provided in this section. 113
114 Record formats consist of the following settings: Display Name The name displayed for the record format in the Web UI. If there is no record format for the record, the record type is displayed. Author (Optional) The author of the record format. All built-in record formats display ExtraHop as the author. Record Type A unique alphanumeric name that identifies the type of information contained in the associated record format. The record type links the record format with the records that are sent to the Explore appliance. Built-in record formats have a record type that begins with a tilde (~). Custom record formats cannot have a record type that begins with a tilde (~). Schema on Read A JSON-formatted array with at least one object, which consists of a field name and value pair. Each object describes a field in the record and each object must have a unique combination of name and data type for that record format. You can create the following objects for a custom record format: name The name of the field. display_name The display name for the field. If the display_name field is empty, the name field is displayed. description (Optional) Descriptive information about the record format. This field is limited to the Record Format Settings page and is not displayed in any record query. default_visible (Optional) If set to true, this field displays in the Web UI as a column heading by default in table view. facet (Optional) If set to true, facets for this field display in the Web UI. Facets are a short list of the most common values for the field that can be clicked to add a filter. data_type The abbreviation that identifies the type of data stored in this field. The following data types are supported: Data Type Abbreviation Description application app ExtraHop application ID (string) boolean b Boolean value device dev ExtraHop device ID (string) IPv4 addr4 An IPv4 address in dottedquad format. Greater or less than filters are supported. IPv6 addr6 An IPv6 address. Only stringoriented filters are supported. number n Number (integer or floating point) 114

115 Data Type Abbreviation Description string s Generic string meta_type The sub-classification of the data type that further determines how the information is displayed in the Web UI. The following meta-types are supported for each of the associated data types: Data Type Meta Type String user Number bytes count expiration milliseconds packets timestamp Query for stored records from a Discover or Command appliance After records are sent to an Explore appliance, you can query for those stored records from either the Discover or Command appliance. In addition, you can save record queries to run at a later time. You can query records that are stored in the Explore appliance from multiple areas in the ExtraHop Web UI. The following figure shows the main Records page, that you can access by clicking Records from the top menu. Click Records from the top menu to start a new record query for all records stored on the Explore appliance. From the Records page, click Record Queries in the navigation bar or Saved Record Queries in the left pane to access any saved queries or start a new query. Type a search term in the global search field at the top of the screen and click Search Records to start a query across all stored records. Click the Records icon from the panel of Action icons on an application or device protocol page that has built-in record formats. This option queries for records that match the selected metric source and protocol. 115

116 Click the Records icon from a chart widget or from a metric drill-down page. No matter where you start your query from, you might have a large set of records results. You can narrow down your results by applying filters to find the specific record you need. Next steps Filter your records with a simple query Filter your records with an advanced query Learn how to query for missing web resources in our records walkthrough.. Filter your records with a simple query There are a number of ways you can filter your record query results to find the exact transaction you are looking for. The sections below describe each method and show examples you can start with to familiarize yourself. If you are trying to filter records by simple criteria (say, you want all HTTP transactions from a single server that generated 404s), you can create a simple query. For simple queries, start by clicking Records from the top menu to get to the main Records page, and then add a filter in one of the following ways: Add a filter or refine results from the left pane. Add a filter from the trifield. Add a filter directly from record results. Filter record results from the left pane When you click Records from the top menu, all of the available records for your selected time interval appear. You can then filter from the left pane to refine your results. The Record Type drop-down menu displays a list of all of the record types that your Discover or Command appliance is configured to collect and store. The Group By drop-down gives you a list of fields to further filter the record type by. The Refine Results section shows you a list of record types that are currently on the Explore appliance with the current number of records in parenthesis. 116
 is available below the chart.")

117 Filter record results through the trifield When you click Records from the top-level navigation, all of the available records for your selected time interval appear. A set of three filters (or the trifield) is available below the chart. Select a field from the Any Field drop-down (such as Server), select an operator (such as the equal sign (=)), and then type a hostname. Click Add filter, and the filter is added above the filter bar. Your results only show records that match the filter; in our example this means we only see results for transactions that are for the server named web2-nyc. Filter directly from record results You can select any field entry displayed in either table view or verbose view in your record results and then click the pop-up operator to add the filter. Filters are displayed below the chart summary (except for the record type field, which is changed in the left pane). 117

118 Next steps Filter your records with an advanced query Learn how to monitor activity on suspicious ports in our records walkthrough Filter your records with advanced query rules For advanced queries, you can create and modify complex filters by clicking the pencil icon filter that you have added. next to any 118
119 Here are some important things to know about advanced queries: You can specify multiple criteria with OR (Match Any), AND (Match All), and NONE operators. You can group filters and nest them to four levels within each group You can edit a filter group after you create it. You can create a descriptive name to identify the general purpose of the query. Create a complex filter with AND and OR operators The following example shows how you can create an advanced query to filter your records with complex criteria. We will create a filter to return results for all HTTP records that the include two URIs plus a status code greater than or equal to 400 or a processing time greater than 750 milliseconds. Important: To try this example on your own Discover appliance, you must have HTTP traffic on your network. 119


120 Click Records from the top menu. In the left pane, select HTTP from the Refine Results section. Only available records are displayed in the Refine Results section. This step ensures that you have available records for this query. Note: Record types do not appear as filters; they are displayed in the left pane. From within your record results, click an entry for a web server on your network in the URI column. Then, click the equal sign (=) to add the filter. We will select a URI called assets.example.com. The filter is now saved and appears beneath the chart. Click the pencil icon next to your saved filter to open the Advanced Filter editor. The Advanced Filter window opens with the Filter Definition already showing the URI you added. 5. Click Add Filter to add a second URI for another web server. Select URI, the equal sign (=), and then enter another URI. We will add media.example.com. 120
121 Under Filter Definition, change Match Any to Match All. Match Any is an AND operator and will let us search for criteria that matches both of these URIs. In the next steps, we will add a group of criteria that applies specifically to the URIs we added. Click Add Group. a) Click the Any Field drop-down and select Status Code. b) Select the greater than or equal to (#) symbol. c) Type 400 in the number field. Click Add Filter inside the white box to add another filter to the group. a) Click the Any Field drop-down and select Processing Time. b) Select the greater than (>) symbol. c) Type 750 in the number field. In the Custom Display Name field, type a descriptive name to make the filter easy to identify on the results page, otherwise the display name will show the first filter and the number of other applied rules: We will type Slow and Broken Web Assets in the field. 10. Click Save. After you click Save, the query automatically runs, and returns records that match either URI and that have either a status code equal to or greater than 400 or a processing time that is greater than 750 milliseconds. Next steps You can click Save Query as... from the top right of the page to save your criteria for another time. 121
122 Packets Packets are blocks of data that are transmitted across your network. The ExtraHop Discover appliance aggregates metrics about those transactions in 30 second rollups and then discards the packets. You can enable packet capture on a Discover appliance and write triggers to capture only targeted packets, or you can configure global packet capture to capture all packets. Packets are then sent to a disk drive for storage. For information about configuring packet capture without a Trace appliance, see the ExtraHop Admin UI Guide. With an ExtraHop Trace appliance connected to a Discover appliance, you can search for and download packets for selected transactions through the Packets feature in the ExtraHop Web UI. The downloaded packets can be analyzed through a third-party tool, such as Wireshark. If you have an ExtraHop Explore appliance, you can also store metadata about network transactions in a flow, which are called records. You can then query for records that correspond to the flow and drill down to view the full packets that are associated with those records. There might be only one record corresponding to a flow or many. Note: The Packets feature is not visible in the ExtraHop Web UI until after the Trace appliance connection is established. There are multiple locations in the ExtraHop Web UI from which you can initiate a packet query: Click Packets from the top menu. Type an IP address (IPv4 or IPv6) in the global search field and then click the Packets icon Click Packet Search from the upper right corner of a device page.. Click on the Packets icon next to any record on a record query results page in table view mode. (Only available with a connected Explore appliance and a connected Trace appliance.) Click on an IP address or hostname in any chart with metrics for network bytes or packets by IP address to see a context menu. Then, click on the Packets icon to query for the device and time interval. Creating a new packet query When you click on Packets from the top menu, the ExtraHop system queries packets for the selected time interval, such as the last 30 minutes and displays the Packet Query page. If you change the time interval, the query starts again. Important: Running too many simultaneous packet queries can deplete system resources. To delete in progress or completed packet queries, see the Packet Query Status page on the Trace appliance. For more information, see the ExtraHop Trace Appliance Admin UI Guide. Either end of the gray bar displays a timestamp, which is determined by the current time interval. The time on the right displays the starting point of the query and the time on the left displays the endpoint of the query. The blue bar indicates the time range during which the system found packets. You can drag to zoom on a period of time in the blue bar to run a query again for that selected time interval. You can stop a packet query at any time and download only the packets that have already been found, though it might take a few moments for the query to stop. For example, if you start a packet query for a time interval of 3 days, you can stop the query at any point, and download only the packets that were collected up to that point. The table below the query bar displays a set number of packets for preview. Click along the blue bar to preview different sections of the full query. By default, 20 packets are previewed at a time. You can modify this number in the box at the bottom left of the page. 122

123 In the left pane, the Refine Results section displays the top filterable values and their counts. Click on any value to filter your query results by IP address, protocol, port, and so on. Additionally, in the left pane on a Command appliance, when the Command appliance manages multiple Discover appliances, you can select one or more Discover appliances from the Source Node drop-down list to set the scope of the packet query results. Filtering criteria You can add or modify the following filters which match either endpoint of the flow, meaning the sender or receiver of the packet. EtherType (such as IPv4) IP Address IP Protocol (such as TCP or UDP) MAC Address Port VLAN ID Tip: When filtering by IP address, you can append a port number after a colon. For example, for IPv4 addresses, you can add a filter similar to :80 to filter port 80 traffic for that IP address. Add filters by typing your criteria into the fields on the query bar and then click Add Filter. Your selections appear above the input box. Remove filters by clicking the x next to the filter name. In addition, you can add filters from within the columns of the packet query results by clicking the value and then clicking on the equal sign button, as shown in the following figure: Drill down from a device page You can click on any device page and start a packet search from the L2, L3, L4, and L7 Protocol pages for that device. The packet query starts immediately and returns only packets that match the MAC address or IP address of the device on either endpoint. 123
124 Drill down from record query results You can start from any record query results page and click on the icon in the Packets column. The record query results must be in table view mode. When you click on the packet icon from a record query result, the search begins in the middle of the record and expands out on either side of the starting point. The packet query is filtered to the flow associated with the record, based on the IP addresses, ports, and IP protocol. This set of information is called the 5-tuple, and is available for most Explore appliance records. Note: Only records with associated packets display the Packet icon. Download a packet capture file After you have filtered and queried for the packets you want to collect, you can download the packets as a.pcap file for analysis in a third-party application, such as Wireshark. Note: The packets displayed in the table are only a preview of the full results. You can modify the number of packets displayed in the preview by changing the number in the packet preview field in the lower left corner of the content pane. Click on Packets from the top-level menu. Adjust the filtering criteria as needed and wait for the packet query to complete. Click Download PCAP in the upper right corner of the page. 124
125 Triggers Triggers are composed of user-defined code that automatically runs on system events through the ExtraHop Trigger API. By writing triggers, you can discover, collect, and store an extensive amount of custom data about the activities on your network. Some of the operations that you can perform through triggers include: Create an application container in which metrics are collected for specific devices. Application containers augment the device-based views that the ExtraHop system constructs by default. Create custom metrics and save them to the ExtraHop datastore. For example, the ExtraHop system does not collect information about which user agent generated an HTTP request, but you can generate and collect that level of detail through a trigger Generate records and write them to the ExtraHop Explore appliance for long-term storage and retrieval. Send data to syslog consumers, such as Splunk, or to third party databases, such as MongoDB or Kafka. Perform universal payload analysis (UPA) to access and parse TCP and UDP payloads from unsupported protocols. Initiate packet captures to record individual flows based on user-specified criteria. Your ExtraHop system must be licensed for packet capture to access this feature. To learn more about triggers and the API, see the following resources: ExtraHop Trigger API Reference Planning a Trigger training Creating a Simple Trigger training Creating and Using App Containers training Creating a Multi-Event Trigger training Trigger community forum Solution bundles gallery Get started with triggers Application Inspection Triggers provide programmable event processing at the application-protocol level. You can write a trigger, which is a block of JavaScript, through the trigger API to extract, store, and visualize custom wire data events and metrics that are specific to your business, infrastructure, network, clients, and applications. Triggers enable you to extract small or large amounts of data across multiple types of network traffic. In the ExtraHop system, an application is a container that collects metric data associated with specified devices and protocols. You can write a trigger that extracts metrics on specific events and devices that represent a cross-section of your network; the resulting application provides a unified view of the metrics. Additional trigger tasks include: Creating custom metrics and saving them to the ExtraHop Discover appliance datastore. Generating records and writing them to the ExtraHop Explore appliance for long-term storage and retrieval. Sending data to syslog consumers such as Splunk or to third party databases such as MongoDB or Kafka. Initiating packet captures to collect user-specified criteria from individual flows on your network. Parsing TCP and UDP payloads from unsupported protocols through universal payload analysis (UPA). 125
126 The information in the following sections will help you get started: Navigate triggers Plan a trigger Build a trigger To learn more about triggers, view the following online training modules: Planning a Trigger Creating a Simple Trigger Creating and Using App Containers Creating a Multi-Event Trigger Navigate triggers In the ExtraHop Web UI, the Triggers page lists information about available triggers and provides access to the Trigger Configuration window, where you can write or modify triggers. The Triggers page contains a list of current triggers with the following information: Name The user-defined name of the trigger. Author The name of the user that wrote the trigger. Default triggers display ExtraHop for this field. Events The system events that cause the trigger to run, such as HTTP_RESPONSE. Type The type of metric source for the trigger, such as a device or a network. Debug Mode Whether debugging is enabled. If debugging is enabled, output from debug statements in the trigger script are logged in the runtime log output. ECA The appliance where the trigger was written. If the trigger was created on an ExtraHop Command appliance, the Command appliance name is displayed. Otherwise, this field displays Local to indicate that the trigger was written on the local Discover appliance. This column is only available from a Discover appliance that is connected to a Command appliance. Description The user-defined description of the trigger. Status Whether the trigger is enabled. If the trigger is enabled, the number of device assignments also displays. 126

127 Plan a trigger Writing a trigger to collect custom metrics is a powerful way to monitor your application and network performance. However, triggers consume system resources and can affect system performance, and a poorly-written trigger can cause unnecessary system load. Before you write a trigger, evaluate what you want your trigger to accomplish, identify which events and devices are needed to extract the data you need, and determine whether a solution already exists Identify the specific information you need to collect. For example: When will my SSL certificates expire? Is my network getting connections on non-authorized ports? How many slow transactions is my network experiencing? What data do I want to send to Splunk through an Open Data Stream? Review the Metric Catalog to determine whether a built-in metric already exists that extracts the data you need. Built-in metrics do not create additional load on the system. Identify which system events produce the data that you want to collect. For example, a trigger that monitors cloud application activity in your environment might run on HTTP responses and on the open and close of SSL connections. For a complete list of system events, see the Classes and events section of the ExtraHop Trigger API Reference. Identify the devices or networks that you want to monitor and collect metrics from. A trigger consumes fewer system resource if you target specific devices instead of all devices of a particular type or group. For example, a trigger that looks for slow responses from your online catalog should be assigned only to HTTP servers that handle catalog transactions and not to all HTTP servers. Determine how you want to visualize or store data collected by the trigger. For example, you can view metrics on a dashboard or by protocol, you can send records to the ExtraHop Explore appliance, or you can send data to another third-party system, such as Splunk. Determine if a trigger already exists that meets your needs or might be easily modified; always start with a pre-existing trigger whenever possible. Search the following resources for an existing trigger: The Triggers page The ExtraHop Solution Bundles Gallery The ExtraHop Community Forums Build a trigger After you review the planning process, if you determine that you need to write a trigger, review the following steps for creating and configuring a trigger in the Web UI. 5. Configure the trigger. Write the trigger script. Assign the trigger to devices. View runtime log output. Monitor trigger performance. 127
128 Configure the trigger On the Triggers page, click New to open the Trigger Configuration window. The Configuration tab enables you to set or edit the following trigger attributes: Name A name for the trigger. Author The name of the user that wrote the trigger. Default triggers display ExtraHop. Description An optional description of the trigger. Status A checkbox that enables or disables the trigger. Debug A checkbox that enables or disables debugging. If you add debug statements to the trigger script, this option enables you to view the output in the runtime log output. Events The events on which the trigger runs. The trigger runs whenever one of the specified events occurs on an assigned device; therefore, you must assign at least one event to your trigger. You can click in the field or begin typing an event name to display a filtered list of available events. Select advanced options These options vary by the selected events. For example, if you select the HTTP_RESPONSE event, you can set the number of payload bytes to buffer on those events. The following figure shows an example of attributes set on the Configuration tab: Write the trigger script On the Triggers page, the Editor tab contains the editor in which you write the trigger script. 128

129 The editor provides an autocomplete feature that displays a list of properties and methods based on the selected class object. For example, you can press CTRL+Space in the editor to display a list of class objects, and after you select a class, you can type a dot (.) to display a list of available properties and methods as shown in the following figure: The editor also provides syntax validation of your script. When you save the trigger, the validator calls out any invalid actions, syntax errors, or deprecated elements in the script. If available, the validator displays replacements for deprecated elements. You cannot save the trigger until you fix your code or you disable syntax validation. To avoid poor trigger performance, incorrect results, or a trigger that does not function, we strongly recommended that you fix the code or replace the deprecated element rather than disabling validation. Disabling validation applies only to the trigger you are editing; there is no option to disable validation globally. The following figure shows a sample error message generated by the editor: 129

130 Assign the trigger to devices The Assignments tab displays the devices or networks that the trigger is assigned to. Warning: We do not recommend enabling the Assign to All option. Running triggers on unnecessary devices exhausts system resources. Minimize performance impact by assigning a trigger only to the specific devices that you need to collect data from. Although you create and edit triggers from the Triggers page, you assign triggers from the Metrics page. From the Metrics page, you can assign a trigger to one or more devices or to a device group. The UI navigation is slightly different for each metric source. View runtime log output The Runtime Log tab displays exceptions and output from debug statements in the trigger script. This tab only displays after the trigger is saved. Important: You must enable debugging from the Configuration tab to log debug statement output. For example, the following trigger monitors HTTP connections on selected devices and returns URIs that contain seattle. if (HTTP.uri.match("seattle")){ Application("Seattle App").commit(); debug(http.uri); } When a match occurs, the URI that contains the match is written to the runtime log as shown in the following figure: 130
131 In addition, the runtime log displays any trigger script exceptions whether or not debugging is enabled. You should fix exceptions when they occur to minimize the performance impact on your system. You can also monitor trigger exceptions from the System Health page through System Settings. Monitor trigger performance The Performance tab displays a graphical representation of the performance impact the trigger has on your environment. This tab only displays after the trigger is saved. Important: You must enable debugging from the Configuration tab to view trigger performance results. The performance graph both validates that your script is running and indicates the performance cost by tracking the number of cycles consumed by the trigger in a given time interval as shown in the figure below: 131

132 You can hover over data points on the graph to display details about trigger performance at a single point in time as shown in the following figure: If the trigger impact is high, re-evaluate the purpose of your trigger and consider the following options: Ensure the trigger performs only necessary tasks and runs only on required devices or networks. Check for exceptions in the runtime log and visit the System Health page from System Settings, which provides additional trigger performance metrics such as the number of running triggers, trigger load, and trigger exceptions. Assess the efficiency of the trigger script. For additional trigger optimization tips and tricks, see the ExtraHop Trigger API Reference, the Optimizing Triggers training module, and the following Trigger Optimization 101 blog posts in the ExtraHop Community Forums : Trigger Optimization 101: Accessing Metrics Trigger Optimization 101: Return Quickly Trigger Optimization 101: Exception Handling Trigger Optimization 101: Return or Exit()? If the trigger impact is acceptable, you can then expand the scope of the metrics you are collecting or expand the sources that the trigger is assigned to. However, after each incremental increase, re-evaluate your trigger to ensure that the cost to your system is not affecting your system performance. For an example on how to write and evaluate a trigger, see the Trigger Walkthrough. 132
133 Create a trigger You can create a trigger through the ExtraHop Web UI. Before you begin You must log in to a user account that has write permissions to create triggers. Initially, the Trigger Configuration window displays the Configuration, Editor, and Assignment tabs. After you save the trigger, the window displays the Runtime Log and Performance tabs. Click the System Settings icon and then click Triggers. Click New. Click the Configuration tab in the Trigger Configuration window and specify the following information: Option Description Name Type a unique name for the trigger. Author Type the name of the trigger author. Description Type a description for the trigger that summarizes what the trigger will do. Status Click the Disable Trigger checkbox to enable or disable the trigger from running on assigned events. Debugging Click the Enable Debugging checkbox to enable or disable debugging for your trigger. If you add debug statements to the trigger script, you can see the output in the Runtime Log if this option is enabled. Events Type one or more events. The trigger will run whenever the specified events occur. When you begin typing an event name, the selection list is automatically populated with available events. Show advanced options Set additional trigger options, if available. Advanced options are available for a limited set of events. See the Advanced trigger options section for more information. Click the Editor tab and type the trigger script. Tip: You write triggers in a JavaScript-like syntax. Click the API Reference link to open the ExtraHop Trigger API Reference in a new browser tab. 5. Click Save Changes. The trigger is saved and the Runtime Log and Performance tabs are displayed. Next steps Assign the trigger to one or more devices. See Assign a trigger for more information. Advanced trigger options You can configure advanced options for some events when you create a trigger. The following table describes available advanced options and applicable events. 133
134 Option Description Applicable events Bytes per packet to capture Specifies the number of bytes to capture per packet. The capture starts with the first byte in the packet. Specify this option only if the trigger script performs packet capture. All events except: A value of 0 specifies that the capture should collect all bytes in each packet. ALERT_RECORD_COMMIT METRIC_CYCLE_BEGIN METRIC_CYCLE_END FLOW_REPORT NEW_APPLICATION NEW_DEVICE SESSION_EXPIRE Bytes to Buffer Specifies the minimum number of payload bytes to buffer. CIFS_REQUEST CIFS_RESPONSE HTTP_REQUEST HTTP_RESPONSE ICA_TICK Clipboard Bytes to Buffer Specifies the number of bytes to buffer on a Citrix clipboard transfer. ICA_TICK Metric Cycle Specifies the length of the metric cycle, expressed in seconds. The following values are valid: METRIC_CYCLE_BEGIN METRIC_CYCLE_END METRIC_RECORD_COMMIT 30sec 5min 1hr 24hr Metric Types Specifies the metric type by the raw metric name, such as extrahop.device.http_server. Specify multiple metric types in a comma-delimited list. ALERT_RECORD_COMMIT METRIC_RECORD_COMMIT Per Turn Enables packet capture on each flow turn. SSL_PAYLOAD TCP_PAYLOAD SSL_PAYLOAD TCP_PAYLOAD UDP_PAYLOAD Per-turn analysis continuously analyzes communication between two endpoints to extract a single payload data point from the flow. If this option is enabled, any values specified for the Client matching string and Server matching string options are ignored. Client port min Specifies the minimum port number of the client port range. Valid values are 0 to A value of 0 specifies matching of any port. 134
135 Option Description Applicable events Client port max Specifies the maximum port number of the client port range. SSL_PAYLOAD TCP_PAYLOAD UDP_PAYLOAD SSL_PAYLOAD TCP_PAYLOAD SSL_PAYLOAD TCP_PAYLOAD UDP_PAYLOAD SSL_PAYLOAD TCP_PAYLOAD UDP_PAYLOAD SSL_PAYLOAD TCP_PAYLOAD UDP_PAYLOAD SSL_PAYLOAD TCP_PAYLOAD SSL_PAYLOAD TCP_PAYLOAD UDP_PAYLOAD Valid values are 0 to Any value specified for this option is ignored if the value of the Client port min option is 0. Client bytes to buffer Specifies the number of client bytes to buffer. The value of this option cannot be set to 0 if the value of the Server bytes to buffer option is also set to 0. Client matching string Specifies the format string that indicates when to begin buffering client data. Any value specified for this option is ignored if the Per Turn option is enabled. Server port min Specifies the minimum port number of the server port range. Valid values are 0 to A value of 0 specifies matching of any port. Server port max Specifies the maximum port number of the server port range. Valid values are 0 to Any value specified for this option is ignored if the value of the Server port min option is 0. Server bytes buffer Specifies the number of server bytes to buffer. The value of this option cannot be set to 0 if the value of the Client bytes to buffer option is also set to 0. Server matching string Specifies the format string that indicates when to begin buffering data. Returns the entire packet upon a string match. Any value specified for this option is ignored if the Per Turn option is enabled. 135
136 Option Description Applicable events All UDP Datagrams Enables capture of all UDP datagrams. UDP_PAYLOAD Run FLOW_CLASSIFY on expired flows Enables running the event upon expiration to accumulate metrics for flows that were not classified before expiring. FLOW_CLASSIFY Assign a trigger After you create a trigger, assign the trigger to one or more devices to begin gathering data. The trigger gathers data only from the devices to which it is assigned. Warning: Running triggers on unnecessary devices and networks exhausts system resources. Minimize performance impact by assigning a trigger only to the specific sources that you need to collect data from. Click Metrics. Click Devices or Device Groups in the left pane Select the checkbox for each device or device group you want to assign the trigger to. Click the Assign Trigger icon from the top of the page. Select the checkbox for each trigger you want to assign to the selected devices or device groups. Click Assign Triggers. The trigger runs on the selected devices whenever the trigger events occurs. Tip: You can manage trigger assignments for a device from the device's overview page. From the Manage Device section, click Assignments to add or remove trigger assignments from the device and to view which triggers are already assigned to the device. View triggers The Triggers page displays the complete list of available triggers on the ExtraHop Discover appliance. You can view and modify trigger properties, define new triggers, copy existing triggers, and delete triggers from the system. Click the System Settings icon, and then clicktriggers. (Optional) To search for a specific trigger in the table, type a search term in the Filter field, and then select additional search options from the Any Column and Contains drop-down lists. (Optional) To filter triggers based on the appliance on which they were created, select one of the following options from the Local Triggers drop-down list: Local Triggers Displays triggers that were created on the local ExtraHop Discover appliance. Command appliance Triggers Displays triggers that were created on the ExtraHop Command appliance associated with the local Discover appliance. Note: Triggers created on the Command appliance automatically sync with all associated Discover appliances; however, triggers created on individual Discover appliances do not sync with the associated Command appliance. 136
137 All Triggers Displays triggers that were created on both the local Discover appliance and the Command appliance. Note: The Local Triggers drop-down list is available only on Discover appliances. Trigger attributes The Triggers page displays the attributes configured for each trigger. Click the System Settings icon, and then click Triggers to view triggers. Name Specifies the name assigned to the trigger. Author Specifies the creator of the trigger. Default triggers display the author as "ExtraHop." Events Specifies the events on which the trigger runs. Type Specifies the source, such as a device, application, or network, monitored by the trigger. Debug Mode Specifies whether debugging is enabled. If debugging is enabled, debug information appears in the Runtime Log tab. ECA Specifies whether the trigger was created on an ExtraHop Command appliance or on the local ExtraHop Discover appliance. This column is displayed only on Discover appliances. Description Displays a user-defined description of the trigger. Status Displays whether the trigger is disabled. The trigger is enabled if the column displays the number of devices assigned to the trigger. Copy a trigger You can create a new trigger by copying an existing one. Click the System Settings icon and then click Triggers. From the table on the Triggers page, select the checkbox next to the trigger that you want to copy. Click Copy. The copied trigger is added to the table with "(copy)" appended to the trigger name. By default, the copied trigger is not assigned to any devices. Enable a trigger You must enable a trigger before the trigger will run on its assigned devices or networks. Click the System Settings icon and then click Triggers. From the table on the Triggers page, select the checkbox next to the trigger that you want to enable. Click Enable. 137
138 Disable a trigger You can disable a trigger to suspend it from running; trigger attributes and assignments are preserved. Click the System Settings icon and then click Triggers. From the table on the Triggers page, select the checkbox next to the trigger that you want to disable. Click Disable. Delete a trigger You can delete a trigger, but custom metrics and application containers remain in the system. Click the System Settings icon and then click Triggers. From the table on the Triggers page, select the checkbox next to the trigger that you want to delete. Click Delete. 138
139 Alerts An alert is a condition that establishes baseline values for specified metrics. If those values are exceeded, the system logs the event and sends notifications through configured channels (such as or SNMP). The Discover appliance includes built-in alerts, and you can also create custom alerts. This section contains procedures for creating, configuring, and managing alerts, as well as information about exclusion intervals and trouble groups. Note: To learn more about alerts, view the following training modules: Intro to Alerts Configure your first alert Detect anomalies with Addy ExtraHop Addy is a cloud-based service that applies machine learning techniques to automatically detect anomalies in your IT environment. When Addy is activated, you will see detected anomalies in the Discover appliance. Overall, Addy helps you in the following ways: Uncover potentially hidden issues Collect high-quality, actionable data to identify root causes of anomalies Discover previously unknown performance issues or infrastructure quirks Gain deeper insight into your network Check out the following Help topics available in the ExtraHop Addy User Guide : Get started with Addy Setup Cloud Service Interpret and work with Addy anomalies Learn about Addy best practices Learn how anomaly detection works Look up what an anomaly means Get started with alerts The ExtraHop Discover appliance associates a baseline value with every metric collected and enables users to set alerts for these metrics. Alerts makes it easy to inform your teams when there are network, device, or application anomalies or Software License Agreement (SLA) violations. When an alert is detected, you can configure the ExtraHop system to send an message or an SNMP trap to designated people in your organization. The Discover appliance has two different types of alerts: threshold and trend. Threshold alerts Threshold-based alerts are triggered when a monitored metric crosses a defined value in a time period. These types of alerts are useful for monitoring SLA-violations. Trend alerts Trend-based alerts are triggered when a monitored metric deviates from the normal trends observed by the system. These types of alerts are useful for metrics where thresholds are difficult to define. Appliances calculate trends by looking at historical data. Therefore, in most cases, trend alerts are active as soon as they are assigned. Even if you configure a trend alert to reference more historical 139
140 data than your appliance currently has, the appliance will still attempt to calculate the trend with whatever data is currently available. Navigate alerts To view system alerts information, click Metrics from the top-level menu. Alert options are listed in the left pane. The following fields and controls are available in the left pane. Trouble Groups Listed under the Groups section, trouble groups enable you to view built-in metrics groups that have been identified as having problems. Alert History Listed under the Alerts section, the alert history enables you to view detected system alerts. View alerts Click Metrics, and then click Alerts > Alert History. Click the Global Time Selector to specify a time interval to view all of the alerts detected in a defined period. Click the name of the alert you want to view. The Alert Details window appears. For threshold alerts, the Alert Details window displays the following information: Name The name of the alert. Expression The metric, time interval, operator, and sensitivity that were defined when the alert was created. Value The value of the metric at the time the alert fired. This value can be compared against the alert expression. Description The optional user-defined description of the alert. For trend alerts, the Trend Alert Details window displays the following information: Name The name of the alert. Alert Conditions The type of alert, time interval, operator, or percentage of the trend that were defined when the alert was created. View at Time of Alert Displays the alert graph from when the alert was fired. View Current State Displays the alert graph of the current trend state of the alert. Configuring alerts Discover appliances include built-in alerts that are available by default. However, you can also create custom alerts to inform you of when specific events occur on your network. 140
141 The Alerts page provides the following information about each alert: Name Specifies the name assigned to the alert. Click the alert name to modify an existing alert. Author Specifies the creator of the alert. Default system alerts have the author "ExtraHop." Metrics Shows a compact alert definition statement. Command appliance Specifies whether the alert was created on the Command appliance or locally on the node. Description Provides a space for an optional, user-defined description. Status Reflects whether the alert is assigned to any objects. Unassigned Alert is not assigned to any objects. Assigned Alert is assigned to some objects. Assigned to all Alert is assigned to all applicable objects. Create an alert Before creating an alert, determine the metric that you want to monitor, the alert threshold for that metric, and who should be notified if the alert passes the threshold. An alert is triggered only when a threshold is passed. For example, if a threshold is too low, only one alert is sent when the threshold is passed and no more alerts are sent even if the threshold continues to lower. Note: All external notification alerts are sent in UTC regardless of the time zone set in the Discover appliance. Click the System Settings icon in the top toolbar and click Alerts. On the Alerts page, click the New button. Enter the following information in the Alert Settings tab. Alert Settings Provides configuration settings to define the alert name and the alert expression. Trend Settings Provides configuration settings to select the time, lookback, and weight of trend-based alerts. Description Provides a space for an optional, user-defined description. Exclusion Intervals Displays the exclusion intervals assigned to this alert. Notifications Provides configuration settings to identify the groups that should be notified when this alert fires. Assignments Displays where in the system this alert has been manually assigned to a device or group. Click OK. 141
142 Copy an alert If you want to create a new alert that is similar to an existing alert, you can copy the alert and modify the settings as needed. Click the System Settings icon in the top toolbar and then click Alerts. In the Alerts table, select the checkbox next to the alert that you want to copy. Click the Copy button. The name of the copied alert is generated automatically by appending the word "(copy)" to the original name. Assign an alert Alerts can be assigned to applications, networks, devices, and groups. Assign an alert to an application or network Click on Metrics, and then click Applications or Network in the left pane. Select the checkboxes next to application or network names,, and then click the Alerts tab. You might need to click the top-level item in the left pane to view the Assignments page. Click the plus icon next to the Alerts heading. In the Assign Alerts dialog box, select the device alerts that you want to assign to the source or group item. In the Filter text box, provide an optional filter string to filter the list of alerts by name. Click OK. Assign an alert to a single device 5. Click on Metrics, and then click Device in the left pane. Click a device name. Click Assignments in the upper right corner. In the Assign Alerts to this Device section, click the search field. A drop-down list of alerts appears. Type the name of the alert into the search field to filter results. Select an alert. Enable an alert Click the System Settings icon in the top toolbar and then click Alerts. In the Alerts table, select the checkbox next to the alert that you want to enable. Click the Enable button. Disable an alert Click the System Settings icon in the top toolbar and then click Alerts. In the Alerts table, select the checkbox next to the alert that you want to disable. Click the Disable button. Delete an alert Click the System Settings icon in the top toolbar and then click Alerts. In the Alerts table, select the checkbox next to the alert that you want to delete. Click the Delete button. 142
143 View alert settings Note: Alerts created on the Command appliance automatically sync with all of the Discover appliances, but alerts created on individual appliances do not sync with the Command appliance. It is best practice to manage all alerts from the Command appliance rather than the Discover appliances. Click the System Settings icon in the top toolbar and then click Alerts. (Optional) Click the drop-down list and select one of the following options: All Alerts Displays alerts that were created on both the Command appliance and the Discover appliance. Command appliance Alerts Displays alerts that were created on the Command appliance. Local Alerts Displays alerts that were created on the Discover appliance. To view settings for an individual alert, click the name of the alert. Alert settings The Alert Settings tab contains the following fields. Name Specifies a name for the alert. Author Specifies the creator of the alert. The author is set by the Discover appliance based on the user name for manually created objects or the imported bundle, or set manually by the user. On bundle export, you can specify an author to override authors of any local objects included in the bundle. Alerts loaded by default have the author "ExtraHop." Disable Alert Specifies whether the alert is disabled. Alert Type Specifies the type of alert. Threshold Specifies the threshold value and the threshold time interval used in the alert expression. When a trend alert is configured, the value in the Threshold field operates as a logical AND so both the trend and the threshold must be met in order to for the alert to fire. Threshold values for most metrics are integers. For metrics that are collected by the Discover appliance as ratios, a decimal value can be specified in the Threshold field. The Interval drop-down list specifies the units for the threshold value. Per Second specifies that the alert is evaluated over the 30-second interval and then divided by 30 to obtain a per-second value, which is compared against the threshold. Metrics that are collected by the Discover appliance as measurements of time or as sizes do not use the time interval unit. Detail For threshold alerts, select the Top-level or Detail radio button. Top-level Specifies summary metrics for an object, such as a device, application, or capture. A threshold alert on a top-level metric identifies the total and compares it to the threshold. Examples of top-level metrics include HTTP Requests and HTTP Responses. Detail Specifies metrics for an object keyed by other criteria, such as an IP address. A threshold alert on a detailed metric identifies the count for each keyed item 143
144 and determines whether any of the counts are over the threshold. Threshold alerts for detailed metrics might fire multiple times if more than one is over the threshold. Alert settings allow alerting only on certain criteria. Other criteria might require you to first create a custom metric using the Metric Catalog. For example, to send alerts about metrics containing a specific URI, you can record a custom metric and then alert on the value of the custom metric. For more information, refer to Metric Catalog. Trend Trend-based alerts are triggered when a network statistic is outside of the normal trend learned by the system. Trend-based alerts are well suited for metrics such as errors where meaningful thresholds are difficult to define. Trend-based alerts need historical data to define a trend, so these alerts will fire once the Discover appliance has collected enough data to establish a baseline. Metric Specifies the metric that this alert is associated with. To select a metric, click the gear icon to the right of this field. The Select Metric dialog box appears. Expand the application, capture or device nodes to locate the metric that you want to use in the alert expression. In the Key pattern text box, specify additional information about the metric to refine your search. The input is interpreted as a regular expression and must use Perl-Compatible Regular Expression (PCRE) syntax. Refer to PCRE documentation for more information. Select the metric and click OK. Ratio Click the Ratio checkbox and select another metric using the gear icon. Dataset and Sampleset Settings The following settings are available only for trend alerts with dataset and sampleset metrics: Merge Merges all the datasets and applies the trending function to one big dataset. A 30-second aggregation roll up, or metric cycle, has a single dataset for each 30-second interval, so a 30-minute interval has 60 datasets. You can generate a trendline from these datasets in one of the following ways: Take the mean/median/nth percentile of each dataset, and perform a trend calculation on this value. For example, you might want to take the moving average (trend function) of the 95th percentile of processing time. Merge all of the datasets together into one large dataset, and perform a trend calculation on this value. For example, you might want to merge the datasets, then take the trimean (trend function) of the combined dataset. Mean Takes the mean of each dataset. Percentile Allows you to set a percentile value of datasets. Standard Deviation Calculates the normal deviation compared to the current trend alert using the same standard deviation parameters as the trend. These parameters can be absolute or relative, and population or sample. Normalization displays the standard deviation relative to mean. Click the Normalization drop-down list and select one of the following options. 144
145 Absolute Displays the standard deviation as a constant. Relative to Mean Displays the standard deviation relative to the mean. Note: If the trend alert is not a standard deviation, it is calculated as an absolute sample. Firing Mode Specifies the criteria under which the trigger is fired. This selection might affect the behavior of assigned geomaps. For more information, see the Geomaps section. Edge-Triggered Alerts set to edge-triggered are only generated when a specified threshold is crossed. The alert is generated again only when the metric goes below the threshold twice. For persistent problems (for example, the threshold is crossed continuously), a red dot appears on the geomap when the problem first occurs, but not continuously if the condition is only breached once. Level-Triggered Alerts set to level-trigged are generated continuously while the alert conditions are true. Alert When Specifies the criteria for sending the alert. For trend alerts, the following options are available in the first drop-down list: mean Specifies the mean value of the alert. median Specifies the median value of the alert. 25th percentile Specifies the 25th percentile value of the alert. 75th percentile Specifies the 75th percentile value of the alert. count (total) Specifies the count or total alerts as an absolute value. std. deviation Calculates the normal deviation compared to the current alert. ANY Fires the alert when any of the following conditions are present. ALL Fires the alert when all of the following conditions are present. NONE Fires the alert when none of the following conditions are present. The next drop-down menu specifies the time frame to collect the data. The next drop-down menu contains the following options: > Greater than < Less than 145
146 <= Less than or equal to >= Greater than or equal to == Equal to If applicable, specify a number to represent the percent of the trend, an absolute number, the number of trends per second, or the number of trends per minute, and select that choice from the final drop-down list. Selecting 100 percent of trend causes the value to overlap with the trend. If you want to alert on a condition 50 percent above the trend, then enter 150. If you want to alert on a condition 50 percent below the trend, then enter 50. The Trend Settings tab contains the following fields: Window Specifies the calculation window for the trend. Same Hour of Week Calculates the trend within a specified 1-hour window each week. Same Hour of Day Calculates the trend within a specified 1-hour window each day. Minute Rolling Average Calculates the trend based on the average of the data gathered each minute within a specified amount of time from the present time. Hour Rolling Average Calculates the trend based on the average of the data gathered each hour within a specified amount of time from the present time. Lookback Specifies the number of minutes of lookback. Weighting Model Specifies the weighting model. Mean Specifies the manner in which to calculate the average. Linear Average Calculates the average with all data points weighted equally. Single Exponential Calculates the average with the most recent data points weighted more heavily. Double Exponential Calculates the average with the most recent data points weighted the most heavily. For linear averages, the most recent value is weighted at 1 times the oldest value by default. For single and double exponential means, enter a number to weight the most recent value. Percentile Specifies the percentile value used as a basis for creating the trend. Percentile Records the trend using data points from a user-specified percentile. Min Value Records the lowest data point gathered during the time interval. 146
147 Max Value Records the highest data point gathered during the time interval. Regression Linear Calculates steadily increasing trends based on previous trends that are equally incremental. 2nd Degree Polynomial Calculates exponentially accelerating trends by projecting a curve using the equation y = ax2 + bx + c Standard Deviation Calculates the normal deviation compared to the current trend. Type Uses a sample-based or population-based standard deviation. Normalization Displays the standard deviation relative to mean. Note: If a trend is a standard deviation, its associated alerts use the same parameters as the trend. If the trend is not a standard deviation, then the alert is calculated as "sample" and "absolute". Static Value Calculates a static value based on the number you enter, and is useful to plot constant lines for SLAs. Time Delta Uses the oldest trend, resulting in a time delta option based on the lookback window. Trimean Calculates the weighted average of the 25th, 50th, and 75th percentile values. Winsorized Mean Replaces the most outlying values with the highest and lowest remaining values. Values above the 90th percentile become the same value as the 90th and values below the 10th percentile become the same value as 10th. The Exclusion Intervals tab displays all the defined exclusion intervals that can be applied to alerts. For more information, refer to the Exclusion intervals section. The Notifications tab contains the following fields: Severity Specifies the level of severity, represented by a color, required to send notifications. Note: The color for the severity level you select is reflected in geomaps, the alert history widget, the status chart, and other dashboard charts with the option to display alert status. Send SNMP Trap Specifies whether notifications are sent to an SNMP listener. Users with administration privileges can configure the SNMP listener in the Discover appliance Administration UI. notification groups A list of defined groups that can receive alert notifications. The Default group is checked by default. Users with administration privileges can configure additional groups in the Discover appliance Administration UI. 147
148 Additional addresses Specifies the addresses that should receive notification when this alert fires. Additional metrics in s (one per line) Specifies additional metrics to include in the notification . Paste the metric names into the window or click the Find metric... button to search for a metric. Find metric... Enables you to select a metric from a list of all possible metrics. The Description tab provides a space for an optional, user-defined description of the alert. The Assignments tab contains the following items: Note: Assigning trend alerts to more than 1000 devices might impact system performance Assign to All Specifies that the alert should be assigned to all devices, current as well as devices discovered in the future. Assignments Displays where in the system the alert has been manually assigned to a device or group. To manually disassociate the alert from a device or group, click the delete symbol next to the device or group name. (This field does not show when the alert was assigned by clicking the Assign To All checkbox.) Remove All Assignments Removes all manually-added devices and groups from the alert. Exclusion intervals Exclusion intervals define a time in which alerts are suppressed. For example, if you do not want to be notified about alerts after hours or on the weekends, an exclusion interval can suppress the alert during that time period. Create an exclusion interval Click the System Settings icon in the top toolbar and then click Alerts. On the Alerts page, click the Exclusion Intervals tab. On the toolbar, click New. The Exclusion Interval Configuration dialog box opens with the following tabs: Interval Settings Provides configuration settings to define the exclusion interval. History Contains a list of changes. Copy an exclusion interval If you want to create an exclusion interval that is similar to an existing one, you can copy the exclusion interval and modify the settings as needed. Click the System Settings icon in the top toolbar and then click Alerts. On the Alerts page, click the Exclusion Intervals tab. In the Exclusion Intervals table, click the checkbox next to the interval that you want to copy. Click the Copy button. 148
149 The name of the copied exclusion interval is generated automatically by appending the word "(copy)" to the original name. Assign an exclusion interval 5. Click the System Settings icon in the top toolbar and then click Alerts. On the Alerts page, click the alert for which you want to set an exclusion interval. The Alert Configuration window opens. Click the Exclusion Intervals tab. Click the checkbox next to the exclusion interval that you want to apply. Click OK. Delete an exclusion interval Click the System Settings icon in the top toolbar and then click Alerts. On the Alerts page, click the Exclusion Intervals tab. Click the checkbox next to the interval that you want to delete from the system. Click the Delete button. View exclusion intervals Exclusion intervals created on the Command appliance automatically sync with all of its Discover appliances, but exclusion intervals created on individual Discover appliances do not sync with the Command appliance. Click the System Settings icon in the top toolbar and then click Alerts. On the Alerts page, click the Exclusion Intervals tab. Click the drop-down list and select from one of the following options: All Intervals Displays exclusion intervals that were created on both the Command appliance and the Discover appliance. Command appliance Intervals Displays exclusion intervals that were created on the Command appliance. Local Intervals Displays exclusion intervals that were created on the Discover appliance. The Exclusion Intervals table contains the following information: Name Specifies the name of the exclusion interval. Description Provides an optional, user-defined description. Command appliance Specifies whether the exclusion interval was created on the Command appliance or locally on the Discover appliance. Type Specifies the type of exclusion interval from the following options: One-time Specifies an exclusion period that occurs only once from a designated start date and time to a designated end date and time. 149
150 Daily Specifies an exclusion period that occurs every day from a designated starting hour to a designated ending hour. Weekly Specifies an exclusion period that occurs every week from a designated start day and time to a designated end day and time. Note: Time intervals are excluded in one-hour blocks. Exclusion interval settings You can view the following exclusion interval settings: The Interval Settings tab contains the following fields: Name Provides a descriptive name for the new exclusion interval. Description Provides a space for an optional, user-defined description. Assign to All Click the Alerts checkbox, the Trends checkbox, or both to assign this exclusion interval to all alerts or trends in the Discover appliance. Exclude Specifies the time frame for the exclusion interval. From Sets a one-time exclusion interval. Every day Sets a daily exclusion interval. Every week from Sets a weekly exclusion interval. The History tab displays the following information. Change Displays the change that was made to the exclusion interval. Author Displays the author of the change. Timestamp Displays when the change was made. 150
151 Reports In the ExtraHop system, you can create a report of network activity to share with others. Reports enable you to highlight network activity for a specific time period, for a selected device, application or network, and enable you to compare changes in your network activity over a period of days, weeks, or months. Next steps Create a report Schedule a report (Command appliance only) Review frequently asked questions about reports Create a report In the Discover and Command appliance, you can create a PDF report file that displays metrics collected during a selected time period Log into the Web UI on the Discover or Command appliance. Click the Systems Settings icon and select Reports. On the Reports page, click New. In the Report name field, type a name. In the Description field, type information that you would like to display at the top of your report. a) Select Include description in report to make sure your description is included in the PDF file. Skip the Report items field for now. You will select metrics in step 8 that will automatically populate this field. Click OK. Your new report will now appear on the Reports page in System Settings. Close the System Settings window and click Metrics to select data for your report. For example, to add TCP metrics from the All Activity application to your report, complete the following steps: a) Click Metrics and then click Application. Select All Activity. b) Select L4 in the left pane. c) Near the top right corner of the page, click Add to Report. From the drop-down list, select your report name. All the TCP metrics displayed on this page will be added to your report. Note: A report can have data from multiple sources and protocols. Repeat step 8 to add more data sources to your report. Next, go back to the Reports page and select your report. You will see metrics listed in the Report items field. 10. In the View for field, select a time period from the drop-down list. 1 Click Generate to download the PDF report file to your desktop. You can now share the PDF file with stakeholders. In the Command appliance, you can schedule when your PDF file will be delivered by to stakeholders. Next steps Schedule a report (Command appliance only) 151
152 Download a PDF report file After creating a report, you can manually download a PDF file to highlight network activity for a specific period of time. While you can schedule the delivery of the report as a PDF file by in the Command appliance, the only way to create a report for a specific time period is to manually download a single report Log into the Web UI on the Discover appliance. Click the System Settings icon and then click Reports. Click the name of the report you want to download. From the View report for drop-down menu, select a time period. The report will show data collected by the ExtraHop system during this time period. (Optional) Change the name, description, or remove report items before you generate the report. Click Generate. Schedule a report (Command appliance only) In the Command appliance, you can schedule a report to be delivered by to stakeholders on a regular basis. After creating a report, you can specify how often the PDF file is delivered by and who receives the . Important: When you schedule a report, the report contains data collected only for the delivery time frame. For example, if you schedule a daily report, the PDF file will only include metric data from the last 24 hours. To create a PDF file with a time period different from the delivery time frame, you must download a single report. Click the Systems Settings icon and select Reports. Click the report name that you want to schedule for delivery. Click the Schedule tab and configure the following options for setting a delivery schedule: a) In the Schedule section, make a selection. Select No schedule to prevent the PDF file from being sent by . Select Every day to schedule a daily report, and set the time of day that you want the PDF file delivered. Select Every [day of week] to schedule a weekly report, and set the time of day you want the PDF file delivered. b) In the groups section, select a group of recipients that you want to send the PDF file to. If you do not see the group you are looking for, you can configure groups in the ExtraHop Admin UI or through the REST API. Contact your ExtraHop administrator to add an group. c) In the Additional s section, specify the individual addresses to send the PDF file to. Separate multiple addresses with line breaks. Click the Footers tab and select one of the following options to specify the content of the Select these None or Default to only include the following default content in your The scheduled report named [report name] for the time range [date and time] is attached. This report is scheduled to run every [day or week]. Schedule settings can be modified from the ExtraHop GUI. Recipient groups can also be modified from the ExtraHop GUI, and group membership can be modified from the ExtraHop admin interface. Note: The ExtraHop GUI link launches the Web UI for the Command appliance. Select Custom to include a message that appears below the default content. You can format your message in HTML markup. 152
153 5. 6. (Optional) If you would like your report to display a different time period than the schedule time range, you must manually download the report. Click OK to save changes. Check your inbox for messages from your ExtraHop Command appliance with the PDF file attached. Next steps Download a PDF report file Reports FAQ Here are some answers to frequently asked questions about reports. I just created a report. Why can't I click or select anything? My scheduled report does not include the time period I was expecting. How do I specify a different time period in my scheduled report? Can I export my report as a CSV or Excel file instead of a PDF file? How do I change the default text in my report s? I just created a report. Why can't I click or select anything? After creating a report from the Reports page, you must find and add metrics to your report from the Metrics section of the ExtraHop Web UI. Or, you can search for a device and then add that device or metric to your report. When you find the metrics that you want to report on, click the Add to Reports icon near the top of the page and select a report name from the drop-down menu. The next time you open that report from the Reports page, you will see your metrics in the Report items field, and you can click Generate. Continue adding metrics to your report as needed. My scheduled report does not include the time period I was expecting. How do I specify a different time period in my scheduled report? The time period in the View report for field only specifies the time period for a manually generated report. This time period doesn t apply when you specify a time period in the Schedule tab. The schedule time period specifies both the delivery cadence and the time period for data collection that is displayed in your report. For example, a daily report only displays 24 hours of data. To change the time period in a scheduled report, change the selection in the View report for field and manually generate a one-time report. Can I export my report as a CSV or Excel file instead of a PDF file? You cannot generate a CSV or Excel report from the Discover or Command appliance. How do I change the default text in my report s? All scheduled report s contain the report name and time range in the first line (unless you specify that report s contain no text). However, you can add a custom message. You can only schedule delivery of reports in the Command appliance. Log into the Command appliance and open the report from the Reports page in Systems Settings. Click the Footer tab and select Custom. Add your message and click OK. 153
154 Bundles Bundles enable you to create and save a set of system customizations for the Discover appliance or ExtraHop Command appliance. The following system customizations can be saved as part of a bundle: Alerts Applications Custom pages Dashboards Dynamic groups Flex grids Geomaps Triggers After creating a bundle, you can download the file in.json format and share the file with other users either directly or through the ExtraHop Solution Bundle Gallery. Essentials bundle Along with the built-in Activity and Network dashboards, the ExtraHop system ships with the Essentials bundle. This bundle provides a set of customizations that are designed to readily display common and related network metrics through a series of Essentials dashboards. Although the Essentials bundle is pre-installed, you must apply the bundle before you can view the Essentials dashboards. In addition, some of the dashboards require that you enable triggers on the system to view all of the metrics in the pre-defined widgets. Note: The Essentials bundle is designed to have minimal impact to your system, but you should always exercise caution when enabling a trigger. Apply the Essentials bundle 5. Click the System Settings icon and then click Bundles. From the list of bundles, select Essentials. Select the checkbox in the lower-right corner of the window to apply included assignments. Click Apply, and then click OK. (Optional) To view the Essentials dashboards, click Dashboards. The dashboards are listed in the left pane, under My Dashboards. Enable triggers for the Essentials bundle Note: The dashboards for encryption and DNS require that you enable two triggers that ship with the Essentials bundle. Click the System Settings icon, and then click Triggers. From the list of triggers, select AAAA detection on IPV4 networks and Encryption Auditing Trigger (Application). Click Enable. After these triggers are enabled, your network traffic must be processed before the metrics in the dashboards display any data. 154
155 Create a bundle These steps show you how to create a downloadable.json file that you can store or send to other users. On the Bundles page, click New. Complete the following information in the Bundle Settings window: Name Assign a name to the bundle. Author Specify the creator of the bundle. Bundles loaded by default have the author "ExtraHop." Required Version Specify a required version for this bundle. If you try to import a bundle that requires a newer firmware version, a warning message displays in the Actions section of the Bundle Settings window. Note: This warning does not prevent the bundle from loading. Contents Select the system customizations that you want to add to the bundle, such as triggers, dashboards, and alerts. Click the arrow to expand the list of available items. Description (Optional) Type a description about the bundle. Click OK to save the bundle. Modify a bundle These steps show you how to modify an existing bundle that has been uploaded to the ExtraHop system. On the Bundles page, click the name of a bundle. In the View Bundle dialog box, the Actions section is now present. This section appears only after the bundle has been saved to the list. (Optional) To download the bundle to your work station in.json file format, click the Download button. (Optional) To choose how to handle imported objects with names that match existing objects, click the Existing Objects drop-down list. To exclude the object from the import, select Skip. To modify the preexisting object to match the data of the object being imported, select Overwrite. Click the Edit Raw Data button to view and edit the raw, JSON-formatted bundle content. The raw data text box is blank until the bundle has been added to the list. Note: The bundle preserves the version of the customizations at the time of creation. If you modify an object after creating a bundle, the object inside the bundle remains unchanged. If you want the bundle to contain the modified object, you must create another bundle. Upload a bundle These steps show you how to upload a bundle.json file to the ExtraHop system. After you upload a bundle, you must apply the bundle. On the Bundles page, click the Upload button. The Load Bundle dialog box appears. 155
156 In the Load Bundle dialog box, do one of the following: Paste the bundle data directly into the Load Bundle window. Click the Choose File button to upload a saved bundle in.json file format. Click the Upload button. Apply a bundle These steps show you how to apply a bundle that has been uploaded to the ExtraHop system. Note that some bundles require that you enable related triggers or apply included assignments. On the Bundles page, click on the name of a bundle. In the Actions section, click the Apply button to enable the bundle and see the Bundle Import Status dialog box. This dialog box tells you whether the bundle was applied. If you selected Skip from the Existing objects drop-down list, the dialog box includes a list of skipped objects. Delete a bundle These steps show you how to delete a bundle from the ExtraHop system. When you delete a bundle, you also delete all of the bundle objects. On the Bundles page, select the checkbox next to the bundle(s) that you want to delete. Click the Delete button. Upload a bundle to the ExtraHop website After you create a bundle, you can upload your bundle to the ExtraHop website to share your work with other ExtraHop customers. Download the bundle you want to upload. a) Log into the Web UI of an ExtraHop Discover appliance. b) Click the System Settings icon. c) d) e) Click Bundles. Click the name of the bundle. Click Download. The bundle downloads as a.json file. In a web browser, open Click Contribute Now. Sign in with your extrahop.com username and password. In the Title field, type the bundle name. In the Minimum ExtraHop version field, type the earliest version of the ExtraHop firmware that supports all of the features contained in the bundle. 7. Tip: We recommend that you specify the version of ExtraHop firmware that is currently running on your appliance. Specifying the current version ensures that your bundle will not be accidentally installed on an appliance that does not support the bundle. In the Select categories field, select an appropriate category. 8. Tip: You can find descriptions of each bundle category on the bundle gallery page at In the Description field, type a description for the bundle. 156
157 Note: You can include Markdown syntax to style the Description, Requirements, and Installation instructions sections. In the Requirements field, type any requirements for the bundle. For example, the Ransomware Bundle requires that your data feed be configured to view SMB/CIFS traffic for your network-attached storage. In the Installation instructions field, type instructions for installing the bundle. For example, if your bundle requires the user to configure a trigger in a specific way, you should state that as part of the installation instructions. Click the Browse button. Select the.json bundle file that you downloaded from the Discover appliance. Review how the bundle page will display in the Bundle Details Preview section. Click Submit Bundle. Bundles are reviewed by ExtraHop Support before the bundle appears on the ExtraHop website. The amount of time needed to review a bundle varies depending on the complexity and size of the bundle. In general, you can expect to see your bundle on the ExtraHop website within a few business days. Update a bundle on the ExtraHop website You can update your uploaded bundle on the ExtraHop website. For example, you might want to update a bundle if you discover a bug in your trigger code or want to add additional information to your descriptions. ExtraHop Support automatically deprecates older versions of a bundle if a newer version is uploaded. For example, if you upload a bundle titled Real User Monitoring with Boomerang and then later upload another bundle titled Real User Monitoring with Boomerang v0, ExtraHop Support will remove the first bundle from the site when the second is posted Rebuild the bundle. a) Click the System Settings icon. b) Click Bundles. c) Click New. d) Fill out the necessary fields. e) Click OK. Download the bundle you want to upload. a) Log into the Web UI of an ExtraHop Discover appliance. b) Click the System Settings icon. c) Click Bundles. d) Click the name of the bundle. e) Click Download. In a web browser, open Click Contribute Now. Sign in with your extrahop.com username and password. In the Title field, type the name of the bundle and append a version number. For example, if you are updating a bundle originally titled Real User Monitoring with Boomerang, you could title this bundle Real User Monitoring with Boomerang v0. Fill out the remaining fields. For more information about each field, see Upload a bundle to the ExtraHop website. 157
158 Remove a bundle from the ExtraHop website To remove a bundle from the ExtraHop site, you must send a request to ExtraHop Support at support@extrahop.com with the following information: Name of the bundle Author of the bundle The reason you would like the bundle to be removed in your request 158
159 Geomaps A geomap is a visual representation of worldwide activity based on a single count metric. The ExtraHop system determines the originating IP address of each metric event and plots it to a regional data point on the geomap. By tracking real-time user activity by location, geomaps offer at-a-glance visibility into count metrics that are important to you. Geomaps enable you to monitor the geographic locations of your customers to identify areas with the most and least customer traffic, or help you identify potential threats from suspect IP addresses. For example, if you want to know if SSH attempts are coming from unauthorized locations, assign an SSH session metric to a geomap. The map displays a data point for each location from which an SSH request has originated, and you can click on a data point to show the IP addresses that sent those requests. Also, if an alert has been configured for a count metric assigned to a geomap, the color of the data point indicates the severity level of the active alert. You can click the data point to reveal details such as the name of the alert. When you are ready to start tracking metric activity, there are two ways to create a geomap depending on the source of the count metric: If the source of the metric you want to track is a device, you can automatically generate a geomap from a chart. If the source of the metric you want to track is a device group or application, you must create and configure a geomap through System Settings, assign it to the source, and then open it from the metric source page. Next steps Generate a geomap for a single device Create a geomap for a device group or an application Generate a geomap for a single device The ExtraHop system makes it easy for you to generate a geomap on-the-fly for a single device from a chart widget that contains the count metric you want to track. You can only generate geomaps from charts that display the total count for a top-level metric that can be broken down by IP address. Log into the Web UI on the Discover appliance. Navigate to the chart that contains the count metric you want to map. The chart can be on a device protocol page or on a dashboard. Click Metrics, click Devices from the left pane, and then click the device you want. Click Dashboards, and then click the dashboard you want. Note: If there is no chart that displays the count metric you want, Edit a chart widget and add it to a dashboard. Keep in mind that each source you add to the chart must be a device and each metric must be a count metric that can be broken down by IP address. Click a metric label in the chart legend to open a context menu. From the Drill down by list on the context menu, select the detail metric that you want to map. Note: If the count metric is configured to display a detail metric, the Drill down by list is not available, and you cannot generate a geomap from the chart. You will navigate to the device page for that detail metric. 159
160 5. Click the View on Map button. The geomap opens in full-screen on a new browser tab so that you can view multiple geomaps at the same time. Tip: You can save or bookmark the geomap URL to quickly return to it. Next steps View regional details provided on a geomap View alert details provided on a geomap Track geomap locations with the most activity with Autopilot Create a geomap for a device group or an application If you want to track count metric activity for a device group or an application, you have to create a geomap through System Settings. Note: The workflow for creating a geomap and assigning it to sources through System Settings is deprecated. This workflow will be removed in a future version. 5. Log into the Web UI on the Discover appliance. Click the System Settings icon and then click Geomaps. Click New to open the Geomap Configuration window. On the Geomaps Settings tab, type a unique, friendly name. Select the count metric that you want to track and then complete the following information: a) Click the Select metric icon. b) Click the source of the metric, such as application. c) Click the protocol of the metric, such as HTTP or SSL. d) Click the IP address type, such as client or server. e) Note: To track a custom metric, click Custom from the list and enter key pattern information about the metric to refine your search. The key pattern is interpreted as a regular expression and must apply Perl-Compatible Regular Expression (PCRE) syntax. Click the top-level count metric that you want to track. Note: Some top-level metrics enable you to specify additional information about the metric through a key pattern. The key pattern is interpreted as a regular expression and must apply PCRE syntax. 6. Click Save. Next steps Assign a geomap to a device group or application Assign a geomap to a device group or application After you create a geomap map, you must assign it to a metric source. The source must match the type selected when you configured the metric for the geomap. For example, if you selected an application metric when you created the geomap, you can only assign the geomap to an application. After the geomap is assigned to a metric source, it only displays data collected from that source. You can only assign geomaps to device groups or applications. Otherwise, you can generate a geomap for a single device instead. 160
161 Although you create and configure geomaps from the System Settings, you assign a geomap to a source from the Metrics page in the ExtraHop Web UI. The following procedure shows you how to assign a geomap to an application, which is similar for device groups. 5. Log into the Web UI on the Discover appliance. Click Metrics. Click Applications in the left pane. Select the checkbox of each application you want to assign the geomap to. From the menu at the top of the page, click Assign Geomap. The system opens a list of geomaps that are eligible for assignment to the selected applications. For example, the list will not include geomaps configured for devices. Select the checkbox of each geomap you want to assign to the selected applications. Click Assign Geomaps Next steps Open a geomap for a device group or application Open a geomap for a device group or application You can open a geomap from the device group or application it is assigned to. If the source of the metric you want to map is for a single device, you can generate a geomap for a single device instead. Log into the Web UI on the Discover appliance. Click Metrics. Select the device group or application that the geomap is assigned to. In the left pane, click Geomaps. Note: For device groups, you must switch to the deprecated view of the device groups page to see the list of geomaps assigned to the group. 5. Click the name of the geomap you want to view. The geomap opens in full-screen on a new browser tab so that you can view multiple geomaps at the same time. Tip: You can save or bookmark the geomap URL to quickly return to it. Next steps View regional details provided on a geomap View alert details provided on a geomap Track geomap locations with the most activity with Autopilot View regional details provided on a geomap Metric activity on a geomap is represented regionally by colored data points. Each data point contains IP address and user activity information for that region. Click a data point to view the following regional activity details: Summary Displays the following information about user activity in the region: The total number of IP addresses on which a response or a request has been made. The number of unique IP addresses out of the total number of addresses. 161
162 The mean, or average, number of IP addresses per unique IP address. Top locales Displays the top two locales that generate the most activity in the region. Locales are cities that are geographically close together and can be summarized in one region. For example, the window might display Mountain View, California and Oakland, California as the top locales for a region. Top users Displays the top six users that have generated the most activity in the region. Each user is identified by IP address, and the number of responses or requests generated by each IP address is displayed. View alert details provided on a geomap A metric tracked on a geomap might be associated with one or more alerts. If the metric activity meets alert conditions, the appearance of the data point indicates the severity level Alert severity levels are represented by the following colors on the geomap: Gray Indicates that no user-defined alerts are configured, or only edge-triggered alerts are configured. Green Indicates that no user-defined alerts are configured, or that an alert with a severity level of Debug and Informational was generated. Orange Indicates that at least one alert with a severity level of Notice or Warning was generated. Red with spinning edges Indicates that at least one alert with a severity level of Error or Critical was generated. Red with sonar beacons Indicates that at least one alert with a severity level of Emergency or Alert was generated. For example, if an alert is configured to watch HTTP responses on a group of web servers so that any time the ratio of errors exceeds 5%, a critical-level notification is sent. If your geomap tracks HTTP responses on the same web servers, data points display as red with spinning edges in each region the alert condition is met. The Firing Mode setting of an alert affects the data points on the geomap. For example, edge-triggered alerts are prompted only when the alert threshold is crossed, so the data point is red when the issue first occurs, but not continuously. Level-triggered alerts are generated continuously while the alert conditions are true, and the data point reflects the continuous state. We recommend that you configure level-triggered alerts at the same interval (or more frequently) as the time interval that you are displaying in the geomap. Click the data point to view the following alert details: The IP addresses that have been generated an alert. The alert severity level associated with each IP address. The name of the alert associated with each IP address. See Alerts for more information about configuring alerts and alert severity levels. Track geomap locations with the most activity with Autopilot The Autopilot feature sequentially highlights the top eight regions on the geomap with the most user activity. 162
163 When you launch Autopilot, a set of cross-hairs focuses on a data point, and the Region Details window and the Alert Details window (if alert information is available) are displayed. After several seconds, the focus moves to a different data point. You can complete the following tasks from the Autopilot window, which is located near the bottom right corner of the geomap: Click Start to launch Autopilot. Click Next to move focus to the next data point with a high-volume of activity. Click Stop to disable Autopilot. Geomaps FAQ Find answers to frequently asked questions about how geomap features work in the ExtraHop system. How do I change the appearance of a geomap? What does the Updater do? What are the graphs in the left pane? How do I save display changes I ve made to my geomap? Can I copy a geomap? How do I change the appearance of a geomap? Controls are available at the top of the geomap that enable you to configure display options. Interval The time range of data to display. The options available are last 5 minutes, last 30 minutes, last 6 hours, last 24 hours, and last 7 days. Note: You can select a custom range if it was created with the Time Selector in the ExtraHop Discover appliance. Region The geomap region to zoom in and focus on. The options available are World, United States, Africa, Asia, Australia, Europe, North America, and South America. Map The visual appearance of the geomap. The options available are Light, Dark, Blue, and Treasure. Color The color of geomap components. The options available are Tangerine, Burgundy, Lime, Turquoise, and Grey. Click the x icon to hide the controls. Click Show Controls to display the controls at the top of the geomap. What does the Updater do? The Updater feature displays a timer that counts down to the next refresh of the geomap. The value of the Interval control, located at the top of the geomap, determines one of the following refresh rates: If the interval is 5 minutes, the geomap updates every 30 seconds. If the interval is 30 minutes, the geomap updates every 5 minutes. If the interval is 6 hours, 24 hours, or 7 days, the geomap updates every 60 minutes. If the interval is a custom range, the value of the custom range determines one of the following refresh rates: If the custom range interval is less than 5 minutes, the geomap updates every 30 seconds. If the custom range interval is less than 60 minutes, the geomap updates every 5 minutes. If the custom range interval is 60 minutes or greater, the geomap updates every 60 minutes. 163
164 What are the graphs in the left pane? The left side of the geomap displays graphs that break up activity into small geographical data sets. If the region is set to World, the activity graphs display the amount of user activity data per country. If the region is set to United States, the graphs display activity data per state. Click the << icon to hide the activity graphs pane. Click the > icon to reveal the pane. How do I save display changes I ve made to my geomap? Because geomaps are displayed in their own browser windows, you can save or bookmark the URL to quickly return to the geomap. Bookmarks are useful for adding geomaps to a presentation or for display in your NOC. The following display configurations can be preserved when you save or bookmark the URL: Display controls Display controls in the banner at the top of the geomap are displayed by default. To open a geomap with the controls automatically hidden, click the x icon and bookmark the URL in your web browser. The URL will contain the bannercollapsed=true parameter to preserve your preference. Activity graphs Activity graphs in the left pane of the geomap are displayed by default. To open a geomap with the activity graphs pane automatically hidden, click the << icon and bookmark the URL in your web browser. The URL will contain the panecollapsed=true parameter to preserve your preference. Autopilot The Autopilot feature displayed in the lower right of the geomap is off by default. To open a geomap with Autopilot automatically launched, start Autopilot and bookmark the URL in your web browser. The URL will contain the autopilot=true parameter to preserve your preference. Can I copy a geomap? You can create a new geomap for a device group or an application by copying an existing one through System Settings. Charts generated from a chart for a single device cannot be copied. Log into the Web UI on the Discover appliance. Click the System Settings icon and then click Geomaps. From the table on the Geomaps page, select the checkbox next to the geomap that you want to copy. Click Copy. The copied geomap is added to the table with "(copy)" appended to the geomap name. By default, the copied geomap is not assigned to any sources. 164
165 System Health The ExtraHop system provides diagnostic tools that enable you to monitor and assess the health of components and services on the ExtraHop system. Get started with system health You can assess the health and performance of your ExtraHop appliance through system health tools. Monitoring system health data enables you to ensure that your ExtraHop appliance is running as expected, to discover and troubleshoot issues, and to assess areas that need improvement. For example, you can monitor the number of packets processed by the ExtraHop system to ensure that packets are continuously captured. If you are sending data to a remote, third-party system through an open data stream (ODS), you can troubleshoot transmission errors to determine whether more memory needs to be dedicated to open data streams or whether an open data stream trigger requires modification. Or, you might want to monitor CPU statistics to determine whether CPU usage rates are within normal ranges. The ExtraHop system provides the following tools to assess performance and discover performance issues: System Health Displays a collection of charts that contain status and performance data in several areas of the ExtraHop system such as data capture, triggers, and open data streams. SSL certificates Displays status information for all SSL certificates on the ExtraHop appliance. Admin UI status and diagnostics Displays data about ExtraHop components and the wire data feed, and provides troubleshooting tools such as audit logs, exception files, and support packs. View the following resources to learn more about system health: System Health Walkthrough: Assess trigger performance ExtraHealth Bundle Status and Diagnostics in the ExtraHop Admin UI Guide Navigate the System Health page The System Health page provides the bulk of health and performance information for your ExtraHop system. The System Health page displays a number of charts that track capture, remote, datastore, and trend data. Each chart enables you to view how the data changes over time. The time interval selected in the Global Time Selector is applied to all charts on the page. 165


166 The sparklines on each chart contain data points that display additional details about a single point in time. Hover your mouse over a data point to display the additional details. System Health FAQ System health charts provide a lot of valuable data, but which charts are most helpful when you are looking to answering specific questions? Here are several frequently asked questions that can be answered by analyzing system health charts. How do I check for possible data loss? How do I monitor resource consumption? How do I check the performance of my RPCAP deployments? Are my triggers running properly? How do triggers affect my appliance? How are my open data streams performing? What is the estimated lookback capacity? How many devices is the appliance monitoring? Are my SSL certificates decrypting as expected? How do I add system health metrics to a dashboard? What other tools can help me evaluate system health? How do I check for possible data loss? The best indicators of data loss are dropped packets, TCP desyncs, and excessively high packet or throughput rates. The best indicators of data loss are dropped packets, TCP desyncs, and excessively high packet or throughput rates. Check the Drops chart for packets dropped at the network card interface, SPAN, or network tap Check the TCP desyncs chart for system-wide desyncs, which indicate that synchronization was lost when processing a TCP connection. Monitor the following charts to ensure that the ExtraHop appliance is not exceeding product thresholds: Incoming packets breakdown Incoming throughput breakdown 166
ExtraHop 7.2 Admin UI Guide
 ExtraHop 7.2 Admin UI Guide 2018 ExtraHop Networks, Inc. All rights reserved. This manual in whole or in part, may not be reproduced, translated, or reduced to any machinereadable form without prior written
ExtraHop 7.1 Admin UI Guide
 ExtraHop 7.1 Admin UI Guide 2017 ExtraHop Networks, Inc. All rights reserved. This manual in whole or in part, may not be reproduced, translated, or reduced to any machinereadable form without prior written
AAA (Authentication, Authorization, and Accounting) is a framework that contains protocols that control user access and resource tracking.
 is a framework that contains protocols that control user access and resource tracking.") ExtraHop Glossary Published: 2019-02-09 AAA AAA (Authentication, Authorization, and Accounting) is a framework that contains protocols that control user access and resource tracking. ActiveMQ ActiveMQ
ExtraHop Glossary Published: 2019-02-09 AAA AAA (Authentication, Authorization, and Accounting) is a framework that contains protocols that control user access and resource tracking. ActiveMQ ActiveMQ
Drill down. Drill down on metrics from a dashboard or protocol page
 Drill down Published: 2017-12-29 An interesting metric naturally leads to questions about behavior in your network environment. For example, if you find a large number of DNS request timeouts on your network,
ExtraHop 6.0 ExtraHop REST API Guide
 ExtraHop 6.0 ExtraHop REST API Guide 2018 ExtraHop Networks, Inc. All rights reserved. This manual in whole or in part, may not be reproduced, translated, or reduced to any machinereadable form without
ExtraHop 7.5 Admin UI Guide
 ExtraHop 7.5 Admin UI Guide 2018 ExtraHop Networks, Inc. All rights reserved. This manual in whole or in part, may not be reproduced, translated, or reduced to any machinereadable form without prior written
vrealize Operations Management Pack for NSX for vsphere 2.0
 vrealize Operations Management Pack for NSX for vsphere 2.0 This document supports the version of each product listed and supports all subsequent versions until the document is replaced by a new edition.
ExtraHop 6.2 Admin UI Guide
 ExtraHop 6.2 Admin UI Guide 2018 ExtraHop Networks, Inc. All rights reserved. This manual in whole or in part, may not be reproduced, translated, or reduced to any machinereadable form without prior written
Pure Storage FlashArray Management Pack for VMware vrealize Operations Manager User Guide. (Version with Purity 4.9.
 Pure Storage FlashArray Management Pack for VMware vrealize Operations Manager User Guide (Version 1.0.139 with Purity 4.9.x or higher) Sunday, November 27, 2016 16:13 Pure Storage FlashArray Management
BIG-IP Analytics: Implementations. Version 13.1
 BIG-IP Analytics: Implementations Version 13.1 Table of Contents Table of Contents Setting Up Application Statistics Collection...5 What is Analytics?...5 About HTTP Analytics profiles... 5 Overview:
vrealize Operations Management Pack for NSX for vsphere 3.0
 vrealize Operations Management Pack for NSX for vsphere 3.0 This document supports the version of each product listed and supports all subsequent versions until the document is replaced by a new edition.
Monitoring and Analysis
 CHAPTER 3 Cisco Prime Network Analysis Module 5.1 has two types of dashboards: One type is the summary views found under the Monitor menu, and the other type is the over time views found under the Analyze
vrealize Operations Management Pack for NSX for vsphere 3.5.0
 vrealize Operations Management Pack for NSX for vsphere 3.5.0 This document supports the version of each product listed and supports all subsequent versions until the document is replaced by a new edition.
vrealize Operations Management Pack for NSX for Multi-Hypervisor
 vrealize Operations Management Pack for This document supports the version of each product listed and supports all subsequent versions until the document is replaced by a new edition. To check for more
NetBrain POC Walk-Through
 NetBrain POC Walk-Through For OE 4.1 Dynamic Documentation Visual Troubleshooting NetBrain Technologies, Inc. 2004-2013. All rights reserved +1.800.605.7964 support@netbraintech.com www.netbraintech.com
Advanced Application Reporting USER GUIDE
 Advanced Application Reporting USER GUIDE CONTENTS 1.0 Preface: About This Document 5 2.0 Conventions 5 3.0 Chapter 1: Introducing Advanced Application Reporting 6 4.0 Features and Benefits 7 5.0 Product
ExtraHop 7.3 ExtraHop Trace REST API Guide
 ExtraHop 7.3 ExtraHop Trace REST API Guide 2018 ExtraHop Networks, Inc. All rights reserved. This manual in whole or in part, may not be reproduced, translated, or reduced to any machinereadable form without
Using the Cisco NAC Profiler Endpoint Console
 CHAPTER 15 Topics in this chapter include: Overview, page 15-1 Display Endpoints by Profile, page 15-4 Display Endpoints by Device Port, page 15-9 Unauthorized Endpoints, page 15-12 Endpoint Directory
AAA (Authentication, Authorization, and Accounting) is a framework that contains protocols that control user access and resource tracking.
 is a framework that contains protocols that control user access and resource tracking.") ExtraHop Glossary Published: 2019-02-11 AAA AAA (Authentication, Authorization, and Accounting) is a framework that contains protocols that control user access and resource tracking. ActiveMQ ActiveMQ
ExtraHop Glossary Published: 2019-02-11 AAA AAA (Authentication, Authorization, and Accounting) is a framework that contains protocols that control user access and resource tracking. ActiveMQ ActiveMQ
ExtraHop 6.1 ExtraHop Explore Admin UI Guide
 ExtraHop 6.1 ExtraHop Explore Admin UI Guide 2018 ExtraHop Networks, Inc. All rights reserved. This manual in whole or in part, may not be reproduced, translated, or reduced to any machinereadable form
Deploy the ExtraHop Discover Appliance with VMware
 Deploy the ExtraHop Discover Appliance with VMware Published: 2018-07-17 The ExtraHop virtual appliance can help you to monitor the performance of your applications across internal networks, the public
Monitor load balancer performance in a dashboard
 Monitor load balancer performance in a dashboard Published: 2017-11-22 During times of high demand on an application or service, you can configure a load balancer to help with service reliability and hardware
BIG-IP Analytics: Implementations. Version 12.1
 BIG-IP Analytics: Implementations Version 12.1 Table of Contents Table of Contents Setting Up Application Statistics Collection...5 What is Analytics?...5 About HTTP Analytics profiles...5 Overview: Collecting
ExtraHop 7.5 ExtraHop REST API Guide
 ExtraHop 7.5 ExtraHop REST API Guide 2018 ExtraHop Networks, Inc. All rights reserved. This manual in whole or in part, may not be reproduced, translated, or reduced to any machinereadable form without
Cisco Unified Serviceability
 Cisco Unified Serviceability Introduction, page 1 Installation, page 5 Introduction This document uses the following abbreviations to identify administration differences for these Cisco products: Unified
IBM Security QRadar Deployment Intelligence app IBM
 IBM Security QRadar Deployment Intelligence app IBM ii IBM Security QRadar Deployment Intelligence app Contents QRadar Deployment Intelligence app.. 1 Installing the QRadar Deployment Intelligence app.
The following topics describe how to use dashboards in the Firepower System:
 The following topics describe how to use dashboards in the Firepower System: About, page 1 Firepower System Dashboard Widgets, page 2 Managing, page 14 About Firepower System dashboards provide you with
Working with Reports
 The following topics describe how to work with reports in the Firepower System: Introduction to Reports, page 1 Risk Reports, page 1 Standard Reports, page 2 About Working with Generated Reports, page
What s New in Fireware v12.3 WatchGuard Training
 What s New in Fireware v12.3 2 What s New in Fireware v12.3 Updates to Networking functionality: SD-WAN actions SD-WAN reporting enhancements NetFlow support Link monitor enhancements Centralized FireCluster
Stealthwatch System Version 6.10.x to Update Guide
 Stealthwatch System Version 6.10.x to 6.10.5 Update Guide Use this guide to update the following Stealthwatch appliances from v6.10.x to v6.10.5: UDP Director (also known as FlowReplicator) Endpoint Concentrator
Deploy the ExtraHop Discover Appliance with Hyper-V
 Deploy the ExtraHop Discover Appliance with Hyper-V Published: 2018-12-14 The following procedures explain how to deploy the ExtraHop Discover EDA 1000v and EDA 2000v virtual appliance on the Microsoft
Deploy the ExtraHop Discover Appliance with Hyper-V
 Deploy the ExtraHop Discover Appliance with Hyper-V Published: 2018-07-16 The following procedures explain how to deploy the ExtraHop Discover EDA 1000v and EDA 2000v virtual appliance on the Microsoft
Adobe Marketing Cloud Report Builder
 Adobe Marketing Cloud Report Builder Contents Adobe Report Builder Help...6 What's New in Report Builder...7 Report Builder 5.6...7 Report Builder 5.5...7 Report Builder 5.4...7 Report Builder 5.3...8
ExtraHop Rest API Guide
 ExtraHop Rest API Guide Version 5.0 Introduction to ExtraHop REST API The ExtraHop REST application programming interface (API) enables you to automate administration and configuration tasks on your ExtraHop
The following topics describe how to work with reports in the Firepower System:
 The following topics describe how to work with reports in the Firepower System: Introduction to Reports Introduction to Reports, on page 1 Risk Reports, on page 1 Standard Reports, on page 2 About Working
Deploy the ExtraHop Discover Appliance with VMware
 Deploy the ExtraHop Discover Appliance with VMware Published: 2018-09-26 Published: 2018-09-26 The ExtraHop virtual appliance can help you to monitor the performance of your applications across internal
Device Management Basics
 The following topics describe how to manage devices in the Firepower System: The Device Management Page, page 1 Remote Management Configuration, page 2 Adding Devices to the Firepower Management Center,
F5 DDoS Hybrid Defender : Setup. Version
 F5 DDoS Hybrid Defender : Setup Version 13.1.0.3 Table of Contents Table of Contents Introducing DDoS Hybrid Defender... 5 Introduction to DDoS Hybrid Defender...5 DDoS deployments... 5 Example DDoS Hybrid
NetBrain Quick Start Guide For End Users
 NetBrain Quick Start Guide For End Users Dynamic Documentation Network Analysis Visual Troubleshooting Automation Qapp Network Change Management Thin Client NetBrain Technologies, Inc. 2004-2015. All rights
KYOCERA Net Admin User Guide
 KYOCERA Net Admin User Guide Legal Notes Unauthorized reproduction of all or part of this guide is prohibited. The information in this guide is subject to change without notice. We cannot be held liable
UDP Director Virtual Edition Installation and Configuration Guide (for Stealthwatch System v6.9.0)
") UDP Director Virtual Edition Installation and Configuration Guide (for Stealthwatch System v6.9.0) Installation and Configuration Guide: UDP Director VE v6.9.0 2016 Cisco Systems, Inc. All rights reserved.
UDP Director Virtual Edition Installation and Configuration Guide (for Stealthwatch System v6.9.0) Installation and Configuration Guide: UDP Director VE v6.9.0 2016 Cisco Systems, Inc. All rights reserved.
NetBrain Quick Start Guide For End Users
 NetBrain Quick Start Guide For End Users Dynamic Documentation Network Analysis Visual Troubleshooting Automation Qapp Network Change Management Thin Client NetBrain Technologies, Inc. 2004-2016. All rights
Monitoring the Device
 The system includes dashboards and an Event Viewer that you can use to monitor the device and traffic that is passing through the device. Enable Logging to Obtain Traffic Statistics, page 1 Monitoring
Server Status Dashboard
 The Cisco Prime Network Registrar server status dashboard in the web user interface (web UI) presents a graphical view of the system status, using graphs, charts, and tables, to help in tracking and diagnosis.
Introduction to the New ScienceLogic User Interface. ScienceLogic Beta Version 8.5.0
 Introduction to the New ScienceLogic User Interface ScienceLogic Beta Version 8.5.0 Table of Contents Introduction to the New ScienceLogic User Interface 4 Logging In and Logging Out of the New ScienceLogic
Comodo cwatch Network Software Version 2.23
 rat Comodo cwatch Network Software Version 2.23 Administrator Guide Guide Version 2.23.060618 Comodo Security Solutions 1255 Broad Street Clifton, NJ 07013 Table of Contents 1 Introduction to Comodo cwatch
Pass4sure q. Cisco Securing Cisco Networks with Sourcefire IPS
 Pass4sure.500-285.42q Number: 500-285 Passing Score: 800 Time Limit: 120 min File Version: 6.1 Cisco 500-285 Securing Cisco Networks with Sourcefire IPS I'm quite happy to announce that I passed 500-285
Using Diagnostic Tools
 Using Diagnostic Tools The Tools System Diagnostics page on the INVESTIGATE view provides several diagnostic tools that help troubleshoot various kinds of network problems and process monitors. Tech Support
DNS Server Status Dashboard
 The Cisco Prime IP Express server status dashboard in the web user interface (web UI) presents a graphical view of the system status, using graphs, charts, and tables, to help in tracking and diagnosis.
Assurance Features and Navigation
 Assurance Features and Navigation Cisco DNA Center 1.1.2 Job Aid Copyright Page THE SPECIFICATIONS AND INFORMATION REGARDING THE PRODUCTS IN THIS MANUAL ARE SUBJECT TO CHANGE WITHOUT NOTICE. ALL STATEMENTS,
NGFW Security Management Center
 NGFW Security Management Center Release Notes 6.4.8 Revision A Contents About this release on page 2 System requirements on page 2 Build version on page 3 Compatibility on page 5 New features on page 5
Network Discovery Policies
 The following topics describe how to create, configure, and manage network discovery policies: Overview:, page 1 Network Discovery Customization, page 2 Network Discovery Rules, page 3 Configuring Advanced
Visualize the Network Topology
 Network Topology Overview, page 1 Datacenter Topology, page 3 View Detailed Tables of Alarms and Links in a Network Topology Map, page 3 Determine What is Displayed in the Topology Map, page 4 Get More
High Availability Synchronization PAN-OS 5.0.3
 High Availability Synchronization PAN-OS 5.0.3 Revision B 2013, Palo Alto Networks, Inc. www.paloaltonetworks.com Contents Overview... 3 Device Configuration... 4 Network Configuration... 9 Objects Configuration...
Locating Users in the Network with User Tracking
 CHAPTER 3 Locating Users in the Network with User Tracking User Tracking allows you to locate end-user hosts and IP phones in the network. It uses information gathered from network devices to display data
End User Monitoring. AppDynamics Pro Documentation. Version Page 1
 End User Monitoring AppDynamics Pro Documentation Version 4.1.1 Page 1 End User Monitoring....................................................... 4 Browser Real User Monitoring.............................................
Avaya M-MLS Routing Manager User Guide
 Avaya M-MLS Routing Manager User Guide April 2002 Avaya M-MLS Routing Manager User Guide Copyright Avaya Inc. 2002 ALL RIGHTS RESERVED The products, specifications, and other technical information regarding
NGFW Security Management Center
 NGFW Security Management Center Release Notes 6.3.2 Revision A Contents About this release on page 2 System requirements on page 2 Build version on page 3 Compatibility on page 5 New features on page 5
Packet Forwarding with RPCAP
 Packet Forwarding with RPCAP Published: 2019-02-09 The ExtraHop Discover appliance generates metrics about your network and applications through a wire data feed, which is typically mirrored from a switch.
VMWARE VREALIZE OPERATIONS MANAGEMENT PACK FOR. Cisco Networking. User Guide
 VMWARE VREALIZE OPERATIONS MANAGEMENT PACK FOR User Guide TABLE OF CONTENTS 1. Purpose....3 2. Introduction to the Management Pack....3 2.1 How the Management Pack Collects Data....3 2.2 Data the Management
Overview. ACE Appliance Device Manager Overview CHAPTER
 1 CHAPTER This section contains the following: ACE Appliance Device Manager, page 1-1 Logging Into ACE Appliance Device Manager, page 1-3 Changing Your Account Password, page 1-4 ACE Appliance Device Manager
WhatsUp Gold. Evaluation Guide
 WhatsUp Gold Evaluation Guide Table of Contents This guide provides and overview of WhatsUp Gold. Refer to our Online Help for more details. Section Step 1: Getting Started Description Installation requirements
Lenovo ThinkAgile XClarity Integrator for Nutanix Installation and User's Guide
 Lenovo ThinkAgile XClarity Integrator for Nutanix Installation and User's Guide Version 1.0 Note Before using this information and the product it supports, read the information in Appendix A Notices on
Device Management Basics
 The following topics describe how to manage devices in the Firepower System: The Device Management Page, on page 1 Remote Management Configuration, on page 2 Add Devices to the Firepower Management Center,
Online Help StruxureWare Data Center Expert
 Online Help StruxureWare Data Center Expert Version 7.2.7 What's New in StruxureWare Data Center Expert 7.2.x Learn more about the new features available in the StruxureWare Data Center Expert 7.2.x release.
F5 Analytics and Visibility Solutions
 Agility 2017 Hands-on Lab Guide F5 Analytics and Visibility Solutions F5 Networks, Inc. 2 Contents: 1 Class 1: Introduction to F5 Analytics 5 1.1 Lab Environment Setup.......................................
Cisco Unified Service Statistics Manager 8.7
 Deployment Guide Cisco Unified Service Statistics Manager 8.7 Deployment Best Practices For further information, questions and comments please contact ask-ucms@cisco.com 2012 Cisco and/or its affiliates.
First Steps to Using a PacketShaper
 First Steps to Using a PacketShaper Table of Contents Table of Contents Overview... 1 Classifying Traffic on the Network... 2 Discover Traffic...2 View the Class Tree...3 Problems?...4 Analyzing Network
Stealthwatch System Version Update Guide
 Stealthwatch System Version 6.9.5 Update Guide Use this guide to update the following Stealthwatch appliances from v6.8.x to v6.9.5: UDP Director (also known as FlowReplicator ) Endpoint Concentrator Stealthwatch
NGFW Security Management Center
 NGFW Security Management Center Release Notes 6.4.3 Revision A Contents About this release on page 2 System requirements on page 2 Build version on page 3 Compatibility on page 4 New features on page 5
HPE Intelligent Management Center
 HPE Intelligent Management Center Service Health Manager Administrator Guide Abstract This guide provides introductory, configuration, and usage information for Service Health Manager (SHM). It is for
User s Manual. Version 5
 User s Manual Version 5 Copyright 2017 Safeway. All rights reserved. No part of this publication may be reproduced, transmitted, transcribed, stored in a retrieval system, or translated into any language,
Learn how to login to Sitefinity and what possible errors you can get if you do not have proper permissions.
 USER GUIDE This guide is intended for users of all levels of expertise. The guide describes in detail Sitefinity user interface - from logging to completing a project. Use it to learn how to create pages
End User Monitoring. AppDynamics Pro Documentation. Version 4.2. Page 1
 End User Monitoring AppDynamics Pro Documentation Version 4.2 Page 1 End User Monitoring....................................................... 4 Browser Real User Monitoring.............................................
vrealize Automation Management Pack 2.0 Guide
 vrealize Automation Management Pack 2.0 Guide This document supports the version of each product listed and supports all subsequent versions until the document is replaced by a new edition. To check for
ForeScout Extended Module for Tenable Vulnerability Management
 ForeScout Extended Module for Tenable Vulnerability Management Version 2.7.1 Table of Contents About Tenable Vulnerability Management Module... 4 Compatible Tenable Vulnerability Products... 4 About Support
IMC Network Traffic Analyzer 7.3 (E0504) Copyright 2015, 2017 Hewlett Packard Enterprise Development LP
 Copyright 2015, 2017 Hewlett Packard Enterprise Development LP") Network Traffic Analyzer 7.3 (E0504) Copyright 2015, 2017 Hewlett Packard Enterprise Development LP Table of Contents 1. What's New in this Release 2. Problems Fixed in this Release 3. Software Distribution
Network Traffic Analyzer 7.3 (E0504) Copyright 2015, 2017 Hewlett Packard Enterprise Development LP Table of Contents 1. What's New in this Release 2. Problems Fixed in this Release 3. Software Distribution
you choose and by the roles the users are allowed to fulfill within the system. Finances Enter the monthly savings and costs for the project.
 Oracle Instantis EnterpriseTrack Quick Reference Guide for Release 8.5 Create a Proposal From the Top Navigation Bar, click Create Proposals/Charters. Enter all the required fields and click Save to save
ZENworks Reporting System Reference. January 2017
 ZENworks Reporting System Reference January 2017 Legal Notices For information about legal notices, trademarks, disclaimers, warranties, export and other use restrictions, U.S. Government rights, patent
AT&T REPORTING AND MANAGEMENT TOOL (ARMT) USER GUIDE VERSION
 USER GUIDE VERSION") AT&T REPORTING AND MANAGEMENT TOOL (ARMT) USER GUIDE VERSION 3.11.3 2018 AT&T Intellectual Property. All rights reserved. AT&T and the AT&T logo are trademarks of AT&T Intellectual Property. All other
AT&T REPORTING AND MANAGEMENT TOOL (ARMT) USER GUIDE VERSION 3.11.3 2018 AT&T Intellectual Property. All rights reserved. AT&T and the AT&T logo are trademarks of AT&T Intellectual Property. All other
VMWARE VREALIZE OPERATIONS MANAGEMENT PACK FOR. Nagios. User Guide
 VMWARE VREALIZE OPERATIONS MANAGEMENT PACK FOR Nagios User Guide TABLE OF CONTENTS 1. Purpose...3 2. Introduction to the Management Pack...3 2.1 How the Management Pack Collects Data...3 2.2 Data the Management
ForeScout CounterACT. Configuration Guide. Version 5.0
 ForeScout CounterACT Core Extensions Module: Reports Plugin Version 5.0 Table of Contents About the Reports Plugin... 3 Requirements... 3 Supported Browsers... 3 Verify That the Plugin Is Running... 5
CounterACT 7.0. Quick Installation Guide for a Single Virtual CounterACT Appliance
 CounterACT 7.0 Quick Installation Guide for a Single Virtual CounterACT Appliance Table of Contents Welcome to CounterACT Version 7.0... 3 Overview... 4 1. Create a Deployment Plan... 5 Decide Where to
Deploy the ExtraHop Trace Appliance with VMware
 Deploy the ExtraHop Trace Appliance with VMware Published: 2018-12-14 This guide explains how to deploy the virtual ExtraHop Trace appliances (ETA 1150v and ETA 6150v) on the VMware ESXi/ESX platform.
Nintex Reporting 2008 Help
 Nintex Reporting 2008 Help Last updated: Thursday, 24 December 2009 1 Using Nintex Reporting 2008 1.1 Chart Viewer Web Part 1.2 Importing and Exporting Reports 1.3 Import Nintex report page 1.4 Item Level
Device Management Basics
 The following topics describe how to manage devices in the Firepower System: The Device Management Page, on page 1 Remote Management Configuration, on page 2 Adding Devices to the Firepower Management
ForeScout CounterACT. (AWS) Plugin. Configuration Guide. Version 1.3
 Plugin. Configuration Guide. Version 1.3") ForeScout CounterACT Hybrid Cloud Module: Amazon Web Services (AWS) Plugin Version 1.3 Table of Contents Amazon Web Services Plugin Overview... 4 Use Cases... 5 Providing Consolidated Visibility... 5 Dynamic
ForeScout CounterACT Hybrid Cloud Module: Amazon Web Services (AWS) Plugin Version 1.3 Table of Contents Amazon Web Services Plugin Overview... 4 Use Cases... 5 Providing Consolidated Visibility... 5 Dynamic
ForeScout CounterACT. Configuration Guide. Version 1.2
 ForeScout CounterACT Core Extensions Module: NetFlow Plugin Version 1.2 Table of Contents About NetFlow Integration... 3 How it Works... 3 Supported NetFlow Versions... 3 What to Do... 3 Requirements...
Performing Path Traces
 About Path Trace, page 1 Performing a Path Trace, page 13 Collecting QoS and Interface Statistics in a Path Trace, page 15 About Path Trace With Path Trace, the controller reviews and collects network
Monitor DNS errors in a dashboard
 Monitor DNS errors in a dashboard Published: 2018-04-20 The Domain Name System (DNS) is an essential service for resolving hostnames to IP addresses. Any system that needs to locate and communicate with
The following topics describe how to configure traffic profiles:
 The following topics describe how to configure traffic profiles: Introduction to Traffic Profiles, page 1 Managing Traffic Profiles, page 5 Configuring Traffic Profiles, page 6 Introduction to Traffic
Documentation. This PDF was generated for your convenience. For the latest documentation, always see
 Management Pack for AWS 1.50 Table of Contents Home... 1 Release Notes... 3 What's New in Release 1.50... 4 Known Problems and Workarounds... 5 Get started... 7 Key concepts... 8 Install... 10 Installation
Solution Composer. User's Guide
 Solution Composer User's Guide January 2014 www.lexmark.com Contents 2 Contents Overview...4 Understanding the basics...4 System recommendations...5 Building custom solutions...6 Getting started...6 Step
Cisco Stealthwatch. Update Guide 7.0
 Cisco Stealthwatch Update Guide 7.0 Table of Contents Introduction 5 Overview 5 Audience 5 Terminology 5 New Update Process 6 Before You Begin 7 Software Version 7 Java 7 TLS 7 Default Credentials 8 Third
vcenter Operations Management Pack for NSX-vSphere
 vcenter Operations Management Pack for NSX-vSphere vcenter Operations Manager 5.8 This document supports the version of each product listed and supports all subsequent versions until the document is replaced
Using the Portal in Operations Manager
 CHAPTER 2 These topics describe how to use the portal in Cisco Unified Operations Manager: Understanding the Diagnostics View, page 2-1 Customizing Your Dashboard, page 2-1 Working with Dashboard Views,
NGFW Security Management Center
 NGFW Security Management Center Release Notes 6.4.4 Revision A Contents About this release on page 2 System requirements on page 2 Build version on page 3 Compatibility on page 5 New features on page 5
McAfee Client Proxy Product Guide
 McAfee Client Proxy 2.3.5 Product Guide COPYRIGHT Copyright 2018 McAfee, LLC TRADEMARK ATTRIBUTIONS McAfee and the McAfee logo, McAfee Active Protection, epolicy Orchestrator, McAfee epo, McAfee EMM, Foundstone,
Licensing the Firepower System
 The following topics explain how to license the Firepower System. About Firepower Feature Licenses, page 1 Service Subscriptions for Firepower Features, page 2 Smart Licensing for the Firepower System,
The following topics describe how to configure correlation policies and rules.
 The following topics describe how to configure correlation policies and rules. Introduction to and Rules, page 1 Configuring, page 2 Configuring Correlation Rules, page 5 Configuring Correlation Response