VAMPIR & VAMPIRTRACE INTRODUCTION AND OVERVIEW
|
|
|
- Beverly Shelton
- 6 years ago
- Views:
Transcription

1 VAMPIR & VAMPIRTRACE INTRODUCTION AND OVERVIEW 8th VI-HPS Tuning Workshop at RWTH Aachen September, 2011 Tobias Hilbrich and Joachim Protze Slides by: Andreas Knüpfer, Jens Doleschal, ZIH, Technische Universität Dresden
2 Overview Part I: Welcome to the Vampir Suite Introduction Event Trace Visualization Vampir & VampirServer The Vampir Displays Timeline Process Timeline with Performance Counters Summary Display Message Statistics VampirTrace Instrumentation & Run-Time Measurement Part II: Hands On 2
3 Introduction Why bother with performance analysis? Well, why are you here after all? Efficient usage of expensive and limited resources Scalability to achieve next bigger simulation Profiling and Tracing Have an optimization phase just like testing and debugging phase Use tools! Avoid do-it-yourself-with-printf solutions, really! 3
4 Event Trace Visualization Trace Visualization Alternative and supplement to automatic analysis Show dynamic run-time behavior graphically Provide statistics and performance metrics Global timeline for parallel processes/threads Process timeline plus performance counters Statistics summary display Message statistics more Interactive browsing, zooming, selecting Adapt statistics to zoom level (time interval) Also for very large and highly parallel traces 4


 Vampir 7")


5 Vampir Toolset Architecture CPU CPU CPU CPU Multi-Core Program CPU CPU CPU CPU Vampir Trace Trace File (OTF) Vampir 7 CPU CPU CPU CPU CPU CPU CPU CPU CPU CPU CPU CPU Vampir Trace VampirServer CPU CPU CPU CPU CPU CPU CPU CPU CPU CPU CPU CPU Many-Core CPU CPU CPU CPU CPU CPU Program CPU CPU CPU CPU CPU CPU Trace Bundle CPU CPU CPU CPU CPU CPU CPU CPU CPU CPU CPU CPU 5
6 Usage order of the Vampir Performance Analysis Toolset 1. Instrument your application with VampirTrace 2. Run your application with an appropriate test set 3. Analyze your trace file with Vampir Small trace files can be analyzed on your local workstation 1. Start your local Vampir 2. Load trace file from your local disk Large trace files should be stored on the cluster file system 1. Start VampirServer on your analysis cluster 2. Start your local Vampir 3. Connect local Vampir with the VampirServer on the analysis cluster 4. Load trace file from the cluster file system
7 Vampir Displays The main displays of Vampir: Master Timeline (Global Timeline ) Process and Counter Timeline Function Summary Message Summary Process Summary Communication Matrix Call Tree 7
8 Vampir 7: Displays for a WRF Trace with 64 Processes 8


9 Master Timeline (Global Timeline) Master Timeline 9


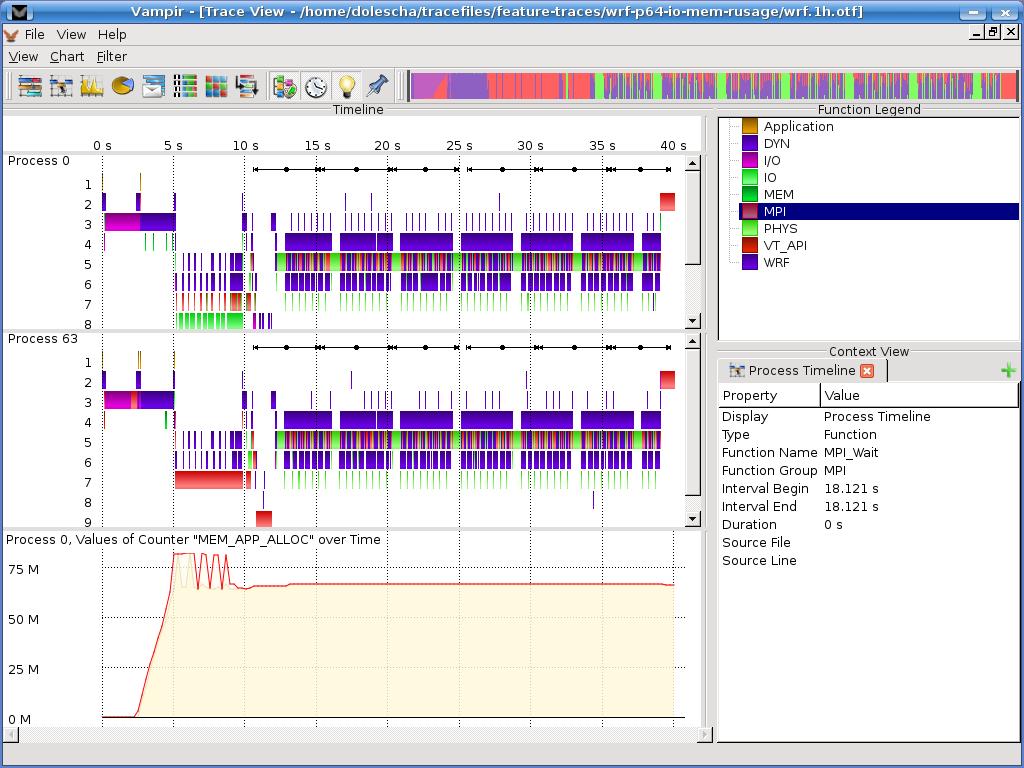


10 Process and Counter Timeline Process Timeline Counter Timeline


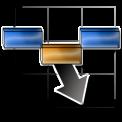
11 Function Summary Function Summary


12 Message Summary

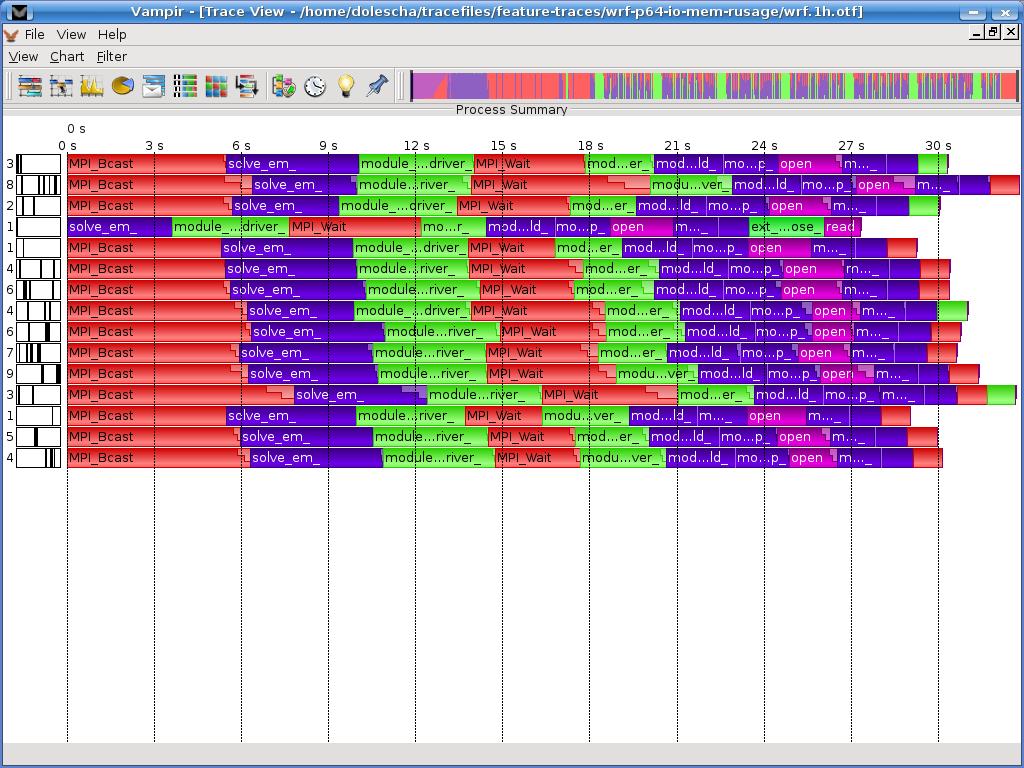


13 Process Summary Process Summary 13


14 Communication Matrix Communication Matrix


15 Call Tree
16 Introduction: Profiling & Tracing Program Instrumentation Detect run-time events (points of interest) Pass information to run-time measurement library Profile Recording Collect aggregated information (Time, Counts, ) About program and system entities functions, loops, basic blocks application, processes, threads, Trace Recording Save individual event records together with precise timestamp and process or thread ID Plus event specific information 16
17 Instrumentation & Measurement What do you need to do for it? Use VampirTrace Instrumentation (automatic with compiler wrappers) CC=icc CXX=icpc F90=ifc MPICC=mpicc CC=vtcc CXX=vtcxx F90=vtf90 MPICC=vtcc -vt:cc mpicc Re-compile & re-link Trace Run (run with appropriate test data set) More details later 17
18 Instrumentation & Measurement What does VampirTrace do in the background? Instrumentation: Via compiler wrappers By underlying compiler with specific options MPI instrumentation with replacement lib OpenMP instrumentation with Opari Also binary instrumentation with Dyninst Also source2source instrumentation with PDT (Tau) Partial manual instrumentation 18
19 Instrumentation & Measurement What does VampirTrace do in the background? Trace Run: Event data collection Precise time measurement Parallel timer synchronization Collecting parallel process/thread traces Collecting performance counters (from PAPI, memory usage, POSIX I/O calls and fork/system/exec calls, and more ) Filtering and grouping of function calls 19
20 Summary Vampir & VampirServer Interactive trace visualization and analysis Intuitive browsing and zooming Scalable to large trace data sizes (100GByte) Scalable to high parallelism (2000 processes) Vampir for Linux, Windows and MacOS VampirTrace Convenient instrumentation and measurement Hides away complicated details Provides many options and switches for experts VampirTrace is part of Open MPI since version

21 Vampir & VampirTrace Event Tracing in General 21
22 Common Event Types Enter/leave of function/routine/region time stamp, process/thread, function ID Send/receive of P2P message (MPI) time stamp, sender, receiver, length, tag, communicator Collective communication (MPI) time stamp, process, root, communicator, # bytes Hardware performance counter values time stamp, process, counter ID, value etc. 22
23 Profiling and Tracing Tracing Advantages Preserve temporal and spatial relationships Allow reconstruction of dynamic behavior on any required abstraction level Profiles can be calculated from traces Tracing Disadvantages Traces can become very large May cause perturbation Instrumentation and tracing is complicated Event buffering, clock synchronization, 23
24 Instrumentation Instrumentation: Process of modifying programs to detect and report events There are various ways of instrumentation: Manually Large effort, error prone Difficult to manage Automatically Via source to source translation Via compiler instrumentation Program Database Toolkit (PDT) OpenMP Pragma And Region Instrumenter (Opari) 24
25 ( OTF ) Open Trace Format Open source trace file format Available at Includes powerful libotf for reading/parsing/writing in custom applications Multi-level API: High level interface for analysis tools Low level interface for trace libraries Actively developed by TU Dresden in cooperation with the University of Oregon and the Lawrence Livermore National Laboratory 25
26 Practical Instrumentation Instrumentation with VampirTrace Hide instrumentation in compiler wrapper Use underlying compiler, add appropriate options CC = mpicc CC = vtcc vt:cc mpicc Test Run User representative test input Set parameters, environment variables, etc. Perform trace run Get Trace 26
27 Source Code Instrumentation int foo(void* arg) { if (cond) { return 1; } int foo(void* arg) { enter(7); if (cond) { leave(7); return 1; } leave(7); return 0; return 0; } } manually or automatically 27
Introducing OTF / Vampir / VampirTrace
 Center for Information Services and High Performance Computing (ZIH) Introducing OTF / Vampir / VampirTrace Zellescher Weg 12 Willers-Bau A115 Tel. +49 351-463 - 34049 (Robert.Henschel@zih.tu-dresden.de)
Performance analysis basics
 Performance analysis basics Christian Iwainsky Iwainsky@rz.rwth-aachen.de 25.3.2010 1 Overview 1. Motivation 2. Performance analysis basics 3. Measurement Techniques 2 Why bother with performance analysis
Performance Analysis with Vampir. Joseph Schuchart ZIH, Technische Universität Dresden
 Performance Analysis with Vampir Joseph Schuchart ZIH, Technische Universität Dresden 1 Mission Visualization of dynamics of complex parallel processes Full details for arbitrary temporal and spatial levels
Performance Analysis with Vampir
 Performance Analysis with Vampir Johannes Ziegenbalg Technische Universität Dresden Outline Part I: Welcome to the Vampir Tool Suite Event Trace Visualization The Vampir Displays Vampir & VampirServer
Interactive Performance Analysis with Vampir UCAR Software Engineering Assembly in Boulder/CO,
 Interactive Performance Analysis with Vampir UCAR Software Engineering Assembly in Boulder/CO, 2013-04-03 Andreas Knüpfer, Thomas William TU Dresden, Germany Overview Introduction Vampir displays GPGPU
Score-P. SC 14: Hands-on Practical Hybrid Parallel Application Performance Engineering 1
 Score-P SC 14: Hands-on Practical Hybrid Parallel Application Performance Engineering 1 Score-P Functionality Score-P is a joint instrumentation and measurement system for a number of PA tools. Provide
[Scalasca] Tool Integrations
![[Scalasca] Tool Integrations](/thumbs/95/125562042.jpg "[Scalasca] Tool Integrations") Mitglied der Helmholtz-Gemeinschaft [Scalasca] Tool Integrations Aug 2011 Bernd Mohr CScADS Performance Tools Workshop Lake Tahoe Contents Current integration of various direct measurement tools Paraver
Mitglied der Helmholtz-Gemeinschaft [Scalasca] Tool Integrations Aug 2011 Bernd Mohr CScADS Performance Tools Workshop Lake Tahoe Contents Current integration of various direct measurement tools Paraver
Performance Analysis with Vampir
 Performance Analysis with Vampir Ronny Brendel Technische Universität Dresden Outline Part I: Welcome to the Vampir Tool Suite Mission Event Trace Visualization Vampir & VampirServer The Vampir Displays
Center for Information Services and High Performance Computing (ZIH) Session 3: Hands-On
 Session 3: Hands-On") Center for Information Services and High Performance Computing (ZIH) Session 3: Hands-On Dr. Matthias S. Müller (RWTH Aachen University) Tobias Hilbrich (Technische Universität Dresden) Joachim Protze
Center for Information Services and High Performance Computing (ZIH) Session 3: Hands-On Dr. Matthias S. Müller (RWTH Aachen University) Tobias Hilbrich (Technische Universität Dresden) Joachim Protze
Performance Analysis with Vampir
 Performance Analysis with Vampir Ronald Geisler, Holger Brunst, Bert Wesarg, Matthias Weber, Hartmut Mix, Ronny Tschüter, Robert Dietrich, and Andreas Knüpfer Technische Universität Dresden Outline Part
VAMPIR & VAMPIRTRACE Hands On
 VAMPIR & VAMPIRTRACE Hands On 8th VI-HPS Tuning Workshop at RWTH Aachen September, 2011 Tobias Hilbrich and Joachim Protze Slides by: Andreas Knüpfer, Jens Doleschal, ZIH, Technische Universität Dresden
Introduction to Parallel Performance Engineering
 Introduction to Parallel Performance Engineering Markus Geimer, Brian Wylie Jülich Supercomputing Centre (with content used with permission from tutorials by Bernd Mohr/JSC and Luiz DeRose/Cray) Performance:
( ZIH ) Center for Information Services and High Performance Computing. Event Tracing and Visualization for Cell Broadband Engine Systems
 Center for Information Services and High Performance Computing. Event Tracing and Visualization for Cell Broadband Engine Systems") ( ZIH ) Center for Information Services and High Performance Computing Event Tracing and Visualization for Cell Broadband Engine Systems ( daniel.hackenberg@zih.tu-dresden.de ) Daniel Hackenberg Cell Broadband
( ZIH ) Center for Information Services and High Performance Computing Event Tracing and Visualization for Cell Broadband Engine Systems ( daniel.hackenberg@zih.tu-dresden.de ) Daniel Hackenberg Cell Broadband
Comprehensive Lustre I/O Tracing with Vampir
 Comprehensive Lustre I/O Tracing with Vampir Lustre User Group 2010 Zellescher Weg 12 WIL A 208 Tel. +49 351-463 34217 ( michael.kluge@tu-dresden.de ) Michael Kluge Content! Vampir Introduction! VampirTrace
Score-P A Joint Performance Measurement Run-Time Infrastructure for Periscope, Scalasca, TAU, and Vampir
 Score-P A Joint Performance Measurement Run-Time Infrastructure for Periscope, Scalasca, TAU, and Vampir Andreas Knüpfer, Christian Rössel andreas.knuepfer@tu-dresden.de, c.roessel@fz-juelich.de 2011-09-26
Vampir and Lustre. Understanding Boundaries in I/O Intensive Applications
 Center for Information Services and High Performance Computing (ZIH) Vampir and Lustre Understanding Boundaries in I/O Intensive Applications Zellescher Weg 14 Treffz-Bau (HRSK-Anbau) - HRSK 151 Tel. +49
Performance Analysis of MPI Programs with Vampir and Vampirtrace Bernd Mohr
 Performance Analysis of MPI Programs with Vampir and Vampirtrace Bernd Mohr Research Centre Juelich (FZJ) John von Neumann Institute of Computing (NIC) Central Institute for Applied Mathematics (ZAM) 52425
Profiling with TAU. Le Yan. 6/6/2012 LONI Parallel Programming Workshop
 Profiling with TAU Le Yan 6/6/2012 LONI Parallel Programming Workshop 2012 1 Three Steps of Code Development Debugging Make sure the code runs and yields correct results Profiling Analyze the code to identify
VAMPIR & VAMPIRTRACE Hands On
 VAMPIR & VAMPIRTRACE Hands On PRACE Spring School 2012 in Krakow May, 2012 Holger Brunst Slides by: Andreas Knüpfer, Jens Doleschal, ZIH, Technische Universität Dresden Hands-on: NPB Build Copy NPB sources
HPC Tools on Windows. Christian Terboven Center for Computing and Communication RWTH Aachen University.
 - Excerpt - Christian Terboven terboven@rz.rwth-aachen.de Center for Computing and Communication RWTH Aachen University PPCES March 25th, RWTH Aachen University Agenda o Intel Trace Analyzer and Collector
Performance Analysis of Large-Scale OpenMP and Hybrid MPI/OpenMP Applications with Vampir NG
 Performance Analysis of Large-Scale OpenMP and Hybrid MPI/OpenMP Applications with Vampir NG Holger Brunst Center for High Performance Computing Dresden University, Germany June 1st, 2005 Overview Overview
Profiling with TAU. Le Yan. User Services LSU 2/15/2012
 Profiling with TAU Le Yan User Services HPC @ LSU Feb 13-16, 2012 1 Three Steps of Code Development Debugging Make sure the code runs and yields correct results Profiling Analyze the code to identify performance
Introduction to VI-HPS
 Introduction to VI-HPS José Gracia HLRS Virtual Institute High Productivity Supercomputing Goal: Improve the quality and accelerate the development process of complex simulation codes running on highly-parallel
Introduction to Performance Engineering
 Introduction to Performance Engineering Markus Geimer Jülich Supercomputing Centre (with content used with permission from tutorials by Bernd Mohr/JSC and Luiz DeRose/Cray) Performance: an old problem
ISC 09 Poster Abstract : I/O Performance Analysis for the Petascale Simulation Code FLASH
 ISC 09 Poster Abstract : I/O Performance Analysis for the Petascale Simulation Code FLASH Heike Jagode, Shirley Moore, Dan Terpstra, Jack Dongarra The University of Tennessee, USA [jagode shirley terpstra
Integrating Parallel Application Development with Performance Analysis in Periscope
 Technische Universität München Integrating Parallel Application Development with Performance Analysis in Periscope V. Petkov, M. Gerndt Technische Universität München 19 April 2010 Atlanta, GA, USA Motivation
AutoTune Workshop. Michael Gerndt Technische Universität München
 AutoTune Workshop Michael Gerndt Technische Universität München AutoTune Project Automatic Online Tuning of HPC Applications High PERFORMANCE Computing HPC application developers Compute centers: Energy
Score-P A Joint Performance Measurement Run-Time Infrastructure for Periscope, Scalasca, TAU, and Vampir
 Score-P A Joint Performance Measurement Run-Time Infrastructure for Periscope, Scalasca, TAU, and Vampir VI-HPS Team Score-P: Specialized Measurements and Analyses Mastering build systems Hooking up the
Vampir 8 User Manual
 Vampir 8 User Manual Copyright c 2012 GWT-TUD GmbH Blasewitzer Str. 43 01307 Dresden, Germany http://gwtonline.de Support / Feedback / Bugreports Please provide us feedback! We are very interested to hear
Vampir 9 User Manual
 Vampir 9 User Manual Copyright c 2018 GWT-TUD GmbH Freiberger Str. 33 01067 Dresden, Germany http://gwtonline.de Support / Feedback / Bug Reports Please provide us feedback! We are very interested to hear
EZTrace upcoming features
 EZTrace 1.0 + upcoming features François Trahay francois.trahay@telecom-sudparis.eu 2015-01-08 Context Hardware is more and more complex NUMA, hierarchical caches, GPU,... Software is more and more complex
Vampir 8 User Manual
 Vampir 8 User Manual Copyright c 2013 GWT-TUD GmbH Blasewitzer Str. 43 01307 Dresden, Germany http://gwtonline.de Support / Feedback / Bugreports Please provide us feedback! We are very interested to hear
Analysis report examination with Cube
 Analysis report examination with Cube Marc-André Hermanns Jülich Supercomputing Centre Cube Parallel program analysis report exploration tools Libraries for XML+binary report reading & writing Algebra
Performance Analysis of Parallel Scientific Applications In Eclipse
 Performance Analysis of Parallel Scientific Applications In Eclipse EclipseCon 2015 Wyatt Spear, University of Oregon wspear@cs.uoregon.edu Supercomputing Big systems solving big problems Performance gains
Automatic trace analysis with the Scalasca Trace Tools
 Automatic trace analysis with the Scalasca Trace Tools Ilya Zhukov Jülich Supercomputing Centre Property Automatic trace analysis Idea Automatic search for patterns of inefficient behaviour Classification
A Survey on Performance Tools for OpenMP
 A Survey on Performance Tools for OpenMP Mubrak S. Mohsen, Rosni Abdullah, and Yong M. Teo Abstract Advances in processors architecture, such as multicore, increase the size of complexity of parallel computer
Potentials and Limitations for Energy Efficiency Auto-Tuning
 Center for Information Services and High Performance Computing (ZIH) Potentials and Limitations for Energy Efficiency Auto-Tuning Parco Symposium Application Autotuning for HPC (Architectures) Robert Schöne
OpenACC Support in Score-P and Vampir
 Center for Information Services and High Performance Computing (ZIH) OpenACC Support in Score-P and Vampir Hands-On for the Taurus GPU Cluster February 2016 Robert Dietrich (robert.dietrich@tu-dresden.de)
Developing Scalable Applications with Vampir, VampirServer and VampirTrace
 John von Neumann Institute for Computing Developing Scalable Applications with Vampir, VampirServer and VampirTrace Matthias S. Müller, Andreas Knüpfer, Matthias Jurenz, Matthias Lieber, Holger Brunst,
Performance Analysis with Periscope
 Performance Analysis with Periscope M. Gerndt, V. Petkov, Y. Oleynik, S. Benedict Technische Universität München periscope@lrr.in.tum.de October 2010 Outline Motivation Periscope overview Periscope performance
Intralayer Communication for Tree-Based Overlay Networks
 Lawrence Livermore National Laboratory Intralayer Communication for Tree-Based Overlay Networks PSTI Tobias Hilbrich (tobias.hilbrich@tu-dresden.de) Joachim Protze (protze@rz.rwth-aachen.de) Bronis R.
A Holistic Approach for Performance Measurement and Analysis for Petascale Applications
 A Holistic Approach for Performance Measurement and Analysis for Petascale Applications Heike Jagode 1,2, Jack Dongarra 1,2 Sadaf Alam 2, Jeffrey Vetter 2 Wyatt Spear 3, Allen D. Malony 3 1 The University
Hybrid Model Parallel Programs
 Hybrid Model Parallel Programs Charlie Peck Intermediate Parallel Programming and Cluster Computing Workshop University of Oklahoma/OSCER, August, 2010 1 Well, How Did We Get Here? Almost all of the clusters
Anna Morajko.
 Performance analysis and tuning of parallel/distributed applications Anna Morajko Anna.Morajko@uab.es 26 05 2008 Introduction Main research projects Develop techniques and tools for application performance
IBM High Performance Computing Toolkit
 IBM High Performance Computing Toolkit Pidad D'Souza (pidsouza@in.ibm.com) IBM, India Software Labs Top 500 : Application areas (November 2011) Systems Performance Source : http://www.top500.org/charts/list/34/apparea
ClearSpeed Visual Profiler
 ClearSpeed Visual Profiler Copyright 2007 ClearSpeed Technology plc. All rights reserved. 12 November 2007 www.clearspeed.com 1 Profiling Application Code Why use a profiler? Program analysis tools are
Operating Systems (2INC0) 2018/19. Introduction (01) Dr. Tanir Ozcelebi. Courtesy of Prof. Dr. Johan Lukkien. System Architecture and Networking Group
 2018/19. Introduction (01) Dr. Tanir Ozcelebi. Courtesy of Prof. Dr. Johan Lukkien. System Architecture and Networking Group") Operating Systems (2INC0) 20/19 Introduction (01) Dr. Courtesy of Prof. Dr. Johan Lukkien System Architecture and Networking Group Course Overview Introduction to operating systems Processes, threads and
Operating Systems (2INC0) 20/19 Introduction (01) Dr. Courtesy of Prof. Dr. Johan Lukkien System Architecture and Networking Group Course Overview Introduction to operating systems Processes, threads and
Powernightmares: The Challenge of Efficiently Using Sleep States on Multi-Core Systems
 Powernightmares: The Challenge of Efficiently Using Sleep States on Multi-Core Systems Thomas Ilsche, Marcus Hähnel, Robert Schöne, Mario Bielert, and Daniel Hackenberg Technische Universität Dresden Observation
SCALASCA v1.0 Quick Reference
 General SCALASCA is an open-source toolset for scalable performance analysis of large-scale parallel applications. Use the scalasca command with appropriate action flags to instrument application object
MPI Runtime Error Detection with MUST
 MPI Runtime Error Detection with MUST At the 27th VI-HPS Tuning Workshop Joachim Protze IT Center RWTH Aachen University April 2018 How many issues can you spot in this tiny example? #include #include
Integrated Tool Capabilities for Performance Instrumentation and Measurement
 Integrated Tool Capabilities for Performance Instrumentation and Measurement Sameer Shende, Allen Malony Department of Computer and Information Science University of Oregon sameer@cs.uoregon.edu, malony@cs.uoregon.edu
Profiling and Debugging Tools. Lars Koesterke University of Porto, Portugal May 28-29, 2009
 Profiling and Debugging Tools Lars Koesterke University of Porto, Portugal May 28-29, 2009 Outline General (Analysis Tools) Listings & Reports Timers Profilers (gprof, tprof, Tau) Hardware performance
Leistungsanalyse von Rechnersystemen
 Center for Information Services and High Performance Computing (ZIH) Leistungsanalyse von Rechnersystemen Monitoring Techniques Nöthnitzer Straße 46 Raum 1026 Tel. +49 351-463 - 35048 Holger Brunst (holger.brunst@tu-dresden.de)
Improving Applica/on Performance Using the TAU Performance System
 Improving Applica/on Performance Using the TAU Performance System Sameer Shende, John C. Linford {sameer, jlinford}@paratools.com ParaTools, Inc and University of Oregon. April 4-5, 2013, CG1, NCAR, UCAR
Tau Introduction. Lars Koesterke (& Kent Milfeld, Sameer Shende) Cornell University Ithaca, NY. March 13, 2009
 Cornell University Ithaca, NY. March 13, 2009") Tau Introduction Lars Koesterke (& Kent Milfeld, Sameer Shende) Cornell University Ithaca, NY March 13, 2009 General Outline Measurements Instrumentation & Control Example: matmult Profiling and Tracing
Tau Introduction Lars Koesterke (& Kent Milfeld, Sameer Shende) Cornell University Ithaca, NY March 13, 2009 General Outline Measurements Instrumentation & Control Example: matmult Profiling and Tracing
Introduction to Performance Tuning & Optimization Tools
 Introduction to Performance Tuning & Optimization Tools a[i] a[i+1] + a[i+2] a[i+3] b[i] b[i+1] b[i+2] b[i+3] = a[i]+b[i] a[i+1]+b[i+1] a[i+2]+b[i+2] a[i+3]+b[i+3] Ian A. Cosden, Ph.D. Manager, HPC Software
MUST: A Scalable Approach to Runtime Error Detection in MPI Programs
 Chapter 5 MUST: A Scalable Approach to Runtime Error Detection in MPI Programs Tobias Hilbrich, Martin Schulz, Bronis R. de Supinski, and Matthias S. Müller Abstract The Message-Passing Interface (MPI)
Detection and Analysis of Iterative Behavior in Parallel Applications
 Detection and Analysis of Iterative Behavior in Parallel Applications Karl Fürlinger and Shirley Moore Innovative Computing Laboratory, Department of Electrical Engineering and Computer Science, University
TAU 2.19 Quick Reference
 What is TAU? The TAU Performance System is a portable profiling and tracing toolkit for performance analysis of parallel programs written in Fortran, C, C++, Java, Python. It comprises 3 main units: Instrumentation,
An Implementation of the POMP Performance Monitoring for OpenMP based on Dynamic Probes
 An Implementation of the POMP Performance Monitoring for OpenMP based on Dynamic Probes Luiz DeRose IBM Research ACTC Yorktown Heights, NY USA laderose@us.ibm.com Bernd Mohr Forschungszentrum Jülich ZAM
Analyzing I/O Performance on a NEXTGenIO Class System
 Analyzing I/O Performance on a NEXTGenIO Class System holger.brunst@tu-dresden.de ZIH, Technische Universität Dresden LUG17, Indiana University, June 2 nd 2017 NEXTGenIO Fact Sheet Project Research & Innovation
Performance Analysis of Large-scale OpenMP and Hybrid MPI/OpenMP Applications with Vampir NG
 Performance Analysis of Large-scale OpenMP and Hybrid MPI/OpenMP Applications with Vampir NG Holger Brunst 1 and Bernd Mohr 2 1 Center for High Performance Computing Dresden University of Technology Dresden,
meinschaft May 2012 Markus Geimer
 meinschaft Mitglied der Helmholtz-Gem Module setup and compiler May 2012 Markus Geimer The module Command Software which allows to easily manage different versions of a product (e.g., totalview 5.0 totalview
Programming with MPI
 Programming with MPI p. 1/?? Programming with MPI Miscellaneous Guidelines Nick Maclaren Computing Service nmm1@cam.ac.uk, ext. 34761 March 2010 Programming with MPI p. 2/?? Summary This is a miscellaneous
NEXTGenIO Performance Tools for In-Memory I/O
 NEXTGenIO Performance Tools for In- I/O holger.brunst@tu-dresden.de ZIH, Technische Universität Dresden 22 nd -23 rd March 2017 Credits Intro slides by Adrian Jackson (EPCC) A new hierarchy New non-volatile
The PAPI Cross-Platform Interface to Hardware Performance Counters
 The PAPI Cross-Platform Interface to Hardware Performance Counters Kevin London, Shirley Moore, Philip Mucci, and Keith Seymour University of Tennessee-Knoxville {london, shirley, mucci, seymour}@cs.utk.edu
SCORE-P USER MANUAL. 4.0 (revision 13505) Wed May :20:42
 Wed May :20:42") SCORE-P USER MANUAL 4.0 (revision 13505) Wed May 2 2018 10:20:42 SCORE-P LICENSE AGREEMENT COPYRIGHT 2009-2014, RWTH Aachen University, Germany COPYRIGHT 2009-2013, Gesellschaft für numerische Simulation
SCORE-P USER MANUAL 4.0 (revision 13505) Wed May 2 2018 10:20:42 SCORE-P LICENSE AGREEMENT COPYRIGHT 2009-2014, RWTH Aachen University, Germany COPYRIGHT 2009-2013, Gesellschaft für numerische Simulation
Performance Tools for Technical Computing
 Christian Terboven terboven@rz.rwth-aachen.de Center for Computing and Communication RWTH Aachen University Intel Software Conference 2010 April 13th, Barcelona, Spain Agenda o Motivation and Methodology
Instrumentation. BSC Performance Tools
 Instrumentation BSC Performance Tools Index The instrumentation process A typical MN process Paraver trace format Configuration XML Environment variables Adding references to the source API CEPBA-Tools
OpenACC Course. Office Hour #2 Q&A
 OpenACC Course Office Hour #2 Q&A Q1: How many threads does each GPU core have? A: GPU cores execute arithmetic instructions. Each core can execute one single precision floating point instruction per cycle
MPI Runtime Error Detection with MUST and Marmot For the 8th VI-HPS Tuning Workshop
 MPI Runtime Error Detection with MUST and Marmot For the 8th VI-HPS Tuning Workshop Tobias Hilbrich and Joachim Protze ZIH, Technische Universität Dresden September 2011 Content MPI Usage Errors Error
A configurable binary instrumenter
 Mitglied der Helmholtz-Gemeinschaft A configurable binary instrumenter making use of heuristics to select relevant instrumentation points 12. April 2010 Jan Mussler j.mussler@fz-juelich.de Presentation
NUMA-aware OpenMP Programming
 NUMA-aware OpenMP Programming Dirk Schmidl IT Center, RWTH Aachen University Member of the HPC Group schmidl@itc.rwth-aachen.de Christian Terboven IT Center, RWTH Aachen University Deputy lead of the HPC
Score-P A Joint Performance Measurement Run-Time Infrastructure for Periscope, Scalasca, TAU, and Vampir
 Score-P A Joint Performance Measurement Run-Time Infrastructure for Periscope, Scalasca, TAU, and Vampir VI-HPS Team Congratulations!? If you made it this far, you successfully used Score-P to instrument
NEW DEVELOPER TOOLS FEATURES IN CUDA 8.0. Sanjiv Satoor
 NEW DEVELOPER TOOLS FEATURES IN CUDA 8.0 Sanjiv Satoor CUDA TOOLS 2 NVIDIA NSIGHT Homogeneous application development for CPU+GPU compute platforms CUDA-Aware Editor CUDA Debugger CPU+GPU CUDA Profiler
Tracing the Cache Behavior of Data Structures in Fortran Applications
 John von Neumann Institute for Computing Tracing the Cache Behavior of Data Structures in Fortran Applications L. Barabas, R. Müller-Pfefferkorn, W.E. Nagel, R. Neumann published in Parallel Computing:
Multi-Application Online Profiling Tool
 Multi-Application Online Profiling Tool Vi-HPS Julien ADAM, Antoine CAPRA 1 About MALP MALP is a tool originally developed in CEA and in the University of Versailles (UVSQ) It generates rich HTML views
Programming for Fujitsu Supercomputers
 Programming for Fujitsu Supercomputers Koh Hotta The Next Generation Technical Computing Fujitsu Limited To Programmers who are busy on their own research, Fujitsu provides environments for Parallel Programming
SHARCNET Workshop on Parallel Computing. Hugh Merz Laurentian University May 2008
 SHARCNET Workshop on Parallel Computing Hugh Merz Laurentian University May 2008 What is Parallel Computing? A computational method that utilizes multiple processing elements to solve a problem in tandem
Scalable Critical Path Analysis for Hybrid MPI-CUDA Applications
 Center for Information Services and High Performance Computing (ZIH) Scalable Critical Path Analysis for Hybrid MPI-CUDA Applications The Fourth International Workshop on Accelerators and Hybrid Exascale
Workload Characterization using the TAU Performance System
 Workload Characterization using the TAU Performance System Sameer Shende, Allen D. Malony, and Alan Morris Performance Research Laboratory, Department of Computer and Information Science University of
Score-P A Joint Performance Measurement Run-Time Infrastructure for Periscope, Scalasca, TAU, and Vampir (continued)
") Score-P A Joint Performance Measurement Run-Time Infrastructure for Periscope, Scalasca, TAU, and Vampir (continued) VI-HPS Team Congratulations!? If you made it this far, you successfully used Score-P
Score-P A Joint Performance Measurement Run-Time Infrastructure for Periscope, Scalasca, TAU, and Vampir (continued) VI-HPS Team Congratulations!? If you made it this far, you successfully used Score-P
ompp: A Profiling Tool for OpenMP
 ompp: A Profiling Tool for OpenMP Karl Fürlinger Michael Gerndt {fuerling, gerndt}@in.tum.de Technische Universität München Performance Analysis of OpenMP Applications Platform specific tools SUN Studio
Implementation of Parallelization
 Implementation of Parallelization OpenMP, PThreads and MPI Jascha Schewtschenko Institute of Cosmology and Gravitation, University of Portsmouth May 9, 2018 JAS (ICG, Portsmouth) Implementation of Parallelization
Oracle Developer Studio Performance Analyzer
 Oracle Developer Studio Performance Analyzer The Oracle Developer Studio Performance Analyzer provides unparalleled insight into the behavior of your application, allowing you to identify bottlenecks and
Profiling and Debugging Tools. Outline
 Profiling and Debugging Tools Karl W. Schulz Texas Advanced Computing Center The University of Texas at Austin UT/Portugal Summer Institute Training Coimbra, Portugal July 17, 2008 Outline General (Analysis
Interactive Analysis of Large Distributed Systems with Scalable Topology-based Visualization
 Interactive Analysis of Large Distributed Systems with Scalable Topology-based Visualization Lucas M. Schnorr, Arnaud Legrand, and Jean-Marc Vincent e-mail : Firstname.Lastname@imag.fr Laboratoire d Informatique
"Charting the Course to Your Success!" MOC A Developing High-performance Applications using Microsoft Windows HPC Server 2008
 Description Course Summary This course provides students with the knowledge and skills to develop high-performance computing (HPC) applications for Microsoft. Students learn about the product Microsoft,
Performance analysis with Periscope
 Performance analysis with Periscope M. Gerndt, V. Petkov, Y. Oleynik, S. Benedict Technische Universität petkovve@in.tum.de March 2010 Outline Motivation Periscope (PSC) Periscope performance analysis
CS420: Operating Systems
 Threads James Moscola Department of Physical Sciences York College of Pennsylvania Based on Operating System Concepts, 9th Edition by Silberschatz, Galvin, Gagne Threads A thread is a basic unit of processing
Parallel Performance Analysis Using the Paraver Toolkit
 Parallel Performance Analysis Using the Paraver Toolkit Parallel Performance Analysis Using the Paraver Toolkit [16a] [16a] Slide 1 University of Stuttgart High-Performance Computing Center Stuttgart (HLRS)
Introduction to pthreads
 CS 220: Introduction to Parallel Computing Introduction to pthreads Lecture 25 Threads In computing, a thread is the smallest schedulable unit of execution Your operating system has a scheduler that decides
Operating Systems 2010/2011
 Operating Systems 2010/2011 Introduction Johan Lukkien 1 Agenda OS: place in the system Some common notions Motivation & OS tasks Extra-functional requirements Course overview Read chapters 1 + 2 2 A computer
Introduction to OpenMP
 Introduction to OpenMP p. 1/?? Introduction to OpenMP More Syntax and SIMD Nick Maclaren nmm1@cam.ac.uk September 2017 Introduction to OpenMP p. 2/?? C/C++ Parallel for (1) I said that I would give the
Introduction to OpenMP
 Introduction to OpenMP p. 1/?? Introduction to OpenMP More Syntax and SIMD Nick Maclaren Computing Service nmm1@cam.ac.uk, ext. 34761 June 2011 Introduction to OpenMP p. 2/?? C/C++ Parallel for (1) I said
Computer Architecture
 Jens Teubner Computer Architecture Summer 2016 1 Computer Architecture Jens Teubner, TU Dortmund jens.teubner@cs.tu-dortmund.de Summer 2016 Jens Teubner Computer Architecture Summer 2016 2 Part I Programming
Scalability of Trace Analysis Tools. Jesus Labarta Barcelona Supercomputing Center
 Scalability of Trace Analysis Tools Jesus Labarta Barcelona Supercomputing Center What is Scalability? Jesus Labarta, Workshop on Tools for Petascale Computing, Snowbird, Utah,July 2007 2 Index General
SCALASCA parallel performance analyses of SPEC MPI2007 applications
 Mitglied der Helmholtz-Gemeinschaft SCALASCA parallel performance analyses of SPEC MPI2007 applications 2008-05-22 Zoltán Szebenyi Jülich Supercomputing Centre, Forschungszentrum Jülich Aachen Institute
Scalable Performance Analysis of Parallel Systems: Concepts and Experiences
 1 Scalable Performance Analysis of Parallel Systems: Concepts and Experiences Holger Brunst ab and Wolfgang E. Nagel a a Center for High Performance Computing, Dresden University of Technology, 01062 Dresden,
PTP - PLDT Parallel Language Development Tools Overview, Status & Plans
 PTP - PLDT Parallel Language Development Tools Overview, Status & Plans Beth Tibbitts tibbitts@us.ibm.com High Productivity Tools Group, IBM Research "This material is based upon work supported by the