Improving Applica/on Performance Using the TAU Performance System
|
|
|
- Robert Parrish
- 6 years ago
- Views:
Transcription
1 Improving Applica/on Performance Using the TAU Performance System Sameer Shende, John C. Linford {sameer, ParaTools, Inc and University of Oregon. April 4-5, 2013, CG1, NCAR, UCAR Download slides from: hdp:// hdp://
2 TAU Performance System Tuning and Analysis Utilities (18+ year project) Comprehensive performance profiling and tracing Integrated, scalable, flexible, portable Targets all parallel programming/execution paradigms Integrated performance toolkit Instrumentation, measurement, analysis, visualization Widely-ported performance profiling / tracing system Performance data management and data mining Open source (BSD-style license) Easy to integrate in application frameworks 2
3 Understanding Application Performance using TAU How much time is spent in each application routine and outer loops? Within loops, what is the contribution of each statement? How many instructions are executed in these code regions? Floating point, Level 1 and 2 data cache misses, hits, branches taken? What is the memory usage of the code? When and where is memory allocated/de-allocated? Are there any memory leaks? What are the I/O characteristics of the code? What is the peak read and write bandwidth of individual calls, total volume? What is the contribution of each phase of the program? What is the time wasted/spent waiting for collectives, and I/O operations in Initialization, Computation, I/O phases? How does the application scale? What is the efficiency, runtime breakdown of performance across different core counts? 3
4 What Can TAU Do? Profiling and tracing Profiling shows you how much (total) time was spent in each routine Tracing shows you when the events take place on a timeline Multi-language debugging Iden%fy the source loca%on of a crash by unwinding the system callstack Identify memory errors (off-by-one, etc.) Profiling and tracing can measure time as well as hardware performance counters (cache misses, instructions) from your CPU TAU can automatically instrument your source code using a package called PDT for routines, loops, I/O, memory, phases, etc. TAU runs on all HPC platforms and it is free (BSD style license) TAU includes instrumentation, measurement and analysis tools 4
 TAU can automatically instrument your source code using a package called PDT for routines, loops, I/O, memory, phases, etc.")
5 Profiling and Tracing Profiling Tracing Profiling shows you how much (total) time was spent in each routine Tracing shows you when the events take place on a timeline Metrics can be time or hardware performance counters (cache misses, instructions) TAU can automatically instrument your source code using a package called PDT for routines, loops, I/O, memory, phases, etc. 5
6 What does TAU support? OpenCL C/C++ CUDA UPC Python GPI Fortran OpenACC Java MPI pthreads Intel MIC OpenMP Intel GNU LLVM PGI Cray Sun MinGW Linux Windows AIX Insert yours here BlueGene Fujitsu NVIDIA Kepler ARM OS X 6
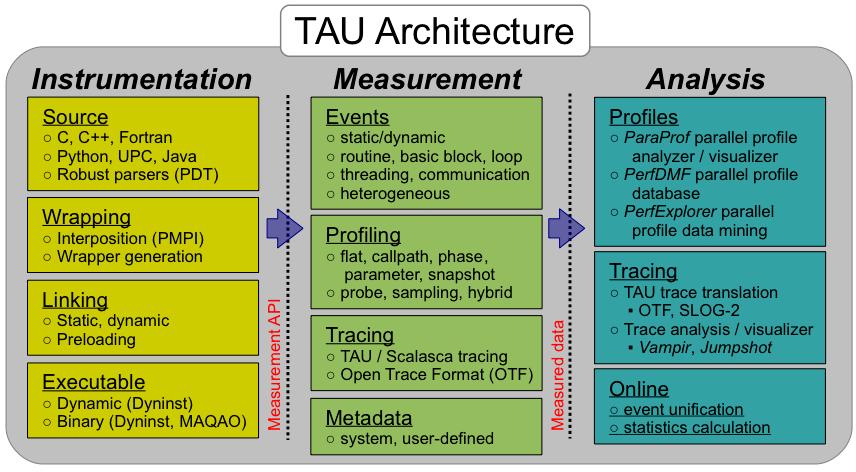
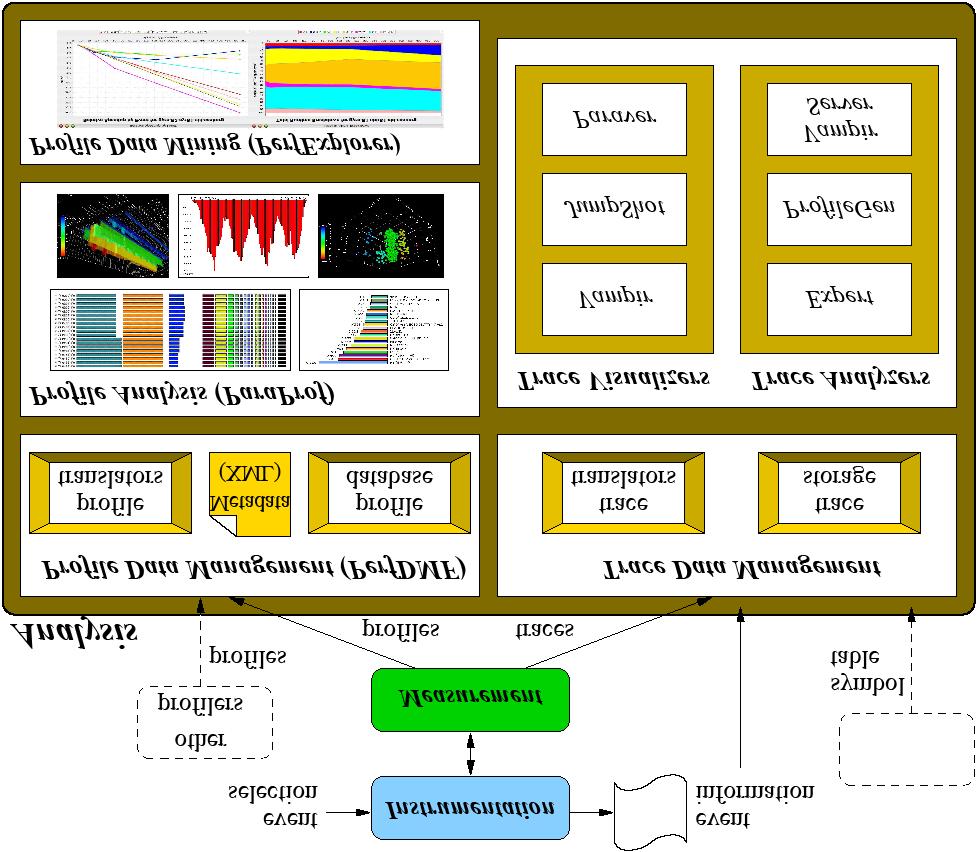
7 The TAU Architecture 7
8 TAU Architecture and Workflow Instrumentation: Add probes to perform measurements Source code instrumentation using pre-processors and compiler scripts Wrapping external libraries (I/O, MPI, Memory, CUDA, OpenCL, pthread) Rewriting the binary executable Measurement: Profiling or tracing using various metrics Direct instrumentation (Interval events measure exclusive or inclusive duration) Indirect instrumentation (Sampling measures statement level contribution) Throttling and runtime control of low-level events that execute frequently Per-thread storage of performance data Interface with external packages (e.g. PAPI hw performance counter library) Analysis: Visualization of profiles and traces 3D visualization of profile data in paraprof or perfexplorer tools Trace conversion & display in external visualizers (Vampir, Jumpshot, ParaVer) 8
9 Direct Observation Events Interval events (begin/end events) Measures exclusive & inclusive durations between events Metrics monotonically increase Example: Wall-clock timer Atomic events (trigger with data value) Used to capture performance data state Shows extent of variation of triggered values (min/max/mean) Example: heap memory consumed at a particular point Code events Routines, classes, templates Statement-level blocks, loops Example: for-loop begin/end 9
10 Interval and Atomic Events in TAU Interval events show duration Atomic events (triggered with value) show extent of variation (min/max/mean) % export TAU_CALLPATH_DEPTH=0 % export TAU_TRACK_HEAP=1 10
11 Context Events with Callpath % export TAU_CALLPATH_DEPTH=2 % export TAU_TRACK_HEAP=1 Callpath shown on context events 11
12 Direct Instrumentation Options in TAU Source Code Instrumentation Automatic instrumentation using pre-processor based on static analysis of source code (PDT), creating an instrumented copy Compiler generates instrumented object code Manual instrumentation Library Level Instrumentation Statically or dynamically linked wrapper libraries MPI, I/O, memory, etc. Wrapping external libraries where source is not available Runtime pre-loading and interception of library calls Binary Code instrumentation Rewrite the binary, runtime instrumentation Virtual Machine, Interpreter, OS level instrumentation 12
13 Automatic Instrumentation Use TAU s compiler wrappers Simply replace CXX with tau_cxx.sh, etc. Automatically instruments source code, links with TAU libraries. Use tau_cc.sh for C, tau_f90.sh for Fortran, tau_upc.sh for UPC, etc. Before CXX = mpicxx F90 = mpif90 CXXFLAGS = LIBS = -lm OBJS = f1.o f2.o f3.o fn.o app: $(OBJS) $(CXX) $(LDFLAGS) $(OBJS) -o $@ $(LIBS).cpp.o: $(CXX) $(CXXFLAGS) -c $< After CXX = tau_cxx.sh F90 = tau_f90.sh CXXFLAGS = LIBS = -lm OBJS = f1.o f2.o f3.o fn.o app: $(OBJS) $(CXX) $(LDFLAGS) $(OBJS) -o $@ $(LIBS).cpp.o: $(CXX) $(CXXFLAGS) -c $< 13 13
14 Binary Rewriting Instrumentation Support for Intel, PGI, and GNU compilers Specify a list of routines to instrument Specify the TAU measurement library to be injected DyninstAPI: % tau_run T [tags] a.out o a.inst MAQAO: % tau_rewrite T [tags] a.out o a.inst Pebil: % tau_pebil_rewrite T [tags] a.out \ o a.inst Execute the application to get measurement data: % mpiexec./a.inst 14
15 Three Instrumentation Techniques for Wrapping External Libraries Pre-processor based substitution by re-defining a call (e.g., read) Tool defined header file with same name <unistd.h> takes precedence Header redefines a routine as a different routine using macros Substitution: read() substituted by preprocessor as tau_read() at callsite Preloading a library at runtime Library preloaded (LD_PRELOAD env var in Linux) in the address space of executing application intercepts calls from a given library Tool s wrapper library defines read(), gets address of global read() symbol (dlsym), internally calls timing calls around call to global read Linker based substitution Wrapper library defines wrap_read which calls real_read and linker is passed -Wl,-wrap,read to substitute all references to read from application s object code with the wrap_read defined by the tool 15

16 Performance Analysis 16

17 ParaProf 3D Profile Browser 17

18 ParaProf 3D Profile Browser 18

19 Communication Matrix Display Goal: What is the volume of inter-process communication? Along which calling path? 19
 distributed relative to solver")
20 NAS BT Flat Profile Application routine names reflect phase semantics How is MPI_Wait() distributed relative to solver direction? 20


21 NAS BT Phase Profile Main phase shows nested phases and immediate events 21 21

22 Derived Metrics Help Identify Potential Bottlenecks Low MFLOPS in loops? 22
23 Phase Profiling of HW Counters GTC particle-in-cell simulation of fusion turbulence Phases assigned to iterations Poor temporal locality for one important data Automatically generated by PE2 python script increasing phase execution time decreasing flops rate declining cache performance 23 23
24 Using TAU: Simplest Case Uninstrumented code: % mpirun.lsf./a.out With TAU: % module load workshop tau % mpirun.lsf tau_exec./a.out % paraprof Come to the tutorial Thursday and Friday! 24
25 Download TAU from U. Oregon hdp://tau.uoregon.edu hdp:// [LiveDVD] Free download, open source, BSD license 25

")


")


26 Support Acknowledgments US Department of Energy (DOE) Office of Science contracts SciDAC, LBL contracts LLNL-LANL-SNL ASC/NNSA contract Battelle, PNNL contract ANL, ORNL contract Department of Defense (DoD) PETTT, HPCMP National Science Foundation (NSF) Glassbox, SI-2 University of Tennessee, Knoxville T.U. Dresden, GWT Juelich Supercomputing Center And a special thanks to UCAR! 26
Scalability Improvements in the TAU Performance System for Extreme Scale
 Scalability Improvements in the TAU Performance System for Extreme Scale Sameer Shende Director, Performance Research Laboratory, University of Oregon TGCC, CEA / DAM Île de France Bruyères- le- Châtel,
TAU: Performance Measurement Technology
 TAU: Performance Measurement Technology Performance Research Lab University of Oregon Allen Malony, Sameer Shende, Kevin Huck {malony, sameer, khuck} @cs.uoregon.edu P R L Performance Research Lab TAU
TAU Performance System. Sameer Shende Performance Research Lab, University of Oregon
 TAU Performance System Sameer Shende Performance Research Lab, University of Oregon http://tau.uoregon.edu TAU Performance System (http://tau.uoregon.edu) Parallel performance framework and toolkit Supports
Profile Data Mining with PerfExplorer. Sameer Shende Performance Reseaerch Lab, University of Oregon
 Profile Data Mining with PerfExplorer Sameer Shende Performance Reseaerch Lab, University of Oregon http://tau.uoregon.edu TAU Analysis TAUdb: Performance Data Mgmt. Framework 3 Using TAUdb Configure TAUdb
Performance Evalua/on using TAU Performance System for Scien/fic So:ware
 Performance Evalua/on using TAU Performance System for Scien/fic So:ware Sameer Shende and Allen D. Malony University of Oregon WSSSPE4 h5p://tau.uoregon.edu TAU Performance System Tuning and Analysis
Performance Analysis of Parallel Scientific Applications In Eclipse
 Performance Analysis of Parallel Scientific Applications In Eclipse EclipseCon 2015 Wyatt Spear, University of Oregon wspear@cs.uoregon.edu Supercomputing Big systems solving big problems Performance gains
Profiling with TAU. Le Yan. 6/6/2012 LONI Parallel Programming Workshop
 Profiling with TAU Le Yan 6/6/2012 LONI Parallel Programming Workshop 2012 1 Three Steps of Code Development Debugging Make sure the code runs and yields correct results Profiling Analyze the code to identify
Profiling with TAU. Le Yan. User Services LSU 2/15/2012
 Profiling with TAU Le Yan User Services HPC @ LSU Feb 13-16, 2012 1 Three Steps of Code Development Debugging Make sure the code runs and yields correct results Profiling Analyze the code to identify performance
Parallel Performance Tools
 Parallel Performance Tools Parallel Computing CIS 410/510 Department of Computer and Information Science Performance and Debugging Tools Performance Measurement and Analysis: Open SpeedShop HPCToolkit
TAU Performance System Hands on session
 TAU Performance System Hands on session Sameer Shende sameer@cs.uoregon.edu University of Oregon http://tau.uoregon.edu Copy the workshop tarball! Setup preferred program environment compilers! Default
TAU PERFORMANCE SYSTEM
 TAU PERFORMANCE SYSTEM Sameer Shende Chee Wai Lee, Wyatt Spear, Scott Biersdorff, Suzanne Millstein Performance Research Lab Allen D. Malony, Nick Chaimov, William Voorhees Department of Computer and Information
Scalable, Automated Parallel Performance Analysis with TAU, PerfDMF and PerfExplorer
 Scalable, Automated Parallel Performance Analysis with TAU, PerfDMF and PerfExplorer Kevin A. Huck, Allen D. Malony, Sameer Shende, Alan Morris khuck, malony, sameer, amorris@cs.uoregon.edu http://www.cs.uoregon.edu/research/tau
Integrated Tool Capabilities for Performance Instrumentation and Measurement
 Integrated Tool Capabilities for Performance Instrumentation and Measurement Sameer Shende, Allen Malony Department of Computer and Information Science University of Oregon sameer@cs.uoregon.edu, malony@cs.uoregon.edu
TAU 2.19 Quick Reference
 What is TAU? The TAU Performance System is a portable profiling and tracing toolkit for performance analysis of parallel programs written in Fortran, C, C++, Java, Python. It comprises 3 main units: Instrumentation,
Workload Characterization using the TAU Performance System
 Workload Characterization using the TAU Performance System Sameer Shende, Allen D. Malony, and Alan Morris Performance Research Laboratory, Department of Computer and Information Science University of
Improving Application Performance Using the TAU Performance System
 Improving Application Performance Using the TAU Performance System Wyatt Spear wspear@cs.uoregon.edu University of Oregon. April 9, 2013, CG1, NCAR, UCAR Download slides from: http://nic.uoregon.edu/~wspear/tau_sea14_tutorial.pdf
Performance Tools. Tulin Kaman. Department of Applied Mathematics and Statistics
 Performance Tools Tulin Kaman Department of Applied Mathematics and Statistics Stony Brook/BNL New York Center for Computational Science tkaman@ams.sunysb.edu Aug 23, 2012 Do you have information on exactly
TAU PERFORMANCE SYSTEM
 TAU PERFORMANCE SYSTEM Sameer Shende Kevin Huck, Wyatt Spear, Scott Biersdorff Performance Research Lab Allen D. Malony, Nick Chaimov, David Poliakoff, David Ozog Department of Computer and Information
Score-P A Joint Performance Measurement Run-Time Infrastructure for Periscope, Scalasca, TAU, and Vampir
 Score-P A Joint Performance Measurement Run-Time Infrastructure for Periscope, Scalasca, TAU, and Vampir VI-HPS Team Score-P: Specialized Measurements and Analyses Mastering build systems Hooking up the
VIRTUAL INSTITUTE HIGH PRODUCTIVITY SUPERCOMPUTING. BSC Tools Hands-On. Germán Llort, Judit Giménez. Barcelona Supercomputing Center
 BSC Tools Hands-On Germán Llort, Judit Giménez Barcelona Supercomputing Center 2 VIRTUAL INSTITUTE HIGH PRODUCTIVITY SUPERCOMPUTING Getting a trace with Extrae Extrae features Platforms Intel, Cray, BlueGene,
TAUdb: PerfDMF Refactored
 TAUdb: PerfDMF Refactored Kevin Huck, Suzanne Millstein, Allen D. Malony and Sameer Shende Department of Computer and Information Science University of Oregon PerfDMF Overview Performance Data Management
Introduction to Parallel Performance Engineering
 Introduction to Parallel Performance Engineering Markus Geimer, Brian Wylie Jülich Supercomputing Centre (with content used with permission from tutorials by Bernd Mohr/JSC and Luiz DeRose/Cray) Performance:
MPI Performance Engineering through the Integration of MVAPICH and TAU
 MPI Performance Engineering through the Integration of MVAPICH and TAU Allen D. Malony Department of Computer and Information Science University of Oregon Acknowledgement Research work presented in this
Tau Introduction. Lars Koesterke (& Kent Milfeld, Sameer Shende) Cornell University Ithaca, NY. March 13, 2009
 Cornell University Ithaca, NY. March 13, 2009") Tau Introduction Lars Koesterke (& Kent Milfeld, Sameer Shende) Cornell University Ithaca, NY March 13, 2009 General Outline Measurements Instrumentation & Control Example: matmult Profiling and Tracing
Tau Introduction Lars Koesterke (& Kent Milfeld, Sameer Shende) Cornell University Ithaca, NY March 13, 2009 General Outline Measurements Instrumentation & Control Example: matmult Profiling and Tracing
VAMPIR & VAMPIRTRACE INTRODUCTION AND OVERVIEW
 VAMPIR & VAMPIRTRACE INTRODUCTION AND OVERVIEW 8th VI-HPS Tuning Workshop at RWTH Aachen September, 2011 Tobias Hilbrich and Joachim Protze Slides by: Andreas Knüpfer, Jens Doleschal, ZIH, Technische Universität
Profiling and Debugging Tools. Lars Koesterke University of Porto, Portugal May 28-29, 2009
 Profiling and Debugging Tools Lars Koesterke University of Porto, Portugal May 28-29, 2009 Outline General (Analysis Tools) Listings & Reports Timers Profilers (gprof, tprof, Tau) Hardware performance
BSC Tools Hands-On. Judit Giménez, Lau Mercadal Barcelona Supercomputing Center
 BSC Tools Hands-On Judit Giménez, Lau Mercadal (lau.mercadal@bsc.es) Barcelona Supercomputing Center 2 VIRTUAL INSTITUTE HIGH PRODUCTIVITY SUPERCOMPUTING Extrae Extrae features Parallel programming models
Performance analysis basics
 Performance analysis basics Christian Iwainsky Iwainsky@rz.rwth-aachen.de 25.3.2010 1 Overview 1. Motivation 2. Performance analysis basics 3. Measurement Techniques 2 Why bother with performance analysis
Profiling and Debugging Tools. Outline
 Profiling and Debugging Tools Karl W. Schulz Texas Advanced Computing Center The University of Texas at Austin UT/Portugal Summer Institute Training Coimbra, Portugal July 17, 2008 Outline General (Analysis
The TAU Parallel Performance System
 The TAU Parallel Performance System Sameer S. Shende and Allen D. Malony 1 Submitted to Intl. J. High Performance Computing Applications, ACTS Collection Special Issue 1 Department of Computer and Information
Introduction to Performance Engineering
 Introduction to Performance Engineering Markus Geimer Jülich Supercomputing Centre (with content used with permission from tutorials by Bernd Mohr/JSC and Luiz DeRose/Cray) Performance: an old problem
Debugging CUDA Applications with Allinea DDT. Ian Lumb Sr. Systems Engineer, Allinea Software Inc.
 Debugging CUDA Applications with Allinea DDT Ian Lumb Sr. Systems Engineer, Allinea Software Inc. ilumb@allinea.com GTC 2013, San Jose, March 20, 2013 Embracing GPUs GPUs a rival to traditional processors
[Scalasca] Tool Integrations
![[Scalasca] Tool Integrations](/thumbs/95/125562042.jpg "[Scalasca] Tool Integrations") Mitglied der Helmholtz-Gemeinschaft [Scalasca] Tool Integrations Aug 2011 Bernd Mohr CScADS Performance Tools Workshop Lake Tahoe Contents Current integration of various direct measurement tools Paraver
Mitglied der Helmholtz-Gemeinschaft [Scalasca] Tool Integrations Aug 2011 Bernd Mohr CScADS Performance Tools Workshop Lake Tahoe Contents Current integration of various direct measurement tools Paraver
Score-P. SC 14: Hands-on Practical Hybrid Parallel Application Performance Engineering 1
 Score-P SC 14: Hands-on Practical Hybrid Parallel Application Performance Engineering 1 Score-P Functionality Score-P is a joint instrumentation and measurement system for a number of PA tools. Provide
Automatic trace analysis with the Scalasca Trace Tools
 Automatic trace analysis with the Scalasca Trace Tools Ilya Zhukov Jülich Supercomputing Centre Property Automatic trace analysis Idea Automatic search for patterns of inefficient behaviour Classification
IBM High Performance Computing Toolkit
 IBM High Performance Computing Toolkit Pidad D'Souza (pidsouza@in.ibm.com) IBM, India Software Labs Top 500 : Application areas (November 2011) Systems Performance Source : http://www.top500.org/charts/list/34/apparea
TAU Parallel Performance System. DOD UGC 2004 Tutorial. Part 1: TAU Overview and Architecture
 TAU Parallel Performance System DOD UGC 2004 Tutorial Part 1: TAU Overview and Architecture Tutorial Outline Part 1 TAU Overview and Architecture Introduction Performance technology Complexity challenges
Isolating Runtime Faults with Callstack Debugging using TAU
 Isolating Runtime Faults with Callstack Debugging using TAU Sameer Shende, Allen D. Malony, John C. Linford ParaTools, Inc. Eugene, OR {Sameer, malony, jlinford}@paratools.com Andrew Wissink U.S. Army
ARCHER Single Node Optimisation
 ARCHER Single Node Optimisation Profiling Slides contributed by Cray and EPCC What is profiling? Analysing your code to find out the proportion of execution time spent in different routines. Essential
A Survey on Performance Tools for OpenMP
 A Survey on Performance Tools for OpenMP Mubrak S. Mohsen, Rosni Abdullah, and Yong M. Teo Abstract Advances in processors architecture, such as multicore, increase the size of complexity of parallel computer
MPI Performance Tools
 Physics 244 31 May 2012 Outline 1 Introduction 2 Timing functions: MPI Wtime,etime,gettimeofday 3 Profiling tools time: gprof,tau hardware counters: PAPI,PerfSuite,TAU MPI communication: IPM,TAU 4 MPI
Performance Tools Hands-On. PATC Apr/2016.
 Performance Tools Hands-On PATC Apr/2016 tools@bsc.es Accounts Users: nct010xx Password: f.23s.nct.0xx XX = [ 01 60 ] 2 Extrae features Parallel programming models MPI, OpenMP, pthreads, OmpSs, CUDA, OpenCL,
Performance Engineering using MVAPICH and TAU Sameer Shende University of Oregon
 Performance Engineering using MVAPICH and TAU Sameer Shende University of Oregon SC18 Talk The Ohio State University Booth (#4404) Wednesday, November 14, 2018, 2pm 2:30pm http://tau.uoregon.edu/tau_osu_sc18.pdf
Profiling Non-numeric OpenSHMEM Applications with the TAU Performance System
 Profiling Non-numeric OpenSHMEM Applications with the TAU Performance System John Linford 2,TylerA.Simon 1,2, Sameer Shende 2,3,andAllenD.Malony 2,3 1 University of Maryland Baltimore County 2 ParaTools
TAU by example - Mpich
 TAU by example From Mpich TAU (Tuning and Analysis Utilities) is a toolkit for profiling and tracing parallel programs written in C, C++, Fortran and others. It supports dynamic (librarybased), compiler
Developing Scientific Applications with the IBM Parallel Environment Developer Edition
 Developing Scientific Applications with the IBM Parallel Environment Developer Edition Greg Watson, IBM grw@us.ibm.com Christoph Pospiech, IBM christoph.pospiech@de.ibm.com ScicomP 13 May 2013 Portions
Profiling and debugging. Carlos Rosales September 18 th 2009 Texas Advanced Computing Center The University of Texas at Austin
 Profiling and debugging Carlos Rosales carlos@tacc.utexas.edu September 18 th 2009 Texas Advanced Computing Center The University of Texas at Austin Outline Debugging Profiling GDB DDT Basic use Attaching
Detection and Analysis of Iterative Behavior in Parallel Applications
 Detection and Analysis of Iterative Behavior in Parallel Applications Karl Fürlinger and Shirley Moore Innovative Computing Laboratory, Department of Electrical Engineering and Computer Science, University
VIRTUAL INSTITUTE HIGH PRODUCTIVITY SUPERCOMPUTING. Tools Guide October 2017
 VIRTUAL INSTITUTE HIGH PRODUCTIVITY SUPERCOMPUTING Tools Guide October 2017 Introduction The mission of the Virtual Institute - High Productivity Supercomputing (VI-HPS 1 ) is to improve the quality and
UPC Performance Analysis Tool: Status and Plans
 UPC Performance Analysis Tool: Status and Plans Professor Alan D. George, Principal Investigator Mr. Hung-Hsun Su, Sr. Research Assistant Mr. Adam Leko, Sr. Research Assistant Mr. Bryan Golden, Research
AutoTune Workshop. Michael Gerndt Technische Universität München
 AutoTune Workshop Michael Gerndt Technische Universität München AutoTune Project Automatic Online Tuning of HPC Applications High PERFORMANCE Computing HPC application developers Compute centers: Energy
TAU Performance Toolkit (WOMPAT 2004 OpenMP Lab)
") TAU Performance Toolkit () Sameer Shende, Allen D. Malony University of Oregon {sameer, malony}@cs.uoregon.edu Research Motivation Tools for performance problem solving Empirical-based performance optimization
TAU Performance Toolkit () Sameer Shende, Allen D. Malony University of Oregon {sameer, malony}@cs.uoregon.edu Research Motivation Tools for performance problem solving Empirical-based performance optimization
Improving the Scalability of Performance Evaluation Tools
 Improving the Scalability of Performance Evaluation Tools Sameer Suresh Shende, Allen D. Malony, and Alan Morris Performance Research Laboratory Department of Computer and Information Science University
OpenACC/CUDA/OpenMP... 1 Languages and Libraries... 3 Multi-GPU support... 4 How OpenACC Works... 4
 OpenACC Course Class #1 Q&A Contents OpenACC/CUDA/OpenMP... 1 Languages and Libraries... 3 Multi-GPU support... 4 How OpenACC Works... 4 OpenACC/CUDA/OpenMP Q: Is OpenACC an NVIDIA standard or is it accepted
Scalable, Automated Performance Analysis with TAU and PerfExplorer
 Scalable, Automated Performance Analysis with TAU and PerfExplorer Kevin A. Huck, Allen D. Malony, Sameer Shende and Alan Morris Performance Research Laboratory Computer and Information Science Department
EZTrace upcoming features
 EZTrace 1.0 + upcoming features François Trahay francois.trahay@telecom-sudparis.eu 2015-01-08 Context Hardware is more and more complex NUMA, hierarchical caches, GPU,... Software is more and more complex
Parametric Studies in Eclipse with TAU and PerfExplorer
 Parametric Studies in Eclipse with TAU and PerfExplorer Kevin A. Huck, Wyatt Spear, Allen D. Malony, Sameer Shende and Alan Morris Performance Research Laboratory Department of Computer and Information
The PAPI Cross-Platform Interface to Hardware Performance Counters
 The PAPI Cross-Platform Interface to Hardware Performance Counters Kevin London, Shirley Moore, Philip Mucci, and Keith Seymour University of Tennessee-Knoxville {london, shirley, mucci, seymour}@cs.utk.edu
The Titan Tools Experience
 The Titan Tools Experience Michael J. Brim, Ph.D. Computer Science Research, CSMD/NCCS Petascale Tools Workshop 213 Madison, WI July 15, 213 Overview of Titan Cray XK7 18,688+ compute nodes 16-core AMD
Performance Analysis of MPI Programs with Vampir and Vampirtrace Bernd Mohr
 Performance Analysis of MPI Programs with Vampir and Vampirtrace Bernd Mohr Research Centre Juelich (FZJ) John von Neumann Institute of Computing (NIC) Central Institute for Applied Mathematics (ZAM) 52425
Scalasca support for Intel Xeon Phi. Brian Wylie & Wolfgang Frings Jülich Supercomputing Centre Forschungszentrum Jülich, Germany
 Scalasca support for Intel Xeon Phi Brian Wylie & Wolfgang Frings Jülich Supercomputing Centre Forschungszentrum Jülich, Germany Overview Scalasca performance analysis toolset support for MPI & OpenMP
Introduction to Parallel and Distributed Computing. Linh B. Ngo CPSC 3620
 Introduction to Parallel and Distributed Computing Linh B. Ngo CPSC 3620 Overview: What is Parallel Computing To be run using multiple processors A problem is broken into discrete parts that can be solved
INTRODUCTION TO OPENACC. Analyzing and Parallelizing with OpenACC, Feb 22, 2017
 INTRODUCTION TO OPENACC Analyzing and Parallelizing with OpenACC, Feb 22, 2017 Objective: Enable you to to accelerate your applications with OpenACC. 2 Today s Objectives Understand what OpenACC is and
Technology for a better society. hetcomp.com
 Technology for a better society hetcomp.com 1 J. Seland, C. Dyken, T. R. Hagen, A. R. Brodtkorb, J. Hjelmervik,E Bjønnes GPU Computing USIT Course Week 16th November 2011 hetcomp.com 2 9:30 10:15 Introduction
Cray RS Programming Environment
 Cray RS Programming Environment Gail Alverson Cray Inc. Cray Proprietary Red Storm Red Storm is a supercomputer system leveraging over 10,000 AMD Opteron processors connected by an innovative high speed,
Cray Performance Tools Enhancements for Next Generation Systems Heidi Poxon
 Cray Performance Tools Enhancements for Next Generation Systems Heidi Poxon Agenda Cray Performance Tools Overview Recent Enhancements Support for Cray systems with KNL 2 Cray Performance Analysis Tools
Jackson Marusarz Intel Corporation
 Jackson Marusarz Intel Corporation Intel VTune Amplifier Quick Introduction Get the Data You Need Hotspot (Statistical call tree), Call counts (Statistical) Thread Profiling Concurrency and Lock & Waits
Addressing the Increasing Challenges of Debugging on Accelerated HPC Systems. Ed Hinkel Senior Sales Engineer
 Addressing the Increasing Challenges of Debugging on Accelerated HPC Systems Ed Hinkel Senior Sales Engineer Agenda Overview - Rogue Wave & TotalView GPU Debugging with TotalView Nvdia CUDA Intel Phi 2
TAU PERFORMANCE SYSTEM
 rhtjhtyhy Please download slides from: http://tau.uoregon.edu/ecp17.pdf TAU PERFORMANCE SYSTEM SAMEER SHENDE Director, Performance Research Lab, University of Oregon ParaTools, Inc. ECP Webinar: November
TAU Potpourri and Working with Open Components, Interfaces, and Environments
 and Working with Open Components, Interfaces, and Environments Scott Biersdorff, Chee Wai Lee, Allen D. Malony, Sameer Shende, Wyatt Spear {scottb,cheelee,malony,shende,wspear}@cs.uoregon.edu Dept. Computer
PLASMA TAU Guide. Parallel Linear Algebra Software for Multicore Architectures Version 2.0
 PLASMA TAU Guide Parallel Linear Algebra Software for Multicore Architectures Version 2.0 Electrical Engineering and Computer Science University of Tennessee Electrical Engineering and Computer Science
Illinois Proposal Considerations Greg Bauer
 - 2016 Greg Bauer Support model Blue Waters provides traditional Partner Consulting as part of its User Services. Standard service requests for assistance with porting, debugging, allocation issues, and
The Arm Technology Ecosystem: Current Products and Future Outlook
 The Arm Technology Ecosystem: Current Products and Future Outlook Dan Ernst, PhD Advanced Technology Cray, Inc. Why is an Ecosystem Important? An Ecosystem is a collection of common material Developed
The Eclipse Parallel Tools Platform
 May 1, 2012 Toward an Integrated Development Environment for Improved Software Engineering on Crays Agenda 1. What is the Eclipse Parallel Tools Platform (PTP) 2. Tour of features available in Eclipse/PTP
PROGRAMMING MODEL EXAMPLES
 ( Cray Inc 2015) PROGRAMMING MODEL EXAMPLES DEMONSTRATION EXAMPLES OF VARIOUS PROGRAMMING MODELS OVERVIEW Building an application to use multiple processors (cores, cpus, nodes) can be done in various
Experiences and Lessons Learned with a Portable Interface to Hardware Performance Counters
 Experiences and Lessons Learned with a Portable Interface to Hardware Performance Counters Jack Dongarra Kevin London Shirley Moore Philip Mucci Daniel Terpstra Haihang You Min Zhou University of Tennessee
SCORE-P USER MANUAL. 4.0 (revision 13505) Wed May :20:42
 Wed May :20:42") SCORE-P USER MANUAL 4.0 (revision 13505) Wed May 2 2018 10:20:42 SCORE-P LICENSE AGREEMENT COPYRIGHT 2009-2014, RWTH Aachen University, Germany COPYRIGHT 2009-2013, Gesellschaft für numerische Simulation
SCORE-P USER MANUAL 4.0 (revision 13505) Wed May 2 2018 10:20:42 SCORE-P LICENSE AGREEMENT COPYRIGHT 2009-2014, RWTH Aachen University, Germany COPYRIGHT 2009-2013, Gesellschaft für numerische Simulation
The Cray Programming Environment. An Introduction
 The Cray Programming Environment An Introduction Vision Cray systems are designed to be High Productivity as well as High Performance Computers The Cray Programming Environment (PE) provides a simple consistent
OpenACC Course. Office Hour #2 Q&A
 OpenACC Course Office Hour #2 Q&A Q1: How many threads does each GPU core have? A: GPU cores execute arithmetic instructions. Each core can execute one single precision floating point instruction per cycle
Introduction to Performance Tuning & Optimization Tools
 Introduction to Performance Tuning & Optimization Tools a[i] a[i+1] + a[i+2] a[i+3] b[i] b[i+1] b[i+2] b[i+3] = a[i]+b[i] a[i+1]+b[i+1] a[i+2]+b[i+2] a[i+3]+b[i+3] Ian A. Cosden, Ph.D. Manager, HPC Software
A General Discussion on! Parallelism!
 Lecture 2! A General Discussion on! Parallelism! John Cavazos! Dept of Computer & Information Sciences! University of Delaware! www.cis.udel.edu/~cavazos/cisc879! Lecture 2: Overview Flynn s Taxonomy of
Performance database technology for SciDAC applications
 Performance database technology for SciDAC applications D Gunter 1, K Huck 2, K Karavanic 3, J May 4, A Malony 2, K Mohror 3, S Moore 5, A Morris 2, S Shende 2, V Taylor 6, X Wu 6, and Y Zhang 7 1 Lawrence
Interactive Performance Analysis with Vampir UCAR Software Engineering Assembly in Boulder/CO,
 Interactive Performance Analysis with Vampir UCAR Software Engineering Assembly in Boulder/CO, 2013-04-03 Andreas Knüpfer, Thomas William TU Dresden, Germany Overview Introduction Vampir displays GPGPU
An Empirical Study of Computation-Intensive Loops for Identifying and Classifying Loop Kernels
 An Empirical Study of Computation-Intensive Loops for Identifying and Classifying Loop Kernels Masatomo Hashimoto Masaaki Terai Toshiyuki Maeda Kazuo Minami 26/04/2017 ICPE2017 1 Agenda Performance engineering
A configurable binary instrumenter
 Mitglied der Helmholtz-Gemeinschaft A configurable binary instrumenter making use of heuristics to select relevant instrumentation points 12. April 2010 Jan Mussler j.mussler@fz-juelich.de Presentation
KNL tools. Dr. Fabio Baruffa
 KNL tools Dr. Fabio Baruffa fabio.baruffa@lrz.de 2 Which tool do I use? A roadmap to optimization We will focus on tools developed by Intel, available to users of the LRZ systems. Again, we will skip the
On the scalability of tracing mechanisms 1
 On the scalability of tracing mechanisms 1 Felix Freitag, Jordi Caubet, Jesus Labarta Departament d Arquitectura de Computadors (DAC) European Center for Parallelism of Barcelona (CEPBA) Universitat Politècnica
Debugging, benchmarking, tuning i.e. software development tools. Martin Čuma Center for High Performance Computing University of Utah
 Debugging, benchmarking, tuning i.e. software development tools Martin Čuma Center for High Performance Computing University of Utah m.cuma@utah.edu SW development tools Development environments Compilers
Characterizing the I/O Behavior of Scientific Applications on the Cray XT
 Characterizing the I/O Behavior of Scientific Applications on the Cray XT Philip C. Roth Computer Science and Mathematics Division Oak Ridge National Laboratory Oak Ridge, TN 37831 rothpc@ornl.gov ABSTRACT
Capturing and Analyzing the Execution Control Flow of OpenMP Applications
 Int J Parallel Prog (2009) 37:266 276 DOI 10.1007/s10766-009-0100-2 Capturing and Analyzing the Execution Control Flow of OpenMP Applications Karl Fürlinger Shirley Moore Received: 9 March 2009 / Accepted:
Profile Data Mining with PerfExplorer. Sameer Shende Performance Reseaerch Lab, University of Oregon
 Profile Data Mining with PerfExplorer Sameer Shende Performance Reseaerch Lab, University of Oregon http://tau.uoregon.edu TAU Analysis 11th VI-HPS Tuning Workshop, 22-25 April 2013, MdS, Saclay PerfDMF:
Performance and Memory Evaluation Using TAU
 Performance and Memory Evaluation Using TAU Sameer Shende, Allen D. Malony, Alan Morris Department of Computer and Information Science University of Oregon, Eugene, OR, USA {sameer,malony,amorris}@cs.uoregon.edu
Titan - Early Experience with the Titan System at Oak Ridge National Laboratory
 Office of Science Titan - Early Experience with the Titan System at Oak Ridge National Laboratory Buddy Bland Project Director Oak Ridge Leadership Computing Facility November 13, 2012 ORNL s Titan Hybrid
Using the Eclipse Parallel Tools Platform in Support of Earth Sciences High Performance Computing
 Using the Eclipse Parallel Tools Platform in Support of Earth Sciences High Performance Computing Jay Alameda National Center for Supercomputing Applications, University of Illinois at Urbana-Champaign
Intel profiling tools and roofline model. Dr. Luigi Iapichino
 Intel profiling tools and roofline model Dr. Luigi Iapichino luigi.iapichino@lrz.de Which tool do I use in my project? A roadmap to optimization (and to the next hour) We will focus on tools developed
Eclipse-PTP: An Integrated Environment for the Development of Parallel Applications
 Eclipse-PTP: An Integrated Environment for the Development of Parallel Applications Greg Watson (grw@us.ibm.com) Craig Rasmussen (rasmusen@lanl.gov) Beth Tibbitts (tibbitts@us.ibm.com) Parallel Tools Workshop,
Analyzing the Performance of IWAVE on a Cluster using HPCToolkit
 Analyzing the Performance of IWAVE on a Cluster using HPCToolkit John Mellor-Crummey and Laksono Adhianto Department of Computer Science Rice University {johnmc,laksono}@rice.edu TRIP Meeting March 30,
Automatic Tuning of HPC Applications with Periscope. Michael Gerndt, Michael Firbach, Isaias Compres Technische Universität München
 Automatic Tuning of HPC Applications with Periscope Michael Gerndt, Michael Firbach, Isaias Compres Technische Universität München Agenda 15:00 15:30 Introduction to the Periscope Tuning Framework (PTF)
Software Ecosystem for Arm-based HPC
 Software Ecosystem for Arm-based HPC CUG 2018 - Stockholm Florent.Lebeau@arm.com Ecosystem for HPC List of components needed: Linux OS availability Compilers Libraries Job schedulers Debuggers Profilers
Understanding Dynamic Parallelism
 Understanding Dynamic Parallelism Know your code and know yourself Presenter: Mark O Connor, VP Product Management Agenda Introduction and Background Fixing a Dynamic Parallelism Bug Understanding Dynamic