Galaxie Report Editor
|
|
|
- Garry Buck Peters
- 6 years ago
- Views:
Transcription

1 Varian, Inc Mitchell Drive Walnut Creek, CA /USA Galaxie Report Editor User s Guide Varian, Inc Printed in U.S.A : Rev 6
2
3 Galaxie Report Editor i
4 Table of Contents Introduction... 1 Application Details... 3 Working Environment... 3 Main Menu... 4 Toolbars... 6 Browser... 8 Building the Report Style... 9 Object Properties Graphic Object Text Object Label Object Table Object Chromatogram Object Peak Results Object Group Results Object Method Object Calibration Report Object Suitability Tests Object Electronic Signature Object The 3D Chromatogram Object The Library Search Object The Isoabsorbance Object The Peak Purity Object The Collection Log File Object Default Reports... 31
5 Galaxie Report Editor iii
6
7 Introduction Galaxie Report Editor enables you to generate, customize, and print reports from the Galaxie Chromatography Data System. Galaxie Reports may contain Galaxie Chromatography Data System objects, such as the chromatograms, the Peak Report table, any of the variables, etc. A Galaxie Report may also include Microsoft TM documents, such as images and labels. In Galaxie Report Editor, all the objects can be placed and sized inside pages as they will be printed. Galaxie Report Editor 1
8 :6
9 Application Details Working Environment The Galaxie Chromatography Data System Report Editor allows you to build customized reports. For regulatory compliance, a report corresponding to an unsaved data file is printed with a DATA NOT SAVED background. The Galaxie Report Editor graphical environment is composed of a main menu, toolbars, a browser, a working space, and a status bar. Galaxie Report Editor 3

10 Main Menu File Display Object Page Help Used to manage the report style files (open, close, save, print). Allows you to configure the zoom level, particularly the browser display. Allows you to insert an object and edit its properties. This menu enables you to define the page parameters. Enables access to the Help file and information about the Galaxie Report Editor version :6
11 File Menu New style Creates a new report style in Galaxie Report Editor. Open Opens an existing report style. Save Saves the current report style. Save as Saves the current report style under a different name. (Note that Save as will not allow you to overwrite an existing file.) Close Closes the current report style. Quit Exits Galaxie Report Editor. Display Menu Zoom in Zoom out Browser Zooms in on the report. Zooms out on the report. Used to show or hide the browser enabling you to see the contents of each page. Object Menu Insert Select Delete Copy Cut Paste Properties Inserts a Galaxie object or a standard object. The available Galaxie objects are a chromatogram, a peak or group result table, a method, a calibration report, a suitability tests, an electronic signature,.a 3D chromatogram, a library search, an isoabsorbance, a peak purity or a collection log file. The standard objects are a label, a graphic, a text (including Galaxie variables), or a table. The corresponding object is always added in the left top corner of the page. Refer to Building the Report Style to learn how to resize or modify the position of a selected object. Selects an object. Deletes the selected object. Copies the selected object. Cuts the selected object. Inserts the contents of the clipboard. Used to display and edit the properties of the selected object. Galaxie Report Editor 5
12 Page Menu New Page New page at the end Delete Page Page Break Next Page Previous Page First Page Last Page Creates a new page in the same report style. The new page is inserted before the active page. Creates a new page at the end of the report. Deletes the current page. Inserts a break between pages. Displays the next page. Displays the previous page. Displays the first page of the report. Displays the last page of the report. Help Menu Help content About Displays the on-line Help. Provides information about the Galaxie Report Editor. Toolbars Several toolbars can be accessed from the Display menu Pages Toolbar This toolbar is useful if several pages have been defined: Displays the first page of the report. Displays previous page of the report. Displays next page of the report. Displays the last page of the report. Adds a new page at the end of the report. Deletes the current page :6
13 Standard Toolbar Creates a new report style. Opens an existing report style. Saves the current report style. Closes the current report style. Saves the current report style under a different name. (Note that Save as will not allow you to overwrite an existing file) Uses to cut the selected objects Copies the selected object. Inserts the contents of the clipboard. Object Toolbar This toolbar allows you to add objects to the report style. The corresponding object is always added in the left top corner of the page. Refer to Building the Report Style to learn how to resize or modify the position of a selected object. Adds a label, for example the title of the report style, with a special display (colors, shadows, etc.). Inserts a text object. Inserts a graphic. Right-click on the graphic and select the image to be added in the report style. Adds a table which is created and completed by the user. Adds a chromatogram. Adds a Peak Report, i.e., a table of the peaks in the chromatogram. Adds a Group Report, i.e., a table of the groups in the chromatogram. Adds the Method to the report. Press the right mouse button to choose which properties you want to print. Galaxie Report Editor 7
14 Prints the Calibration Curve. Prints the Suitability Tests results. Prints the Electronic Signature. Prints the 3D chromatogram. Prints the Isoabsorbance view. Prints the Library Search results. Prints the peak purity results. Prints the Collection Log File. Displays the object properties. Deletes the selected object Display Toolbar Zooms in on the report. Zooms out on the report. Browser The browser is displayed on the left side of the screen and is divided into two parts. The first part (a table) shows properties of the selected objects (i.e., the object name, the location of this object in the page, a comment). Click on the Properties field to open the selected object properties. The second part gives a preview of all pages of the report style. Click on any page to display it in the Galaxie Report Editor :6
15 Building the Report Style To create a new report style from Galaxie, select the FILE / NEW / NEW REPORT STYLE menu: Galaxie Report Editor is opened, and a blank report is displayed. A report style is composed of several pages onto which objects (see below) are added. Each page is divided into a header area, a main area, and a footer area. The header and the footer are common and will be printed at the top and the bottom of all the pages. The header and the footer areas are delimited with a line. The size of the header and footer can be modified. Click on the line; the cursor appearance is modified. Drag the line to the desired location. To place objects in the header, the main area, or the footer, select the area with the mouse, then select the object from the toolbar or from the insert menu. The object is always added in the top left corner of the area. To move and resize the object you can: click on the object and drag it to the desired location click on the grey squares and drag the borders of the object modify its coordinates in the browser For each object, pop-up menus are available by clicking the right mouse button. These pop-up menus enable access to functions such as delete, copy, cut, paste, and properties. Galaxie Report Editor 9

16 Object Properties Once the object is added to the report, right-click on the object. A pop-up menu appears. Select PROPERTIES to configure the object. Graphic Object This object enables you to display a graphic in the bitmap format. It can be used to insert the company logo, for example. In the pop-up menu select PROPERTIES to configure the object. The following window appears: Press the Load button to select the image to display. A preview of the selected image is displayed. Check Stretch to adjust the image to the object size :6

17 Text Object This object enables you to enter text and variables in the report. A variable name is always preceded by the symbol $. You may configure the font style, size, and color. Use the buttons to modify the text alignment. Click on the Insert variables>> button to choose a type of variable. Three tabs are displayed: Page, Galaxie, and System. Select one of these tabs, then in the associated list, click on the variable you want to add. Galaxie Report Editor 11
18 The Page tab enables you to print the page number, the total page numbers, and the report-guide variable, which associates a unique number with each report. The Galaxie tab enables you to print the Galaxie Chromatography Data System variables. It is also possible to print the Archive number of the chromatogram, by adding the variable $ARCHIVERSION. The System tab enables you to print system variables such as the printing date and time, the computer s name, and the OS version. For example, if you type The name of the chromatogram is: and then you choose the variable CHROMATONAME, the name of the chromatogram will be printed after the words you typed. Label Object This object enables you to create and to insert a label, for example, title of the report. You can define the caption font style, size, and color. In the pop-up menu select PROPERTIES to configure the object. The following window appears: :6
 with the Insert variable>> button.")
19 In the Caption area, enter the words to be displayed, e.g., Analysis report. You can also insert a variable (as with the text object) with the Insert variable>> button. Click on the Font button to modify the font style, size, and color. Use the buttons to modify the text alignment. Galaxie Report Editor 13
.")
20 Table Object Adds a table. In the pop-up menu select PROPERTIES to configure the object. The following window appears: In the Table Editor Parameters tab, you can choose the table size and customize its display (grid style, thickness, cell spacing, and main appearance). You can also name the columns of the table. Select the Data tab to add data into the table :6

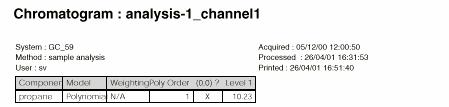
21 Chromatogram Object This object enables you to add a chromatogram to the report. In the pop-up menu select PROPERTIES to configure the object. The following window appears: Galaxie Report Editor 15

22 In the Format area, choose the chromatogram format configured in Galaxie (in the format section of the method). The chromatogram can be opened in Galaxie Chromatography Data System with one format and printed with another format. In the Splitting area, choose the number of sections in which to split the chromatogram :6
23 Example: 3 sections In the Orientation area, choose if the chromatograms are to be printed horizontally or vertically. In the Scaling area, you can modify both the time scale and the amplitude scale. Time Scale: The time range represents the limits of the chromatogram X axis. Full scale: The chromatogram is printed in maximum scale (from zero to the end of the acquisition). Custom: Select this option to specify manual limits to the chromatogram. When this option is selected, some edit boxes appear: Galaxie Report Editor 17
24 Peak # or Named peak: Select this option to print a peak only. User has to choose which peak to print by choosing either its name or its index. Working scale: Select this option to print the chromatogram in the scale defined in Galaxie Chromatography Data System This scale can be defined in the Quick Start windows (or in the acquisition area of the method), or after the acquisition in the working scale. Y Scale: This amplitude range is the limit of the chromatogram ordinates. Automatic: The chromatogram is printed with the acquisition scale. Custom: Select this option to manually specify the limits of the chromatogram amplitude. When this option is selected, the following edit boxes appear: % highest peak: Select this option to scale the chromatogram according to the height of one of the peaks (defined by its relative height). For example, if you choose to plot the chromatogram up to 200% of the second highest peak, the maximum Y value will be twice the height of the second highest peak. Named peak: Select this option to scale the chromatogram according to the height of one of the named peaks. For example if you choose to plot the chromatogram up to 200% of the peak :6
25 Butane, the maximum Y value will be twice the height of the peak Butane. A chromatogram preview allows you to view the chromatogram as it will be printed, according to the chosen options. Click on the Update button to take into account the options chosen in the fields of the chromatogram properties. Peak Results Object This object enables you to insert the peak results. You can customize the table (font style, size, and color) and select a specific format. The Peak Report contains all the peaks integrated into the chromatogram. (Select RESULTS / PEAK REPORT in the browser to display the Peak Report in Galaxie Chromatography Data System.) In the pop-up menu select PROPERTIES to configure the object. The following window appears: The Peak Table can be printed with a specific format. In the Galaxie Chromatography Data System it is possible to define formats in the method or in the peak table properties (see the Galaxie Chromatography Data System User s Guide). One of these formats can be applied to the printing. The Peak Table formats are saved with a specific name and a comment in the Galaxie Chromatography Data System. Select Galaxie Report Editor 19
. Group Results Object This object enables you to insert the group results.")
26 the corresponding name in the Format dropdown list, and the comment will appear. In the Peak Results properties you can modify the appearance of the table using the Font button. Note that the printed table can have a different format from the one displayed in Galaxie (Results). Group Results Object This object enables you to insert the group results. You can customize the table (font style, size, and color) and select a specific format. The Group Report is the table containing all the groups defined in the chromatogram. Select RESULTS/GROUP REPORT in the browser to display the Group Report in Galaxie. The group table can be configured in the same way as the peak table. In the pop-up menu select PROPERTIES to configure the object. The following window appears: Method Object This object enables you to insert the method :6

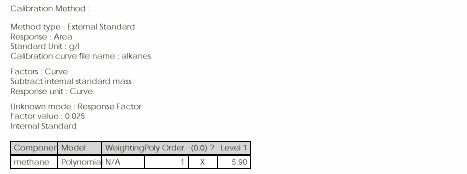
27 In the pop-up menu select PROPERTIES to configure the object. The following window appears: Check the parts of the method to print; uncheck the ones that you do not want to print. NOTES: The acquisition parameters printed are the ones entered at the acquisition time. If the chromatogram has been reprocessed with different parameters, then they will not be printed in this part. The latest ones are in the global variables available in a text or a label object. Calibration Report Object This object enables you to print the Calibration Report. Galaxie Report Editor 21
.")
28 In the pop-up menu select PROPERTIES to configure the object. The following window appears: Check the calibration parameters to print; uncheck the parameters you do not want to print. Component information: prints the mathematical model, the calibration curve equations, the regression coefficients, the weighting, and forcing through (0,0). Table: prints the calibration point tables displayed in the Calibration tab in Galaxie, the list of the calibration points, their origin, the acquisition date, the name of the user that added the point, etc. Curve: Prints the calibration curves. In the Fonts area, you can choose the fonts for the different areas of the Calibration object. General: name of the calibration curve. Calibration info: equation, correlation factors :6

29 Curve axis: curve axis names, graduations. Component name: name of the component. Table: font used for all table fields. In the Curve attributes field you can configure the style of the printed calibration curve displaying: type and size of the marker style, number of ticks in X and Y axis and location of the calibration curve on the page using the curve width bar. The curve is always placed on the right side of the page. Suitability Tests Object This object enables you to print the results of the suitability tests. The suitability tests are defined in the Method. In the pop-up menu select PROPERTIES to configure the object. The following window appears: You can define a Suitability Tests title in the dedicated field (check the title box) and define the font style, size, and color. Galaxie Report Editor 23

30 Electronic Signature Object This object enables you to print the electronic signature. In the pop-up menu select PROPERTIES to configure the object. The following window appears: You can define the font displayed in the table: Title Font for the title, Main Font for the content of the table. The 3D Chromatogram Object This object enables you to print the 3D chromatogram. In the pop-up menu select PROPERTIES to configure the object. The following window appears: :6

31 The appearance of the 3D chromatogram can be modified with the scroll bars. The scale of the X-axis can be changed by moving the slider on the horizontal scroll bar. The Y-axis scale is controlled by the slider on the vertical scroll bar. To change the Z-axis orientation (to rotate or tilt the 3D image), click on a corner of the image and drag it with the mouse until the desired orientation is obtained. Select the required response type from the drop down list. Four choices are available: Response: displays the 3D view with all the absorbance levels. Threshold up: displays all the absorbance levels lower than the limit value (defined in the following screen) with the same color. Galaxie Report Editor 25

32 Threshold down: displays all the absorbance levels higher than the limit value (defined in the following screen) with the same color. Threshold between: displays all the absorbance levels outside of the lower and upper limit values with a unique color. Click on the window: button to display the PDA 3D view properties :6

33 The appearance of the 3D object can be modified. The number of facets and the texture size can be modified in the Mesh-3D area. The color of the background and the labels can be chosen in the Color area. In the Palette area, the color palette can be chosen. The coloration can be dithered or banded (in this case, you can choose the number of bands. Choose also the Max Divider which emphasizes the little variations of the map when its values are increased The Library Search Object This object allows you to print the Library Search results. In the pop-up menu select Properties to configure the object. The following window appears: Galaxie Report Editor 27
 to print.")
34 In the Fonts area, you can define axis and peak name fonts, name of the matching components, and the information field associated with its spectrum. In the Curve Colors area, you can define the colors of the reference and library spectra. In the Printed Peaks area, you can choose which peak(s) to print. The different criteria allowing you to choose the peak to print are the time (Time range), the index (Peak number Range), the name (Peak names) and the named peaks (Remove Unknown peak). All peaks can be printed (Show all peaks) :6

35 In the Curve attributes area, you can define the size of the spectra. The Isoabsorbance Object This object allows you to print the isoabsorbance chromatogram. In the pop-up menu click on Properties. The following window appears: Choose the number of isolines to print and the axis font. The Peak Purity Object This object enables you to print the peak purity results. In the pop-up menu click on Properties. The following window appears: Galaxie Report Editor 29
, the index (Peak number Range), the name (Peak names), and the named peaks (Remove Unknown peak).")
36 Fonts: define the axis and the other items names fonts. Purity colors: colors indicating the purity level. Printed Peaks: choose which peak(s) to print. The different criteria allowing you to choose the peak to print are the time (Time range), the index (Peak number Range), the name (Peak names), and the named peaks (Remove Unknown peak). All peaks can be printed (Show all peaks). The Collection Log File Object This object enables you to print the collection log file, if using a fraction collection module :6

37 In the pop-up menu select PROPERTIES. The following window appears: The User selects the parameters to print: the rack scheme and/or the log table, as they are displayed in the Collection log file. Default Reports Eight default reports are provided in the Galaxie / data folder. You must copy them into the Group subfolder where you want to use them. Galaxie Report Editor 31
38 Default_standard.STYL: :6
39 Default_group_standard.STYL Galaxie Report Editor 33
40 Default calibration.styl :6
41 Default suitability.styl Galaxie Report Editor 35
42 Default_method.STYL :6
43 Galaxie Report Editor 37
44 :6
45 Default_group_method Galaxie Report Editor 39
46 :6

47 Galaxie Report Editor 41
48 Default_WinNT :6
49 Galaxie Report Editor 43
Galaxie Photodiode Array Software
 Varian, Inc. 2700 Mitchell Drive Walnut Creek, CA 94598-1675/USA Galaxie Photodiode Array Software User s Guide Varian, Inc. 2002-2006 03-914950-00:6 Table of Contents Introduction... 3 General... 3 PDA
Rich Text Editor Quick Reference
 Rich Text Editor Quick Reference Introduction Using the rich text editor is similar to using a word processing application such as Microsoft Word. After data is typed into the editing area it can be formatted
Nauticom NetEditor: A How-to Guide
 Nauticom NetEditor: A How-to Guide Table of Contents 1. Getting Started 2. The Editor Full Screen Preview Search Check Spelling Clipboard: Cut, Copy, and Paste Undo / Redo Foreground Color Background Color
Report Generator for DPOPWR
 Online Help Report Generator for DPOPWR Adapted from the Report Generator for DPOPWR Online Help www.tektronix.com Copyright Tektroni x. All rights reserved. Licensed software products are owned by Tektronix
Chromatography Software Training Materials. Contents
 Chromatography Software Training Materials This document contains information on how to build a method, start the instrument to acquire data, and then process the data using the Galaxie Program. You will
Introducing Gupta Report Builder
 Business Reporting Chapter 1 Introducing Gupta Report Builder You can use Report Builder to design reports. This chapter describes: Our approach to building reports. Some of the reports you can build.
WEEK NO. 12 MICROSOFT EXCEL 2007
 WEEK NO. 12 MICROSOFT EXCEL 2007 LESSONS OVERVIEW: GOODBYE CALCULATORS, HELLO SPREADSHEET! 1. The Excel Environment 2. Starting A Workbook 3. Modifying Columns, Rows, & Cells 4. Working with Worksheets
Word 2013 Quick Start Guide
 Getting Started File Tab: Click to access actions like Print, Save As, and Word Options. Ribbon: Logically organize actions onto Tabs, Groups, and Buttons to facilitate finding commands. Active Document
Display Systems International Software Demo Instructions
 Display Systems International Software Demo Instructions This demo guide has been re-written to better reflect the common features that people learning to use the DSI software are concerned with. This
How to...create a Video VBOX Gauge in Inkscape. So you want to create your own gauge? How about a transparent background for those text elements?
 BASIC GAUGE CREATION The Video VBox setup software is capable of using many different image formats for gauge backgrounds, static images, or logos, including Bitmaps, JPEGs, or PNG s. When the software
Agilent EZChrom Elite. PDA Analysis
 Agilent EZChrom Elite PDA Analysis Notices Copyright Scientific Software, Inc 1997-2003 Agilent Technologies, Inc. 2006. No part of this manual may be reproduced in any form or by any means (including
Excel Main Screen. Fundamental Concepts. General Keyboard Shortcuts Open a workbook Create New Save Preview and Print Close a Workbook
 Excel 2016 Main Screen Fundamental Concepts General Keyboard Shortcuts Open a workbook Create New Save Preview and Print Close a Ctrl + O Ctrl + N Ctrl + S Ctrl + P Ctrl + W Help Run Spell Check Calculate
Microsoft How to Series
 Microsoft How to Series Getting Started with EXCEL 2007 A B C D E F Tabs Introduction to the Excel 2007 Interface The Excel 2007 Interface is comprised of several elements, with four main parts: Office
Data Acquisition with CP-2002/2003 Micro-GC Control
 Varian Analytical Instruments 2700 Mitchell Drive Walnut Creek, CA 94598 Star Chromatography Workstation Version 6 Data Acquisition with CP-2002/2003 Micro-GC Control Operation Manual Varian, Inc. 2002
BusinessObjects Frequently Asked Questions
 BusinessObjects Frequently Asked Questions Contents Is there a quick way of printing together several reports from the same document?... 2 Is there a way of controlling the text wrap of a cell?... 2 How
Changing Worksheet Views
 PROCEDURES LESSON 1: TOURING EXCEL Starting Excel 1 Click the Start button 2 Click All Programs 3 Click the Microsoft Office folder icon 4 Click Microsoft Excel 2010 Naming and Saving (Ctrl+S) a Workbook
Thermo Xcalibur Getting Started (Quantitative Analysis)
") Thermo Xcalibur Getting Started (Quantitative Analysis) XCALI-97207 Revision B September 2010 2010 Thermo Fisher Scientific Inc. All rights reserved. Xcalibur, Surveyor, and Accela are registered trademarks
Thermo Xcalibur Getting Started (Quantitative Analysis) XCALI-97207 Revision B September 2010 2010 Thermo Fisher Scientific Inc. All rights reserved. Xcalibur, Surveyor, and Accela are registered trademarks
Excel 2003 Tutorial II
 This tutorial was adapted from a tutorial by see its complete version at http://www.fgcu.edu/support/office2000/excel/index.html Excel 2003 Tutorial II Charts Chart Wizard Chart toolbar Resizing a chart
Designer Reference 1
 Designer Reference 1 Table of Contents USE OF THE DESIGNER...4 KEYBOARD SHORTCUTS...5 Shortcuts...5 Keyboard Hints...5 MENUS...7 File Menu...7 Edit Menu...8 Favorites Menu...9 Document Menu...10 Item Menu...12
LETTER BUILDER. Letter Builder. For RiskMan Version Last reviewed 24 Jun Copyright 2017 Page RiskMan 1 of International 17 Pty Ltd
 Letter Builder For RiskMan Version 16.02 Last reviewed 24 Jun 2016 Copyright 2017 Page RiskMan 1 of International 17 Pty Ltd Contents What does the Letter Builder do?... 3 Examples... 3 Detailed Overview...
Using OPUS to Process Evolved Gas Data (8/12/15 edits highlighted)
") Using OPUS to Process Evolved Gas Data (8/12/15 edits highlighted) Once FTIR data has been acquired for the gases evolved during your DSC/TGA run, you will process using the OPUS software package. Select
Using OPUS to Process Evolved Gas Data (8/12/15 edits highlighted) Once FTIR data has been acquired for the gases evolved during your DSC/TGA run, you will process using the OPUS software package. Select
Reference Services Division Presents. Microsoft Word 2
 Reference Services Division Presents Microsoft Word 2 This handout covers the latest Microsoft Word 2010. This handout includes instructions for the tasks we will be covering in class. Basic Tasks Review
Severe Weather Safety PSA
 Contents Add Text 2 Format Text 3 Add Stickers 4 Resize Stickers 8 Change the Color of the Canvas 9 Name the Project 12 Add a Page 12 Practice Adding and Formatting Text 13 Use the Paint Brush Tool 14
R e p o r t E d i t o r M a n u a l
 R e p o r t E d i t o r 2. 1 M a n u a l Report Editor - Contents Page 1-1 Contents Page 1. Introduction...1-2 2. Description of the Menu Procedures...2-1 2.1 File...2-2 2.2 Edit...2-3 2.3 Format...2-4
Contents. Introduction 13. Putting The Smart Method to Work 16. Session One: Basic Skills 23
 Contents Introduction 13 Feedback... 13 Downloading the sample files... 13 Problem resolution... 13 Typographical Conventions Used In This Book... 14 Putting The Smart Method to Work 16 Excel version and
Lesson 15 Working with Tables
 Working with Tables Computer Literacy BASICS: A Comprehensive Guide to IC 3, 5 th Edition 1 Objectives Create a table and insert text. Insert and delete rows and columns. Adjust column width and row height.
Table of Contents. Chapter 1
 Table of Contents iii Table of Contents Chapter 1 Starting Excel Using an electronic spreadsheet 2 Starting Excel 2 Exploring the Start screen 4 Creating a blank workbook 4 Exploring the Excel window 5
Galaxie Workstation Configuration Manager
 Varian, Inc. 2700 Mitchell Drive Walnut Creek, CA 94598-1675/USA Galaxie Workstation Configuration Manager User s Guide Varian, Inc. 2002-2005 Printed in U.S.A. 03-914973-00:Rev. 3 Table of Contents Using
StickFont Editor v1.01 User Manual. Copyright 2012 NCPlot Software LLC
 StickFont Editor v1.01 User Manual Copyright 2012 NCPlot Software LLC StickFont Editor Manual Table of Contents Welcome... 1 Registering StickFont Editor... 3 Getting Started... 5 Getting Started...
Chapter 4 Printing and Viewing a Presentation Using Proofing Tools I. Spell Check II. The Thesaurus... 23
 PowerPoint Level 1 Table of Contents Chapter 1 Getting Started... 7 Interacting with PowerPoint... 7 Slides... 7 I. Adding Slides... 8 II. Deleting Slides... 8 III. Cutting, Copying and Pasting Slides...
Using Adobe Contribute 4 A guide for new website authors
 Using Adobe Contribute 4 A guide for new website authors Adobe Contribute allows you to easily update websites without any knowledge of HTML. This handout will provide an introduction to Adobe Contribute
Ms excel. The Microsoft Office Button. The Quick Access Toolbar
 Ms excel MS Excel is electronic spreadsheet software. In This software we can do any type of Calculation & inserting any table, data and making chart and graphs etc. the File of excel is called workbook.
User Guide. Web Intelligence Rich Client. Business Objects 4.1
 User Guide Web Intelligence Rich Client Business Objects 4.1 2 P a g e Web Intelligence 4.1 User Guide Web Intelligence 4.1 User Guide Contents Getting Started in Web Intelligence 4.1... 5 Log into EDDIE...
The American University in Cairo. Academic Computing Services. Word prepared by. Soumaia Ahmed Al Ayyat
 The American University in Cairo Academic Computing Services Word 2000 prepared by Soumaia Ahmed Al Ayyat Spring 2001 Table of Contents: Opening the Word Program Creating, Opening, and Saving Documents
PDA EXTENSION. Clarity Extension. Code/Rev.: M054/80A Date: 6/8/2018. Fax: Petrzilkova 2583/ Prague 5
 PDA EXTENSION Clarity Extension ENG Code/Rev.: M054/80A Date: 6/8/2018 Phone: +420 251 013 400 DataApex Ltd. Fax: +420 251 013 401 Petrzilkova 2583/13 clarity@dataapex.com 158 00 Prague 5 www.dataapex.com
DEVELOPING DATABASE APPLICATIONS (INTERMEDIATE MICROSOFT ACCESS, X405.5)
") Technology & Information Management Instructor: Michael Kremer, Ph.D. Database Program: Microsoft Access Series DEVELOPING DATABASE APPLICATIONS (INTERMEDIATE MICROSOFT ACCESS, X405.5) Section 5 AGENDA
Technology & Information Management Instructor: Michael Kremer, Ph.D. Database Program: Microsoft Access Series DEVELOPING DATABASE APPLICATIONS (INTERMEDIATE MICROSOFT ACCESS, X405.5) Section 5 AGENDA
Logger Pro Resource Sheet
 Logger Pro Resource Sheet Entering and Editing Data Data Collection How to Begin How to Store Multiple Runs Data Analysis How to Scale a Graph How to Determine the X- and Y- Data Points on a Graph How
Elixir Ad-hoc Report. Release Elixir Technology Pte Ltd
 Elixir Ad-hoc Report Release 3.5.0 Elixir Technology Pte Ltd Elixir Ad-hoc Report: Release 3.5.0 Elixir Technology Pte Ltd Published 2014 Copyright 2014 Elixir Technology Pte Ltd All rights reserved. Java
Contents. Introduction 15. How to use this course 18. Session One: Basic Skills 21. Session Two: Doing Useful Work with Excel 65
 Contents Introduction 15 Downloading the sample files... 15 Problem resolution... 15 The Excel version and locale that were used to write this book... 15 Typographical Conventions Used in This Book...
Plotting. Documentation. DDBSP - Dortmund Data Bank Software Package
 Plotting Documentation DDBSP - Dortmund Data Bank Software Package DDBST Software & Separation Technology GmbH Marie-Curie-Straße 10 D-26129 Oldenburg Tel.: +49 441 361819 0 Fax: +49 441 361819 10 E-Mail:
IT153 Midterm Study Guide
 IT153 Midterm Study Guide These are facts about the Adobe Dreamweaver CS4 Application. If you know these facts, you should be able to do well on your midterm. Dreamweaver users work in the Document window
Creating & Modifying Tables in Word 2003
 Creating & Modifying Tables in Word 2003 This bookl LaTonya Motley Trainer / Instructional Technology Specialist Staff Development 660-6452 Table of Contents Overview... 1 Inserting Tables... 1 Using Pre-Set
For more tips on using this workbook, press F1 and click More information about this template.
 Excel: Menu to ribbon reference To view Office 2003 menu and toolbar commands and their Office 2010 equivalents, click a worksheet tab at the bottom of the window. If you don't see the tab you want, right-click
MODIFYING CIRCULATION WINDOW DISPLAYS
 5-58 Using M3 Circulation MODIFYING CIRCULATION WINDOW DISPLAYS Note: If M3 v1.6 was your first installation of M3, graphic cells appear by default in the Patron and Item panes for all modes. Tip: Create
Mi c r o s o f t Wo r d Qu i c k Re f e r e n c e Ca r d
 Tech Talk # 5 Mi c r o s o f t Wo r d Qu i c k Re f e r e n c e Ca r d Introduction by Renae Schmidt Hello! Welcome to Tech Talk #5. This week we are sharing a Microsoft Word 2010 Quick Reference Card.
Changing Worksheet Views
 PROCEDURES LESSON 1: TOURING EXCEL Starting Excel From the Windows Start screen, click the Excel 2013 program tile 1 Right-click a blank area of the Windows Start screen 2 Click the All Apps button 3 Click
PN , Revision A, April Epic 950 TM Layout Editor User s Guide
 PN 95-06011, Revision A, April 2005 Epic 950 TM Layout Editor User s Guide This page intentionally left blank Change History Rev A Initial release April 2005 Important: Before installing any equipment
Tree and Data Grid for Micro Charts User Guide
 COMPONENTS FOR XCELSIUS Tree and Data Grid for Micro Charts User Guide Version 1.1 Inovista Copyright 2009 All Rights Reserved Page 1 TABLE OF CONTENTS Components for Xcelsius... 1 Introduction... 4 Data
Data Handling and Reports
 Varian Analytical Instruments 2700 Mitchell Drive Walnut Creek, CA 94598-1675/USA Star Chromatography Workstation Version 6 Data Handling and Reports Tutorials Varian, Inc. 2002 03-914736-00:Rev. 4 Trademark
MS Word 2010 An Introduction
 MS Word 2010 An Introduction Table of Contents The MS Word 2010 Environment... 1 The Word Window Frame... 1 The File Tab... 1 The Quick Access Toolbar... 4 To Customize the Quick Access Toolbar:... 4
Creating a Spreadsheet by Using Excel
 The Excel window...40 Viewing worksheets...41 Entering data...41 Change the cell data format...42 Select cells...42 Move or copy cells...43 Delete or clear cells...43 Enter a series...44 Find or replace
Drawing. Chapter 11. Bridge. A. Insert Views. Step 1. Click File Menu > New, click Drawing and OK. on the View Layout toolbar.
 Chapter 11 Bridge Drawing A. Insert Views. Step 1. Click File Menu > New, click Drawing and OK. Step 2. Click Model View on the View Layout toolbar. Step 3. Click Browse in the Property Manager. Step 4.
Layout and display. STILOG IST, all rights reserved
 2 Table of Contents I. Main Window... 1 1. DEFINITION... 1 2. LIST OF WINDOW ELEMENTS... 1 Quick Access Bar... 1 Menu Bar... 1 Windows... 2 Status bar... 2 Pop-up menu... 4 II. Menu Bar... 5 1. DEFINITION...
Multivariate Calibration Quick Guide
 Last Updated: 06.06.2007 Table Of Contents 1. HOW TO CREATE CALIBRATION MODELS...1 1.1. Introduction into Multivariate Calibration Modelling... 1 1.1.1. Preparing Data... 1 1.2. Step 1: Calibration Wizard
Keynote 08 Basics Website:
 Website: http://etc.usf.edu/te/ Keynote is Apple's presentation application. Keynote is installed as part of the iwork suite, which also includes the word processing program Pages and the spreadsheet program
EXCEL 2003 DISCLAIMER:
 EXCEL 2003 DISCLAIMER: This reference guide is meant for experienced Microsoft Excel users. It provides a list of quick tips and shortcuts for familiar features. This guide does NOT replace training or
Sending image(s) to report Click Send Snapshot on any screen in Dolphin3D and choose the Send to Report option
 to report Click Send Snapshot on any screen in Dolphin3D and choose the Send to Report option") Dolphin 3D Reports Sending image(s) to report Click Send Snapshot on any screen in Dolphin3D and choose the Send to Report option Creating a report step by step 1. Generate the desired images in Dolphin3D
Dolphin 3D Reports Sending image(s) to report Click Send Snapshot on any screen in Dolphin3D and choose the Send to Report option Creating a report step by step 1. Generate the desired images in Dolphin3D
Creating Web Pages with SeaMonkey Composer
 1 of 26 6/13/2011 11:26 PM Creating Web Pages with SeaMonkey Composer SeaMonkey Composer lets you create your own web pages and publish them on the web. You don't have to know HTML to use Composer; it
XnView 1.9. a ZOOMERS guide. Introduction...2 Browser Mode... 5 Image View Mode...15 Printing Image Editing...28 Configuration...
 XnView 1.9 a ZOOMERS guide Introduction...2 Browser Mode... 5 Image View Mode...15 Printing... 22 Image Editing...28 Configuration... 36 Written by Chorlton Workshop for hsbp Introduction This is a guide
Microsoft Excel 2002 M O D U L E 2
 THE COMPLETE Excel 2002 M O D U L E 2 CompleteVISUAL TM Step-by-step Series Computer Training Manual www.computertrainingmanual.com Copyright Notice Copyright 2002 EBook Publishing. All rights reserved.
Numbers Basics Website:
 Website: http://etc.usf.edu/te/ Numbers is Apple's new spreadsheet application. It is installed as part of the iwork suite, which also includes the word processing program Pages and the presentation program
Lesson 15 Working with Tables
 Working with Tables Computer Literacy BASICS: A Comprehensive Guide to IC 3, 4 th Edition 1 Objectives Create a table and insert text. Insert and delete rows and columns. Adjust column width and row height.
Content provided in partnership with Que, from the book Show Me Microsoft Office Access 2003 by Steve JohnsonÃÃ
 ,PSURYLQJWKH$SSHDUDQFHRI )RUPVDQGHSRUWV Content provided in partnership with Que, from the book Show Me Microsoft Office Access 00 by Steve JohnsonÃÃ Introduction The objects in a database most on display
Using MS Publisher. Launch MS Publisher: Start > All Programs > Microsoft Office > Publisher. Setting up Document Size and Orientation
 Designing and Creating your GIS Poster Revised by Carolyn Talmadge 1/20/2015 First think about your audience and purpose then design your poster! Here are instructions for setting up your poster using
TraceFinder Analysis Quick Reference Guide
 TraceFinder Analysis Quick Reference Guide This quick reference guide describes the Analysis mode tasks assigned to the Technician role in Thermo TraceFinder analytical software. For detailed descriptions
The American University in Cairo. Academic Computing Services. Excel prepared by. Maha Amer
 The American University in Cairo Excel 2000 prepared by Maha Amer Spring 2001 Table of Contents: Opening the Excel Program Creating, Opening and Saving Excel Worksheets Sheet Structure Formatting Text
SUM - This says to add together cells F28 through F35. Notice that it will show your result is
 COUNTA - The COUNTA function will examine a set of cells and tell you how many cells are not empty. In this example, Excel analyzed 19 cells and found that only 18 were not empty. COUNTBLANK - The COUNTBLANK
Goldfish 4. Quick Start Tutorial
 Goldfish 4 Quick Start Tutorial A Big Thank You to Tobias Schilpp 2018 Fishbeam Software Text, Graphics: Yves Pellot Proofread, Photos: Tobias Schilpp Publish Code: #180926 www.fishbeam.com Get to know
Spreadsheet View and Basic Statistics Concepts
 Spreadsheet View and Basic Statistics Concepts GeoGebra 3.2 Workshop Handout 9 Judith and Markus Hohenwarter www.geogebra.org Table of Contents 1. Introduction to GeoGebra s Spreadsheet View 2 2. Record
Report Designer Report Types Table Report Multi-Column Report Label Report Parameterized Report Cross-Tab Report Drill-Down Report Chart with Static
 Table of Contents Report Designer Report Types Table Report Multi-Column Report Label Report Parameterized Report Cross-Tab Report Drill-Down Report Chart with Static Series Chart with Dynamic Series Master-Detail
EDITOR GUIDE. Button Functions:...2 Inserting Text...4 Inserting Pictures...4 Inserting Tables...8 Inserting Styles...9
 EDITOR GUIDE Button Functions:...2 Inserting Text...4 Inserting Pictures...4 Inserting Tables...8 Inserting Styles...9 1 Button Functions: Button Function Display the page content as HTML. Save Preview
Microsoft Word 2010 Basics
 1 Starting Word 2010 with XP Click the Start Button, All Programs, Microsoft Office, Microsoft Word 2010 Starting Word 2010 with 07 Click the Microsoft Office Button with the Windows flag logo Start Button,
Index. borders adding to cells, 174 draw border line tool, using to add, 175
 Index A A4 size paper, 289 absolute references, 128 accounting number format style, 158 add-ins content, explained, 138 downloading from the office store, 140 task pane, explained, 138 uses of, 138 alignment
MICROSOFT WORD. Table of Contents. What is MSWord? Features LINC FIVE
 Table of Contents What is MSWord? MSWord is a word-processing program that allows users to insert, edit, and enhance text in a variety of formats. Word is a powerful word processor with sophisticated editing
Microsoft Excel 2010 Tutorial
 1 Microsoft Excel 2010 Tutorial Excel is a spreadsheet program in the Microsoft Office system. You can use Excel to create and format workbooks (a collection of spreadsheets) in order to analyze data and
Table of Contents. Overview... 4 Advanced Content Items... 4 Accessibility... 4 iframe Textpoppers Math Characters and Equations...
 Dallas County Community College District Table of Contents Overview... 4 Advanced Content Items... 4 Accessibility... 4 iframe... 4 Insert a Web Page... 4 Insert a PDF... 6 Textpoppers... 8 Insert a Text
Technology Assignment: Scatter Plots
 The goal of this assignment is to create a scatter plot of a set of data. You could do this with any two columns of data, but for demonstration purposes we ll work with the data in the table below. You
Microsoft Office Excel 2013 Courses 24 Hours
 Microsoft Office Excel 2013 Courses 24 Hours COURSE OUTLINES FOUNDATION LEVEL COURSE OUTLINE Getting Started With Excel 2013 Starting Excel 2013 Selecting the Blank Worksheet Template The Excel 2013 Cell
Fig. A. Fig. B. Fig. 1. Fig. 2. Fig. 3 Fig. 4
 Create A Spinning Logo Tutorial. Bob Taylor 2009 To do this you will need two programs from Xara: Xara Xtreme (or Xtreme Pro) and Xara 3D They are available from: http://www.xara.com. Xtreme is available
Microsoft Word Part I Reference Manual
 Microsoft Word 2002 Part I Reference Manual Instructor: Angela Sanderson Computer Training Coordinator Updated by: Angela Sanderson January 11, 2003 Prepared by: Vi Johnson November 20, 2002 THE WORD SCREEN
PART 7. Formatting Pages
 PART 7 Formatting Pages In the preceding part, you learned how to format characters and paragraphs. In this part, you learn how to apply formatting that affects entire pages. You ll start with changing
Screen Designer. The Power of Ultimate Design. 43-TV GLO Issue 2 01/01 UK
 Screen Designer The Power of Ultimate Design 43-TV-25-13 GLO Issue 2 01/01 UK 43-TV-25-13 GLO Issue 2 01/01 UK Table of Contents Table of Contents Honeywell Screen Designer - The Power of Ultimate Design
SAS Visual Analytics 8.2: Working with Report Content
 SAS Visual Analytics 8.2: Working with Report Content About Objects After selecting your data source and data items, add one or more objects to display the results. SAS Visual Analytics provides objects
4D Write. User Reference Mac OS and Windows Versions. 4D Write D SA/4D, Inc. All Rights reserved.
 4D Write User Reference Mac OS and Windows Versions 4D Write 1999-2002 4D SA/4D, Inc. All Rights reserved. 4D Write User Reference Version 6.8 for Mac OS and Windows Copyright 1999 2002 4D SA/4D, Inc.
Paint/Draw Tools. Foreground color. Free-form select. Select. Eraser/Color Eraser. Fill Color. Color Picker. Magnify. Pencil. Brush.
 Paint/Draw Tools There are two types of draw programs. Bitmap (Paint) Uses pixels mapped to a grid More suitable for photo-realistic images Not easily scalable loses sharpness if resized File sizes are
Microsoft Excel 2010 Basic
 Microsoft Excel 2010 Basic Introduction to MS Excel 2010 Microsoft Excel 2010 is a spreadsheet software in the new Microsoft 2010 Office Suite. Excel allows you to store, manipulate and analyze data in
INTRODUCTION... 1 UNDERSTANDING CELLS... 2 CELL CONTENT... 4
 Introduction to Microsoft Excel 2016 INTRODUCTION... 1 The Excel 2016 Environment... 1 Worksheet Views... 2 UNDERSTANDING CELLS... 2 Select a Cell Range... 3 CELL CONTENT... 4 Enter and Edit Data... 4
Status Bar: Right click on the Status Bar to add or remove features.
 Excel 2013 Quick Start Guide The Excel Window File Tab: Click to access actions like Print, Save As, etc. Also to set Excel options. Ribbon: Logically organizes actions onto Tabs, Groups, and Buttons to
Microsoft Office Excel
 Microsoft Office 2007 - Excel Help Click on the Microsoft Office Excel Help button in the top right corner. Type the desired word in the search box and then press the Enter key. Choose the desired topic
Designing & Creating your GIS Poster
 Designing & Creating your GIS Poster Revised by Carolyn Talmadge and Kyle Monahan 4/24/2017 First think about your audience and purpose, then design your poster! Here are instructions for setting up your
FACULTY AND STAFF COMPUTER FOOTHILL-DE ANZA. Office Graphics
 FACULTY AND STAFF COMPUTER TRAINING @ FOOTHILL-DE ANZA Office 2001 Graphics Microsoft Clip Art Introduction Office 2001 wants to be the application that does everything, including Windows! When it comes
The HOME Tab: Cut Copy Vertical Alignments
 The HOME Tab: Cut Copy Vertical Alignments Text Direction Wrap Text Paste Format Painter Borders Cell Color Text Color Horizontal Alignments Merge and Center Highlighting a cell, a column, a row, or the
TraceFinder Analysis Quick Reference Guide
 TraceFinder Analysis Quick Reference Guide This quick reference guide describes the Analysis mode tasks assigned to the Technician role in the Thermo TraceFinder 3.0 analytical software. For detailed descriptions
Labels and Envelopes in Word 2013
 Labels and Envelopes in Word 2013 Labels... 2 Labels - A Blank Page... 2 Selecting the Label Type... 2 Creating the Label Document... 2 Labels - A Page of the Same... 3 Printing to a Specific Label on
Introduction to Excel
 Office Button, Tabs and Ribbons Office Button The File menu selection located in the upper left corner in previous versions of Excel has been replaced with the Office Button in Excel 2007. Clicking on
KaleidaGraph Quick Start Guide
 KaleidaGraph Quick Start Guide This document is a hands-on guide that walks you through the use of KaleidaGraph. You will probably want to print this guide and then start your exploration of the product.
NiceLabel Designer Standard User Guide
 NiceLabel Designer Standard User Guide English Edition Rev-1112 2012 Euro Plus d.o.o. All rights reserved. Euro Plus d.o.o. Poslovna cona A 2 SI-4208 Šenčur, Slovenia tel.: +386 4 280 50 00 fax: +386 4
Motic Images Plus 3.0 ML Software. Windows OS User Manual
 Motic Images Plus 3.0 ML Software Windows OS User Manual Motic Images Plus 3.0 ML Software Windows OS User Manual CONTENTS (Linked) Introduction 05 Menus and tools 05 File 06 New 06 Open 07 Save 07 Save
Contents. Launching Word
 Using Microsoft Office 2007 Introduction to Word Handout INFORMATION TECHNOLOGY SERVICES California State University, Los Angeles Version 1.0 Winter 2009 Contents Launching Word 2007... 3 Working with
Microsoft Office Training Skills 2010
 Microsoft Office Training Skills 2010 Lesson 5 Working with pages, Tables, Shapes and Securing Documents Adding Page color Add color to the background of one or several pages in the document. 1. Click