Scoreboard User Guide Table of Contents (Hyperlinked)
|
|
|
- Laurence Barker
- 5 years ago
- Views:
Transcription
1 Scoreboard User Guide Table of Contents (Hyperlinked) Getting Started Login Screen Navigating the Sections of Scoreboard Icons My Bookmarks Section Briefing Pane Commonly Used Functions The Briefing Books Section The Scorecard Section Building the Organizations Building Scorecards Navigation Subsection Executive View Subsection Overview Subsection KPI Subsection Analysis Subsection Actions Subsection Related Items Subsection The Action Plans Section Gantt Chart Subsection Overview Subsection The Documents Section The Reports Section The Dashboard Section Creating Your Dashboard Editing Your Dashboard

2 Getting Started Login Screen: This is the first screen you will see and how you access the application: Type in your username and password. If you have more than one database available, choose the correct database from the drop-down menu and then click the Submit button.

3 Navigating the Sections of Scoreboard : Scoreboard is broken down into different sections and subsections for easy navigation. Once you log in, check the top-left part of your screen and look for the following location: This indicates that you are currently looking at the My Bookmarks section. If you would like to change the section, either click on the My Bookmarks text or the small arrow icon to its right. This will pull up a drop-down menu, allowing you to choose another section of the application: Choose the appropriate section and the newly selected section will now display at the top. Some sections also have available subsections. In this case, we are in the Scorecards section and viewing the Navigation subsection. You can choose a different subsection in the same manner. There is a lot of data that will be period specific in Scoreboard. To change the calendar period, simply click on the date and the calendar selector will appear: The following page contains a list of the icons that you will find throughout Scoreboard and what they represent:
4 Icons: Administration Section Archive My Bookmarks Section Briefing Book Section Calendar Empty Notes Populated Notes Copy Cut Delete Documentation Section Edit Erase Error Excel External Link Red KPI Indicator Group Help New Action Locked Log Out Order Down Order Up Organization Unpopulated Organization Outlook Paste PDF History Word Last Period Next Period Picture PowerPoint Print Promote Rename Reports Section Report Scorecards Section Send To Sort Down Sort Up Un-archive Go up one level User Warning Weight Linked Node KPI Smart Objective Key Performance Area Scorecard Action Action Plan Milestone

5 My Bookmarks Section This is the default section in which the application opens. You can also return to this section at any time by clicking on the section. Any time you wish to log out of the application, you can either click on the icon in the upper middle part of your screen or click on to the left of the key icon.


6 Briefing Pane: This is where your bookmarks are saved. They are easily accessible as soon as you log in to the application. Simply click on the one that you would like to see, and it will be displayed in the briefing pane to the right. You can also right-click to create new bookmarks or folders: If you would like to reorder the items, simply left-click and hold the object you would like to move and then drag it to another location in the bookmarks tree. Let go and you have successfully moved the object.


7 Commonly Used Functions: These shortcuts are provided on your home bookmark link to allow you easy access to the most commonly used functions inside the application: Just click the expand icon to the left of the function to view its contents: You can check on the Actions you have been assigned from My Actions. You may also monitor KPIs you own by clicking the expand icon associated with KPIs I Own. Additionally, you may update or import specific KPIs you are associated with by clicking on KPIs I Update. You may also change your password by clicking My Settings.


8 The Briefing Books Section This is the section where you can store all of your Briefing Books. Briefing books are a collection of slides that you can pull from different parts of the application to create one or more sets of screens for the purposes of demonstrating information found in Scoreboard. The first thing you will have to do is create a Briefing Book. When choosing an organization that doesn t yet have a Briefing Book, this is the first screen you will see when choosing the section:
9 Click on the button to create a new Briefing Book. Give it a name: This will be the result:
10 You can now navigate throughout the application and, using the Send To button and choosing Briefing Book, add as many slides to your Briefing Book as you like. This is what the wizard looks like for sending page to Briefing Book:

11 Once you have created all your slides, you can view your Briefing Book in full screen by sending page to full screen. First, navigate to the Briefing Book you would like to view, and send the page to full screen. Then, you will see the slide show functionality available at the bottom of the new screen. You can click left or right to view the next slide or jump to any available slide:

12 This is the result:
13 The Scorecard Section This is the section in which most of the data in the application can be found. You can also return to this section at any time by clicking on the section.


14 Building the Organizations: If you have not defined any organizations when you navigate to the Scorecard section, you will see: You can then click on the link Create Root Organization: When you first click on the link, you will see a dialog box prompting you to enter the name of the highest-level unit in your organization: Enter the name of the highest-level unit of your organization, and you will see the beginning of your organization:


15 Once you have created the highest-level unit, you can right-click on the name and see the following choices: By clicking on the New Organization link, you can add organization units directly under the unit you have clicked. A dialog box will appear, prompting you to give a name to your new organization. You can add as many levels as you need to represent your organization structure:

16 Once you have created your organization hierarchy, you now have more options when you click on an organization unit: New Organization: adds an organization unit directly under the current choice Promote To Root: moves the organization to the root-level organization Cut: enables you to cut an organization to be moved somewhere else Paste: lets you paste a cut organization in another spot Edit: allows you to edit the name of the unit Delete: allows you to delete the unit and all Scorecards attached to that unit **In order to change the order or structure of your organization, you can use the dragand-drop feature. Simply click and drag the organization to where you would like it to go.**

17 As soon as you click on the Scorecard section, the application will ask you to choose which organization you would like to see. Choose the appropriate organization.
18 Building Scorecards: The Scorecards section will allow you to build a Scorecard structure for each organization unit. Click on the Scorecards section: Choose the appropriate organization. You can now create your new Scorecard. Click on New Scorecard: A dialog box will appear. Name is required. Description can be entered if applicable:

19 Once you have created the root of the Scorecard, you will see this: Right-click on the Scorecard and you will get a menu with several options:
20 New Key Performance Area: creates a node under whatever you clicked. Name and Node Type are required and Description is optional. You also have the option of assigning Owners if they are applicable: New Smart Objective: creates a new node in the same fashion as New Key Performance Area. The same rules apply:
21 New Subordinate Area: Same again with the same rules:
22 New KPI: When you start adding KPIs, the first menu you will see is: Name: Enter the name of your KPI. Calendar: Choose the frequency for the KPI based on the calendars you have defined. You will then be asked how to score the KPI: In Scoreboard, we offer 10 different scoring options: Yes/No: something is done or it isn't: This type of scoring is ideal for KPIs that either are or aren t done. For example, did you or didn t you finish your project on time. It can also work for KPIs where the desired outcome is negative: Did any employees quit this month?

23 2 Color: between worst and goal is red and between goal and best is green This type of scoring is ideal for situations where you want to give a more continuous range of scores. For example, when tracking revenue, gradations are important because it is crucial to see just how close you are getting to your revenue goal. 2 Color Goal Only: red if you are under goal, green if you are above This type of scoring is not used as often as the 2 Color option above, likely because it does not offer the ability to see a continuous range of scores.
24 3 Color: stoplight coloring where you specify where the absolute worst and best value is This scoring option allows you to specify where the best and worst value is, like in the 2 Color option, but it allows for even more gradations because of the yellow band. Note that the Red Flag value is the point at which yellow changes to red. Goal/Red Flag: stoplight where you have red below a least acceptable value, yellow between that value and goal with green at goal and above This is the scoring type most often recommended to Scoreboard users. This type of scoring only requires that you specify Goal and Red Flag. The system creates the best and the worst automatically in such a way that all three fields are the same size.

25 4 Color (Red-Orange-Yellow-Green): like stoplight except you include a wider range from worst to best This scoring option is similar to the 3 Color type, but with the addition of the orange field to show when you want an additional warning that orange will soon turn to red. 4 Color (Red-Yellow-Green-Blue): like stoplight except blue is where things are TOO good and no more effort should be expended This scoring option is similar to the previous 4 Color type, but instead of orange nearing red, you ve denoted the point at which things are, perhaps, too good and you might want to focus less effort there.

26 Stabilize (Red-Green-Red): for KPIs like inventory where too much is bad and too little is also bad This type of scoring is useful for when you want to have exactly a certain value. For example, a warehouse might need to have exactly a certain amount of items on its shelves. Too much and too little would both cause problems. In this type of scenario, the best score is dead center while one end of the speedometer is Low Worst and the other end is High Worst. Stabilize (Red-Yellow-Green-Yellow-Red): for KPIs where there is some flexibility about what is too much and too little This is similar to the previous type of scoring, but allows for more gradations.
, but you do score your profits.")
27 Unscored: This type of scoring is useful for when you have data you want to report on, but don t have a target. For example, perhaps you don t want to set targets for revenue or expenses (both unscored), but you do score your profits. Then, using the Unscored option for revenue and expenses won t affect the roll up of the nodes higher in the tree.
28 The next dialog box will ask you to make a few more decisions: Data Type: Standard means a real number. Percentage and Currency are self-explanatory. Aggregation Type: Select from sum, average, or last value. This selection determines how values are aggregated for calendar periods that span lengths of time that are larger than this KPI's native calendar period. Import Mapping Key: Enter a user defined "key" for use with CSV imports. Decimal Precision: Enter the number of decimal places to display for this individual KPI. If you leave this blank, the application will apply whatever the default has been set for. Update Type: Select Manual or Calculated. If you choose Manual for Red Flag and Goal, you must also add a Default Value. Calculated allows you to create KPIs whose values are calculated based on KPIs elsewhere in the hierarchy.
29 If you select Calculated, you will see the following dialog box: This screenshot shows sample equations for Actual Value, Red Flag, and Goal. To create the Actual Value equation shown above, first, select the organization you want on the left side of the screen. Then, select a KPI from the right side. Click Add. Then click, choose your next KPI and click Add. You can select as many KPIs as you want in the same manner. Make sure that you have selected Actual Value and Current Period in the drop down menus at the bottom of the dialog box. Click Finished when you are done. To create the Red Flag equation shown above, first convert your value into a decimal. In this case we changed 90% into.9, and then click. Then select (i.e., the one you are currently editing) from the top of the right-hand column. Instead of Current Period in the drop down menu at the bottom of the dialog box, select 12 Periods Earlier. Your equation will be.9*m(-12p). To create the Goal equation shown above, again convert your value into a decimal. In this case we changed 125% to 1.25, and then click. Then select (i.e., the one you are currently editing) from the top of the right-hand column. Instead of Current Period in the drop down menu at the bottom of the dialog box, select 12 Periods Earlier. Your equation will be 1.25*M(-12p).
30 Aside from the default functions to choose from while creating an equation in the Calculated KPI dialog box, you may also use functions from the following charts in your equations: Trigonometric Functions Log and Exponential Functions Statistical Functions
31 Rounding Functions Miscellaneous Functions

32 NOTE: When calculating Sum and Average of a series of KPIs, make sure to use the appropriate function. By using the function itself, you will ensure that any KPI marked N/A or with a null value is not calculated in the equation even if it is included in the equation itself. Remember, to denote a KPI as N/A, go to Scorecards / Overview and click on the KPI. Your screen should look something like this:
33 For Actual and Threshold Values, select and you will see the following dialog box. To make the KPI N/A, select No in the dropdown menu for Include KPI in this period s calculations.
34 Also, the following chart denotes the operational symbols to use within Scoreboard : Click Finished or you can go ahead and Add Owners and Updaters as well.

35 New Linked Node: This allows you to create a virtual link in your Scorecard structure that references another node in the system. You should choose the appropriate source node and decide whether or not you want to use the same name as that node.

36 As you build your Scorecard, you will begin to see it take shape:
 will change to reflect your changes. This information is all dependant on the calendar period that you have chosen to view it in.")
37 Navigation Subsection: This subsection is an auto-generated, color-enhanced display of the parts of your Scorecard: As you click and expand your Scorecard in the left-hand pane (navigation pane), you will notice that the information on the right-hand pane (content pane) will change to reflect your changes. This information is all dependant on the calendar period that you have chosen to view it in. To see what calendar period you are currently viewing, look for the date at the top left of your screen: To change the date period, simply click on the current date and this will pop up: Choose the calendar and period you would like to see and click Go. The date will change on the top right. Likewise, the data you will now be seeing will reflect the new calendar and period.


38 To identify the colors and what they mean: Exceeds Goals No Data Met Goals Warning Poor Needs Attention


39 Executive View Subsection: This is another auto-generated display of the information for your Scorecard: To add this as a bookmark to your My Bookmarks section, click on the button near the top of the content pane. Then choose My Bookmarks from the drop-down list:


40 Give your new bookmark a name and then click OK. You have now added the new bookmark to your My Bookmark section. There are a number of icons displayed on this subsection, and clicking on the link in the top right of the content frame will display their meanings: In addition to using the navigation pane, you can also expand and contract the +/- icons in the content frame to see more or less information. Clicking on any of the icons on the right will display expanded information about that scorecard node.

41 Overview Subsection: This is where the most detailed information for your Scorecard will be displayed:


42 You can use the navigation pane on the left to drill-down to specific scorecard nodes. To print valuable information, click on the drop-down list. button, then choose Printer from the Once you have drilled-down to the KPI level, you will find even more options and information:


43 If you have the permissions to do so, you can Modify Owners, Updaters, or even Update KPIs from this screen by clicking on their respective buttons. To edit notes, you can click on, and it will bring up the text editor for you to use. To export the information out of Scoreboard into an external application, click on the button near the top of the page. You will then choose where to export to from the drop-down menu: Choose the application you would like to export to and then either choose Open or Save in the next dialog box:

44 You will also notice that all of the sections of the Overview subsection are collapsible for your usability. You can click on the name of the section or the small triangle next to it to open or close those sections of the display pane: The Historical Performance part of the overview subsection also has its own special set of features. You can change the amount of time displayed in the chart. Use the slider to set the amount of time displayed:

45 You can also modify the data displayed on the chart itself. Click on the to bring up the chart builder: button Here you can add series, change the axis, as well as a number of other configurations. All changes are made real-time and you can see the new chart as you work. Click the button to save your changes or click the link at the top of the page to go back to the Overview subsection.

46 KPI Subsection: The KPI Report allows you to view information, in a Scorecard view, associated with any one of the chosen Key Performance Areas as well as individual KPIs. Click and you can choose the amount of information to view by opening Display Options. You can increase or decrease the number of calendar periods displayed by using the dropdown option: Additionally, you can select the data you would like to view in your report by clicking on the checkboxes.

47 Analysis Subsection: The Analysis subsection contains a variety of graphical representations of your data. Clicking on any of these icons will produce a different type of analysis graph. Also, these results will dynamically change to match whichever node you select from the Scorecard structure on the Navigation pane.


48 Actions Subsection: The Actions subsection will display any overdue, ongoing, or completed Actions that have been associated with the scorecard node that is displayed. There are two toggled views here: Show by Status and Show as One List. The view you choose will determine how the data are displayed. If it has been enabled in the Application Administration part of the Administration section, you will see the ability to Add to Calendar. By clicking on the link, you can add this date to your desktop calendar. Below is the first screen that appears after clicking the button. Choose to open the file:

49 Now you can use all of the available tools from your default calendar application to save the appointment. **Disclaimer The screen shot below is of a popular calendar software and its use in this guide is in no way promoting the purchase or use of such software and is in no way connected to Spider Strategies, Inc.**

50 Related Items Subsection: In the Related Items subsection, you can link your scorecard node to other scorecard nodes, Action Plans, Documents, or External Web addresses. Simply click the corresponding button and then follow the on-screen instructions to select the object you are linking it to.

51 The Action Plans Section This section is where your custom Action Plans can be viewed. You can also return to this section at any time by clicking on the section. As soon as you click on the Action Plans section, the application will ask you to choose which organization you would like to see. Choose the appropriate organization.

52 Gantt Chart Subsection: This is the first section that will be displayed when you choose the Action Plans section. By default, the All Action Plans option will display as a Gantt chart. This will display all the Action Plans, Actions, and Milestones that have been created for this organization. You can also add Action Plans, Actions, and Milestones from this subsection. Right-click on the parent node of the object that you would like to create and you will see this menu: New Action Plan: Title and Type are the only required fields.

53 In order to enter dates for the Start, Due, and Completion date fields, click on the appropriate box. This will bring up the calendar dialog box. Click on a date in the calendar and this will populate the appropriate field: New Action : Title and Type are the only required fields. New Milestone: Title and Type are the only required fields.

54 Overview Subsection: From the Overview subsection, you have much more detailed information displayed as well as the ability to create, and/or modify Action Plans, Actions, or Milestones. You can create these objects in the same way described in the Gantt chart section: by rightclicking the object and using the drop-down menu. Or you can navigate using the tree navigation on the left and clicking on the button. You can also modify assigned Users or Groups by clicking on their respective buttons.


55 The Documents Section This section is where your uploaded documents can be viewed. You can also return to this section at any time by clicking on the section. As soon as you click on the Documents section, the application will ask you to choose which organization you would like to see. Choose the appropriate organization.


56 Click on the button to upload a new document into the application. A dialog box will pop up that looks like this: Click on the button to locate the file on your local environment. Give it a description and then click the button. You can then click on your document on the left navigation pane. You should see this in the content pane: To revise the file, simply upload a newer version of the file in the New Revision section. To rename or delete the document, add a new document, or view a document s history, right-click on the document name in the navigation pane and make your selection.
57 The Reports Section This section is where you can create/view reports in the application. You can also return to this section at any time by clicking on the section. There are eight out-of-the-box reports available for you to choose from: Scorecard Node Owner/Updater Report, Annual KPI Data Report, Scorecard Structure Report, Red KPI Report, Gray KPI Report, KPI Update Frequency Report, KPI Comparison Report, and the Action Plans Report. There is also a Report Writer that allows you to create and save your own custom report options and a Chart Writer that allows you to create and save your own custom charts. You can find all of these reports by clicking on the button. You will then see:

58 Scorecard Node Owner/Updater Report: This report will allow you to create and view Owners and/or Updaters associated with Users, Organizations, and Scorecards that you select.
59 Annual KPI Data Report: This report allows you to create and view annual KPI data based on the selections that you search: Scorecard Structure Report: This allows you to view a report outlining the structure of a Scorecard.
60 Red KPI Report: This allows you to view a report displaying the KPIs with red scores for a specific time period.
61 Gray KPI Report: This allows you to view a report displaying the KPIs with gray scores for a specific time period.

62 KPI Update Frequency Report: This allows you to view a report displaying the KPIs and their update frequency. KPI Comparison Report: This allows you to view a report displaying the KPIs from two or more similar Scorecards from different organizations side by side.
63 Action Plans Report: This allows you to view a report displaying Action Plans, Actions or Actions based on a specific set of parameters.

64 Report Writer: This feature allows you to create your own custom reporting. You can select as many or as few filters as you wish and then decide what columns you want to be displayed on the report.


65 Start by expanding the first step and then clicking on the the page. You will see the following: button at the top of Name: Allows you to filter based on the physical name of the node. You can choose contains any of the terms, contains all of the terms, begins with, or ends with. Description: Allows you to filter based on the description of the node. You can choose contains any of the terms, contains all of the terms, begins with, or ends with.

66 Scorecard Node Type: Allows you to filter based on the node type. You can choose Scorecard Root, Area of Contribution, KPI, Objective, Focus, or Linked. You can also have multiple choices selected here. Descendant Of: Allows you to choose any set of nodes that are subordinate to a particular node.


67 Color: Allows you to filter by any of the six colors for any calendar and any series of periods. Weight: Allows you to filter based on the set weight of a node. You can choose a number to match, either greater than or less than a number, or between any two numbers. Owners: Allows you to filter and search through the owners based on matching any or all terms as well as begins with or ends with.


68 Performance Trend: Allows you to filter on nodes with scores that are either trending upwards or downwards for a set of periods. (Trending upward means performance improved during the beginning and ending periods.) Specific Scorecard Nodes: Allows you to filter by choosing as many specific nodes as you require.


69 Score: Allows you to filter based on the score of a node. You can choose to match a number, either greater than or less than a number, or between two numbers for any set of calendar periods. Updater: Allows you to filter and search KPIs through updaters based on matching any or all terms as well as begins with or ends with. KPI Frequency: Allows you to filter KPIs by one or more of the calendar periods that have been created in the application.


70 Update Type: Allows you to filter by manual or calculated KPIs. Data Type: Allows you to filter by percentage, currency, or standard data types for KPIs. Aggregation Type: Allows you to filter KPIs by sum, average, or last value (already aggregated).


71 Import Mapping Key: Allows you to filter KPIs based on their uniquely assigned import mapping key. Value: Allows you to filter KPIs based on their specific values for any set of calendar periods. Scoring Type: Allows you to filter KPIs based on their scoring type.


72 Once you have selected the filters you want, use the drop-down menus and checkboxes in Step 2 to choose the columns to be displayed for your custom report. If you choose to display score, color, KPI value, KPI threshold, goal, variance to goal, % variance to goal, or % of goal, you will be prompted to define a calendar period. If you choose any period-specific data, Step 3 will allow you to chart your data in the report.

73 Click on the custom report. button at the bottom of the page and you will now see your new If you add this report to your bookmarks by using the Send To feature, you can always click on it from the Bookmarks section and you will have saved a new custom report. You can also click on the button and you can save this report to be used by anyone with View privileges to this organization. Saved reports can also be organized just like the Bookmarks tree by creating folders and dragging and dropping for clarity and ease.

74 Chart Writer: This allows you to create and view your own custom charts using the data found in Scoreboard. First, click the drop-down menu next to Line Chart. This will bring up a list of chart styles that are available. Chart Writer offers the following chart types: Line Chart; Bar Chart; Stacked Bar Chart; Stacked 100% Bar Chart; Stacked Area Chart; Pie Chart; Doughnut Chart; Polar Chart; Combination Chart.

75 Let s start with a Line Chart and Graph One Time Period. Click the to choose a scorecard node: button to get started. You will then have the opportunity

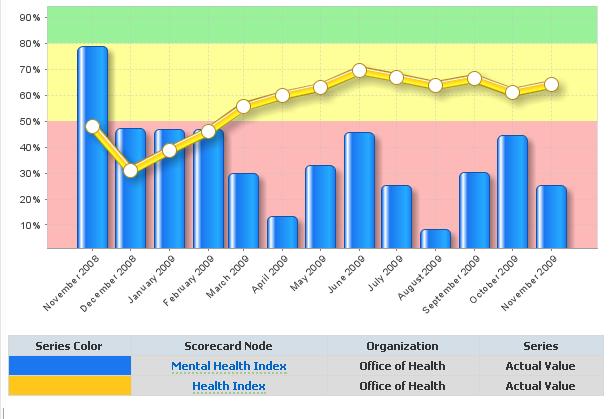
76 After you have chosen a node, you will see the chart: At the bottom of the screen are several drop-down menus. Use these menus to change chart type; compare more than one time period; select additional scorecard nodes; and to select Actual Value, Score, Red Flag, or Goal. You can also change the chart from Left Axis to Right Axis and add a Trendline Over Time. Additionally, you can change the time periods reflected in your chart to show monthly, quarterly, or yearly data and show calendar periods by date or relative to selected period. Finally, move the scroll bar at the bottom to show more or less time in your chart.
77

78 Here are just a few examples of different chart types, comparing different time periods. Bar Chart: Note that in the above example, 2008 and 2009 data are being compared.

79 Stacked 100% Bar Chart Note that in the above example 2008 and 2009 data are being compared.
80 Doughnut Chart: Note that in the above example, 2005 and 2008 data are being compared. Once you have finished creating your chart, you can save the chart or send it to your My Bookmarks section just like the Report Writer.

81 The Dashboard Section This is the section where you can create and store all of your Dashboards. Dashboards are powerful tools that allow you to show your data in Scoreboard by entering text, charts, strategy map bubbles, speedometers, and background images.
82 Creating Your Dashboard The first thing you will have to do is create a Dashboard. When choosing an organization that doesn t yet have a Dashboard, this is the first screen you will see when choosing the section: Click on the button to create a new Dashboard. Give it a name:

83 This will be the result:
84 Editing Your Dashboard Right click on your Dashboard name and you will see the following options. Select Edit. Now you can begin creating your Dashboard. By clicking on the icons across the top row, you can add speedometers, charts, strategy map bubbles, text, images, and a background image to your Dashboard. You will also see options to Arrange and Align. You can use Arrange if you are creating two or more items. Simply, select an item, click Arrange, and then choose one of the following:

85 To Align multiple items, either select the items you want by drawing them into a box across your screen or simply Control + Click to select them

86 This method is particularly useful if you want to select certain objects, but not others as above. Then, click Align and select from the following options.
87 You can also move and resize items on your Dashboard by clicking on them. If you want to delete an item, simply select the icon. As you complete your Dashboard, select either or and you will be prompted to save your Dashboard.
88 Adding a Gauge Click on the speedometer icon. A dialog box will open. Choose the node you want represented by your speedometer. Once you ve selected what you want reflected in your speedometer, your speedometer will appear on your screen. You will also see a second row of options. By default, Name will be selected. You can choose to add Organization, Score, Actual Value, and Thresholds to your speedometer.

89 Your screen will look something like this:


90 You can also select from one of the other gauge types. Instead of speedometer, let s select a horizontal bullet or slider. Then, select the node you want reflected in your horizontal bullet or slider. Once you ve selected what you want reflected in your horizontal bullet or slider, your horizontal bullet or slider will appear on your screen. You will also see a second row of options. Click on Label and select the labels that you want to add to your horizontal bullet or slider.
91 Your screen will now look something like this: The previous gauge is actually a horizontal slider. To change it into a horizontal bullet, simply select the object and click on Type. Select Bullet. To create a vertical slider or bullet, simply make your selection in the gauge dropdown menu and follow the same steps for adding Labels or switching Types.

92 Adding a Chart You can also add a chart to your Dashboard. Click the chart icon on top of your screen. To begin building your chart, select Chart Type.

93 Line Charts Scoreboard offers many different types of charts. In this case, we ve selected a Line Chart and have chosen Graph One Time Period. The next step is to click Series Data. This is where you select the nodes that you want reflected in your chart. You can select as many as you want. In this case, two nodes have been selected.
94 Next, select Time Periods. You can show monthly, quarterly, and yearly periods. You can display the data Relative to Selected Period, as above. In this case, move the slider to increase or decrease the number of periods displayed. You can also display the data By Date and move the slider to increase or decrease the months displayed. (Select quarterly or yearly to be able to move the slider to increase or decrease the quarters or years displayed.) Next, click on Threshold Background and make your selection. And finally, click Legend.

95 Your line chart will look something like this:

96 Bar Charts You can also add a Bar Chart to your Dashboard. Simply, click on the chart icon. Click Chart Type and select Bar Chart from the drop-down menu. Then choose either Graph One Time Period or Compare Time Periods. Next, click on Series Data. Select the scorecard nodes you want displayed in your Bar Chart. Remember, you can add as many nodes as you like.

97 Here, two scorecard nodes were selected.

98 Next, select Time Periods. You can show monthly, quarterly, and yearly periods. You can display the data Relative to Selected Period, as above. In this case, move the slider to increase or decrease the number of periods displayed. You can also display the data By Date and move the slider to increase or decrease the months displayed. (Select quarterly or yearly to be able to move the slider to increase or decrease the quarters or years displayed.) Next, click on Threshold Background and make your selection. And finally, click Legend.

99 Your Bar Chart will now look something like this: Scoreboard allows you to create many other chart types as well. The process is always the same. First click on the chart icon. Then, select chart type from the drop-down menu. Next, click on Series Data to choose the nodes you want reflected in your chart. Select Time Periods to determine the periods of time you want shown in your chart. Pick your Threshold Background and then choose the type of information you want in the Legend. Here are some examples of other chart types.

100 Stacked Bar Chart

101 Stacked 100% Bar Chart

102 Stacked Area Chart

103 Pie Chart* * Note that at the Series Data step, you can separate the sections of your pie chart. Simply, click Separate Section in the Series Data dialog box, below.

104 Your pie chart will then look like this:

105 Doughnut Chart

106 Polar Chart Combination Chart

107 Adding an Image You can add an image to your Dashboard. Click on the image icon. A drop-down list of downloaded images will appear. Select the image you want and it will appear in your Dashboard.

108
109 Adding Text Click the text box option to enter text on your Dashboard. Your screen will look like this: Begin typing your text in the text box. Use the tool bar for formatting options, including bold, italics, underline, and redline as well to arrange and align multiple text boxes, delete, align text, and undo/redo edits


110 Adding a Background Image You can also select a background image by clicking the arrow selector next to Add Background Image. A drop-down menu will appear. Select the image you want. Your screen will look like this:

111 Adding Strategy Map Bubbles You can add Strategy Map bubbles to your Dashboard by clicking the arrow selector next to the Strategy Map bubble icon. A dialog box will open. Choose which Strategy Map bubbles you want to see. Once you ve selected your Strategy Map bubble, it will appear on your screen in front of your background image. Continue selecting until you have added all the Strategy Map bubbles you want on your Dashboard.


112 Your screen will look something like this: Scoreboard also gives you the options to change the shape of your Strategy Map bubbles, select the font size, select a drilldown target, choose a label, and change the fill. Simply make your selections with the options below. You can use the Send To feature to send your Dashboards to a variety of locations. Just click in the upper right of your screen and select one of the following options.
Table of Contents (Hyperlinked)
") Version 2.5 User Guide Table of Contents (Hyperlinked) Getting Started Login Screen Navigating the Sections of QuickScore Icons My Bookmarks Section Briefing Pane Commonly Used Functions The Briefing Books
Version 2.5 User Guide Table of Contents (Hyperlinked) Getting Started Login Screen Navigating the Sections of QuickScore Icons My Bookmarks Section Briefing Pane Commonly Used Functions The Briefing Books
QuickScore. Version 2.3 User Guide. Table of Contents (Hyperlinked)
") QuickScore Version 2.3 User Guide Table of Contents (Hyperlinked) Getting Started Login Screen Navigating the Sections of QuickScore Icons My Bookmarks Section Administrator Message Briefing Pane Commonly
QuickScore Version 2.3 User Guide Table of Contents (Hyperlinked) Getting Started Login Screen Navigating the Sections of QuickScore Icons My Bookmarks Section Administrator Message Briefing Pane Commonly
Logging In. Use the link in the headed Trial Access and Instructions to reach the login panel. It will be in the format:
 Logging In This guide will help you get started with the application. It does not cover all of the functionality. Go to the last page for information about additional help. Use the link in the e-mail headed
Hands-On Lab. Lab: Developing BI Applications. Lab version: Last updated: 2/23/2011
 Hands-On Lab Lab: Developing BI Applications Lab version: 1.0.0 Last updated: 2/23/2011 CONTENTS OVERVIEW... 3 EXERCISE 1: USING THE CHARTING WEB PARTS... 5 EXERCISE 2: PERFORMING ANALYSIS WITH EXCEL AND
Mobileworld Touring Driver Roadmap Explore Scoreboard from Multiple User Perspectives October 23, 2017
 Mobileworld Touring Driver Roadmap Explore Scoreboard from Multiple User Perspectives October 23, 2017 www.spiderstrategies.com Preface Welcome to the Touring Driver Test Drive and Roadmap! This document
DecisionPoint For Excel
 DecisionPoint For Excel Getting Started Guide 2015 Antivia Group Ltd Notation used in this workbook Indicates where you need to click with your mouse Indicates a drag and drop path State >= N Indicates
Working with Analytical Objects. Version: 16.0
 Working with Analytical Objects Version: 16.0 Copyright 2017 Intellicus Technologies This document and its content is copyrighted material of Intellicus Technologies. The content may not be copied or derived
Creating KPIs/Measures - 1
 Creating KPIs/Measures - 1 KPIs (in Scoreboard) or Measures (in QuickScore) can be added at any level in a scorecard. KPIs/Measures are the engine of the scorecard. When you add actual values to KPIs/Measures,
ScholarOne Manuscripts. COGNOS Reports User Guide
 ScholarOne Manuscripts COGNOS Reports User Guide 1-May-2018 Clarivate Analytics ScholarOne Manuscripts COGNOS Reports User Guide Page i TABLE OF CONTENTS USE GET HELP NOW & FAQS... 1 SYSTEM REQUIREMENTS...
DOING MORE WITH EXCEL: MICROSOFT OFFICE 2013
 DOING MORE WITH EXCEL: MICROSOFT OFFICE 2013 GETTING STARTED PAGE 02 Prerequisites What You Will Learn MORE TASKS IN MICROSOFT EXCEL PAGE 03 Cutting, Copying, and Pasting Data Basic Formulas Filling Data
Creating Interactive PDF Forms
 Creating Interactive PDF Forms Using Adobe Acrobat X Pro for the Mac University Information Technology Services Training, Outreach, Learning Technologies and Video Production Copyright 2012 KSU Department
Advanced Reporting Tool
 Advanced Reporting Tool The Advanced Reporting tool is designed to allow users to quickly and easily create new reports or modify existing reports for use in the Rewards system. The tool utilizes the Active
Monitoring and Evaluation Tool
 Monitoring and Evaluation Tool USER MANUAL March, 2014 www.menarid.icarda.org THIS PAGE LEFT EMPTY INTENTIONALLY USER MANUAL Definitions and abbreviations Chart... Graphical representation of M&E project
Figure 1.1 GENESIS Log In Page
 TEACHERVUE User Guide Chapter One OVERVIEW OF THE TEACHERVUE SOFTWARE The TEACHERVUE software, frequently abbreviated TXP and also known as Teacher Experience, provides districts with an easy method to
Outlook: Web Access. Outlook: Web Access AIS Vienna
 Outlook: Web Access AIS Vienna Table of Contents Introduction to OWA...1 Log On... 1 OWA Workspace... 2 Hiding/Displaying the Reading Pane... 3 Collapsing/Expanding the Outlook Bar... 4 Log Off... 5 Sending
FIN 850: UDW+ Finance Ad Hoc Reports Training Version 2.9
 FIN 850: UDW+ Finance Ad Hoc Reports Training Version 2.9 Program Services Office & Decision Support Group Table of Contents Subject Areas... 1 Criteria... 2 Exercise 1: Create a Budget Summary Report...
Keynote 08 Basics Website:
 Website: http://etc.usf.edu/te/ Keynote is Apple's presentation application. Keynote is installed as part of the iwork suite, which also includes the word processing program Pages and the spreadsheet program
Customizing and Administering Project Server Access
 WEB Customizing and Administering Project Server Access In this chapter Creating and Deleting Users from Project Server 2 Managing User Groups Project Server User Security 4 Using Categories to Control
Cougar Mountain Software Dashboards
 Cougar Mountain Software Dashboards Cougar Dtails User s Guide Copyright Notification At Cougar Mountain Software, Inc., we strive to produce high-quality software at reasonable prices. We can only do
CCRS Quick Start Guide for Program Administrators. September Bank Handlowy w Warszawie S.A.
 CCRS Quick Start Guide for Program Administrators September 2017 www.citihandlowy.pl Bank Handlowy w Warszawie S.A. CitiManager Quick Start Guide for Program Administrators Table of Contents Table of Contents
SPS Commerce Dashboards & Alerts User Guide
 SPS Commerce Dashboards & Alerts User Guide 1 Table of Contents Introduction... 3 Additional Resources... 3 Logging In... 4 Changing your password... 4 The Portal Homepage... 5 Administration... 5 My Reports...
USER MANUAL. Contents. Analytic Reporting Tool Basic for SUITECRM
 USER MANUAL Analytic Reporting Tool Basic for SUITECRM Contents ANALYTIC REPORTING TOOL FEATURE OVERVIEW... 2 PRE-DEFINED REPORT LIST AND FOLDERS... 3 REPORT AND CHART SETTING OVERVIEW... 5 Print Report,
Numbers Basics Website:
 Website: http://etc.usf.edu/te/ Numbers is Apple's new spreadsheet application. It is installed as part of the iwork suite, which also includes the word processing program Pages and the presentation program
DATA WAREHOUSE BASICS
 DATA WAREHOUSE BASICS A Software Overview using the Retail Golf Model with version 9 NOTE: This course material was developed using Hummingbird version 9 with Windows XP. There will be navigational differences
econnect Baccarat User Guide EC7 June 2017
 econnect Baccarat User Guide EC7 June 2017 Table of Contents Baccarat Camera View A. Card Displayed on Virtual Table B. Bet Session Recording C. How to open a camera D. What is displayed on Data View E.
Expedient User Manual Getting Started
 Volume 1 Expedient User Manual Getting Started Gavin Millman & Associates Pty Ltd 281 Buckley Street Essendon VIC 3040 Phone 03 9331 3944 Web www.expedientsoftware.com.au Table of Contents Logging In...
MICROSOFT EXCEL TUTORIAL
 MICROSOFT EXCEL TUTORIAL G E T T I N G S T A R T E D Microsoft Excel is one of the most popular spreadsheet applications that helps you manage data, create visually persuasive charts, and thought-provoking
Learn more about Pages, Keynote & Numbers
 Learn more about Pages, Keynote & Numbers HCPS Instructional Technology May 2012 Adapted from Apple Help Guides CHAPTER ONE: PAGES Part 1: Get to Know Pages Opening and Creating Documents Opening a Pages
To access BuckIQ, you must first be granted access. Send requests for permission to
 BuckIQ User s Guide Job Aid What is BuckIQ? Several years ago, Oracle took a look at the state of the Business Intelligence industry in terms of the different processes and applications that were required
General User Manual. Copyright , Better Days Enterprises, LLC West Main Street #119 Rapid City, SD
 General User Manual Copyright 2008-2012, Better Days Enterprises, LLC. 3213 West Main Street #119 Rapid City, SD 57702-2314 Revision: February 4, 2012 Version: 1.917 CleverQ General User Manual Table of
AMP User Manual Reports
 AMP User Manual Reports AMP s reporting capabilities are designed to allow you the ability to create various types of customized reports that organize data in the way you need it presented. It is worth
Steps: 1. Log in to the Dmitri application through the following website URL, as appropriate:
 Dmitri Suite Getting Started Logging In and Logging Out Logging In Use the following steps to log in to the Dmitri application. Steps: 1. Log in to the Dmitri application through the following website
Excel Select a template category in the Office.com Templates section. 5. Click the Download button.
 Microsoft QUICK Excel 2010 Source Getting Started The Excel Window u v w z Creating a New Blank Workbook 2. Select New in the left pane. 3. Select the Blank workbook template in the Available Templates
Site Owners: Cascade Basics. May 2017
 Site Owners: Cascade Basics May 2017 Page 2 Logging In & Your Site Logging In Open a browser and enter the following URL (or click this link): http://mordac.itcs.northwestern.edu/ OR http://www.northwestern.edu/cms/
Creating and Modifying Charts
 Creating and Modifying Charts Introduction When you re ready to share data with others, a worksheet might not be the most effective way to present the information. A page full of numbers, even if formatted
NEXTIVA ANALYTICS USER GUIDE. nextiva.com/support
 NEXTIVA ANALYTICS USER GUIDE nextiva.com/support Contents Logging In... 2 Landing Page... 2 Reporting... 3 Total Count Chart... 4 Count by Day Chart... 4 Hourly Average Chart... 4 Counts by State Chart...
Microsoft Excel 2007
 Learning computers is Show ezy Microsoft Excel 2007 301 Excel screen, toolbars, views, sheets, and uses for Excel 2005-8 Steve Slisar 2005-8 COPYRIGHT: The copyright for this publication is owned by Steve
MicroStrategy Academic Program
 MicroStrategy Academic Program Creating a center of excellence for enterprise analytics and mobility. ENTERPRISE-READY DATA DISCOVERY APPROXIMATE TIME NEEDED: 1 HOUR microstrategy.com 1 INTRODUCTION BikePort,
Introduction to Microsoft Excel 2010
 Introduction to Microsoft Excel 2010 THE BASICS PAGE 02! What is Microsoft Excel?! Important Microsoft Excel Terms! Opening Microsoft Excel 2010! The Title Bar! Page View, Zoom, and Sheets MENUS...PAGE
Intermediate Microsoft Excel
 Intermediate Microsoft Excel Class learning objectives By the end of class, students should be able to perform the following tasks in Microsoft Word: 1. Completing a Series 2. Review of Excel Basics Create
DOING MORE WITH EXCEL: MICROSOFT OFFICE 2010
 DOING MORE WITH EXCEL: MICROSOFT OFFICE 2010 GETTING STARTED PAGE 02 Prerequisites What You Will Learn MORE TASKS IN MICROSOFT EXCEL PAGE 03 Cutting, Copying, and Pasting Data Filling Data Across Columns
Lesson 1: Creating and formatting an Answers analysis
 Lesson 1: Creating and formatting an Answers analysis Answers is the ad-hoc query environment in the OBIEE suite. It is in Answers that you create and format analyses to help analyze business results.
ANALYTICS. Performance User Guide. Volume 1
 ANALYTICS Performance User Guide Volume 1 September, 2015 2 TABLE OF CONTENTS Introduction 9 Additional Resources 9 Logging In 11 Changing your password 11 The Portal Homepage 12 Administration 12 My Reports
Intellicus Enterprise Reporting and BI Platform
 Designing Adhoc Reports Intellicus Enterprise Reporting and BI Platform Intellicus Technologies info@intellicus.com www.intellicus.com Designing Adhoc Reports i Copyright 2012 Intellicus Technologies This
Excel 2003 Tutorial II
 This tutorial was adapted from a tutorial by see its complete version at http://www.fgcu.edu/support/office2000/excel/index.html Excel 2003 Tutorial II Charts Chart Wizard Chart toolbar Resizing a chart
User Manual. perfectionlearning.com/technical-support
 User Manual perfectionlearning.com/technical-support 1 User Manual Accessing Math X... 3 Login... 3 Forgotten Password... 3 Navigation Menu... 4 Logout... 4 Admin... 5 Creating Classes and Students...
Introduction to Microsoft Office PowerPoint 2010
 Introduction to Microsoft Office PowerPoint 2010 TABLE OF CONTENTS Open PowerPoint 2010... 1 About the Editing Screen... 1 Create a Title Slide... 6 Save Your Presentation... 6 Create a New Slide... 7
Excel 2013 Intermediate
 Excel 2013 Intermediate Quick Access Toolbar... 1 Customizing Excel... 2 Keyboard Shortcuts... 2 Navigating the Spreadsheet... 2 Status Bar... 3 Worksheets... 3 Group Column/Row Adjusments... 4 Hiding
How to lay out a web page with CSS
 Activity 2.6 guide How to lay out a web page with CSS You can use table design features in Adobe Dreamweaver CS4 to create a simple page layout. However, a more powerful technique is to use Cascading Style
USER MANUAL. Contents. Advanced Reporting Tool PRO for vtiger
 USER MANUAL Advanced Reporting Tool PRO for vtiger Contents Contents... 1 ADVANCED REPORTING TOOL FEATURE OVERVIEW... 2 PRE-DEFINED REPORT LIST AND FOLDERS... 3 REPORT AND CHART SETTINGS OVERVIEW... 5
Excel 2013 Workshop. Prepared by
 Excel 2013 Workshop Prepared by Joan Weeks Computer Labs Manager & Madeline Davis Computer Labs Assistant Department of Library and Information Science June 2014 Excel 2013: Fundamentals Course Description
How to use the Sales Based Availability Dashboard
 How to use the Sales Based Availability Dashboard Supplier Guide Sept 2017 v1 1 Contents What is Sales Based Availability and why is it important?... 3 How is Sales Based Availability calculated and how
Veco User Guides. Grids, Views, and Grid Reports
 Veco User Guides Grids, Views, and Grid Reports Introduction A Grid is defined as being a list of data records presented to the user. A grid is shown generally when an option is selected from the Tree
RL6 - WORKING WITH REPORTS
 RL6 - WORKING WITH REPORTS If you have RL6 Risk questions please contact: RL_support@wrha.mb.ca or (204) 926-1070 WRHA Quality Improvement & Patient Safety Version: 3.0, November 2, 2018 WORKING WITH REPORTS
Overview and Instructions
 AE Mobility Tracking Tool July 30, 2013 Overview and Instructions Sheet-specific Instructions Welcome Instructions Common Qs & As MobilityLog & Data Entry Reports: Graphs & Charts Data for Website Entry
Product Documentation SAP Business ByDesign August Analytics
 Product Documentation PUBLIC Analytics Table Of Contents 1 Analytics.... 5 2 Business Background... 6 2.1 Overview of Analytics... 6 2.2 Overview of Reports in SAP Business ByDesign... 12 2.3 Reports
Master Reports Guide. Table of Contents
 Table of Contents Welcome to Master Reports... 2 Report Basics... 2 Access Reports... 2 Download or Print a Report... 2 Report Help... 2 Save or Share a Report... 2 Master Report Formulas... 3 Filter a
Select the desired program, then the report and click the View Report button. The FSS Dashboard will appear as 87 NJ2024_FSS_DB_MenuPage.
 Introduction The NJ2024 FSS Dashboard is a quarterly report covering a wide variety of metrics that relate to the FSS population. (NJ2024 is the reference number assigned to this report.) The report will
User Guide. Version Exago Inc. All rights reserved.
 User Guide Version 2016.2 2016 Exago Inc. All rights reserved. Exago Reporting is a registered trademark of Exago, Inc. Windows is a registered trademark of Microsoft Corporation in the United States and
Introductory Excel Walpole Public Schools. Professional Development Day March 6, 2012
 Introductory Excel 2010 Walpole Public Schools Professional Development Day March 6, 2012 By: Jessica Midwood Agenda: What is Excel? How is Excel 2010 different from Excel 2007? Basic functions of Excel
Data Explorer: User Guide 1. Data Explorer User Guide
 Data Explorer: User Guide 1 Data Explorer User Guide Data Explorer: User Guide 2 Contents About this User Guide.. 4 System Requirements. 4 Browser Requirements... 4 Important Terminology.. 5 Getting Started
EXCEL 2007 TIP SHEET. Dialog Box Launcher these allow you to access additional features associated with a specific Group of buttons within a Ribbon.
 EXCEL 2007 TIP SHEET GLOSSARY AutoSum a function in Excel that adds the contents of a specified range of Cells; the AutoSum button appears on the Home ribbon as a. Dialog Box Launcher these allow you to
My Sysco Reporting Job Aid for CMU Customers. My Sysco Reporting. For CMU Customers (Serviced by Program Sales)
") My Sysco Reporting For CMU Customers (Serviced by Program Sales) 1 Accessing My Sysco Reporting... 2 Logging In... 2 The Reporting Dashboard... 3 My Sysco Reporting Process... 6 Generating a Report...
My Sysco Reporting For CMU Customers (Serviced by Program Sales) 1 Accessing My Sysco Reporting... 2 Logging In... 2 The Reporting Dashboard... 3 My Sysco Reporting Process... 6 Generating a Report...
MicroStrategy Desktop
 MicroStrategy Desktop Quick Start Guide MicroStrategy Desktop is designed to enable business professionals like you to explore data, simply and without needing direct support from IT. 1 Import data from
Doc. Version 1.0 Updated:
 OneStop Reporting Report Designer/Player 3.5 User Guide Doc. Version 1.0 Updated: 2012-01-02 Table of Contents Introduction... 3 Who should read this manual... 3 What s included in this manual... 3 Symbols
CROMWELLSTUDIOS. Content Management System Instruction Manual V1. Content Management System. V1
 Content Management System Instruction Manual V1 www.cromwellstudios.co.uk Cromwell Studios Web Services Content Management System Manual Part 1 Content Management is the system by which you can change
Project and Portfolio Management Center
 Project and Portfolio Management Center Software Version: 9.42 Getting Started Go to HELP CENTER ONLINE http://admhelp.microfocus.com/ppm/ Document Release Date: September 2017 Software Release Date: September
PST for Outlook Admin Guide
 PST for Outlook 2013 Admin Guide Document Revision Date: Sept. 25, 2015 PST Admin for Outlook 2013 1 Populating Your Exchange Mailbox/Importing and Exporting.PST Files Use this guide to import data (Emails,
Chapter 2 Using Slide Masters, Styles, and Templates
 Impress Guide Chapter 2 Using Slide Masters, Styles, and Templates OpenOffice.org Copyright This document is Copyright 2007 by its contributors as listed in the section titled Authors. You can distribute
OBIEE. Oracle Business Intelligence Enterprise Edition. Rensselaer Business Intelligence Finance Author Training
 OBIEE Oracle Business Intelligence Enterprise Edition Rensselaer Business Intelligence Finance Author Training TABLE OF CONTENTS INTRODUCTION... 1 USER INTERFACE... 1 HOW TO LAUNCH OBIEE... 1 TERMINOLOGY...
3.2 Circle Charts Line Charts Gantt Chart Inserting Gantt charts Adjusting the date section...
 / / / Page 0 Contents Installation, updates & troubleshooting... 1 1.1 System requirements... 2 1.2 Initial installation... 2 1.3 Installation of an update... 2 1.4 Troubleshooting... 2 empower charts...
Introduction to Microsoft Publisher
 Class Description This is an introduction to Microsoft Publisher, with a focus on choosing a template and modifying it to meet your needs. Class Length One and one half (1½) hours Introduction to Microsoft
ADMINISTRATIVE USER GUIDE FOR THE APTI-LEARN LEARNING MANAGEMENT SYSTEM (LMS)
") ADMINISTRATIVE USER GUIDE FOR THE APTI-LEARN LEARNING MANAGEMENT SYSTEM (LMS) Software Version 2.6 September 2012 Prepared by EM-Assist This page left intentionally blank. Software Version 2.6; Document
ADMINISTRATIVE USER GUIDE FOR THE APTI-LEARN LEARNING MANAGEMENT SYSTEM (LMS) Software Version 2.6 September 2012 Prepared by EM-Assist This page left intentionally blank. Software Version 2.6; Document
EDITING AN EXISTING REPORT
 Report Writing in NMU Cognos Administrative Reporting 1 This guide assumes that you have had basic report writing training for Cognos. It is simple guide for the new upgrade. Basic usage of report running
Portfolios Creating and Editing Portfolios... 38
 Portfolio Management User Guide 16 R1 March 2017 Contents Preface: Using Online Help... 25 Primavera Portfolio Management Overview... 27 Portfolio Management Software for Technology Leaders... 27 Solution
INSERVICE. Version 5.5. InService Easily schedule and monitor attendance for your training programs, even at remote locations.
 INSERVICE Version 5.5 InService Easily schedule and monitor attendance for your training programs, even at remote locations. 5/15/2014 Page 0 of 11 Table of Contents 1.1 Logging In... 2 1.2 Navigation...
Installation 3. PerTrac Reporting Studio Overview 4. The Report Design Window Overview 8. Designing the Report (an example) 13
 13") Contents Installation 3 PerTrac Reporting Studio Overview 4 The Report Design Window Overview 8 Designing the Report (an example) 13 PerTrac Reporting Studio Charts 14 Chart Editing/Formatting 17 PerTrac
Contents Installation 3 PerTrac Reporting Studio Overview 4 The Report Design Window Overview 8 Designing the Report (an example) 13 PerTrac Reporting Studio Charts 14 Chart Editing/Formatting 17 PerTrac
EXCEL 2003 DISCLAIMER:
 EXCEL 2003 DISCLAIMER: This reference guide is meant for experienced Microsoft Excel users. It provides a list of quick tips and shortcuts for familiar features. This guide does NOT replace training or
Working with Charts Stratum.Viewer 6
 Working with Charts Stratum.Viewer 6 Getting Started Tasks Additional Information Access to Charts Introduction to Charts Overview of Chart Types Quick Start - Adding a Chart to a View Create a Chart with
EMPLOYER USER GUIDE PLEASE NOTE
 EMPLOYER USER GUIDE Getting Started... Error! Bookmark not defined. Request Log-In Permission... 3 Log In... 4 My Control Panel... 5 Post a New Job... Error! Bookmark not defined. Review Employee Applications...
VisualPST 2.4. Visual object report editor for PowerSchool. Copyright Park Bench Software, LLC All Rights Reserved
 VisualPST 2.4 Visual object report editor for PowerSchool Copyright 2004-2015 Park Bench Software, LLC All Rights Reserved www.parkbenchsoftware.com This software is not free - if you use it, you must
Using Reports and Graphs
 Using Reports and Graphs Information in this section explains how to generate and use PCS Axis reports and graphs. The information is intended for PCS Axis users with SysAdmin, User, and Read Only user
Table of Contents. Page 2 of 72. High Impact 4.0 User Manual
 Table of Contents Introduction 5 Installing High Impact email 6 Installation Location 6 Select Mail Client 6 Create a ReadyShare Account 6 Create a Default Profile 6 Outlook Configuration Message 6 Complete
Introduction to Microsoft Office 2007
 Introduction to Microsoft Office 2007 What s New follows: TABS Tabs denote general activity area. There are 7 basic tabs that run across the top. They include: Home, Insert, Page Layout, Review, and View
Chapter 2: Clients, charts of accounts, and bank accounts
 Chapter 2: Clients, charts of accounts, and bank accounts Most operations in BankLink Practice are client specific. These include all work on coding transactions, reporting, and maintaining chart of accounts
POWERPOINT Build a Presentation to Remember
 POWERPOINT 2007 Build a Presentation to Remember Microsoft Office 2007 TABLE OF CONTENTS DOCUMENT THEMES... 1 THEMES... 1 COLOR SETS... 1 FONT SETS... 1 MASTER SLIDES... 2 USING THEMES IN THE SLIDE MASTER...
Section 1 Microsoft Excel Overview
 Course Topics: I. MS Excel Overview II. Review of Pasting and Editing Formulas III. Formatting Worksheets and Cells IV. Creating Templates V. Moving and Navigating Worksheets VI. Protecting Sheets VII.
New Finance Officer & Staff Training
 New Finance Officer & Staff Training Overview MUNIS includes many programs and tools to allow for the management of the District financials. As newer finance officers and staff, you are charged with understanding,
Ministry of Education
 Ministry of Education EFIS 2.0 - User Version 2.0 June 2015 Table of Contents 1 Document History... 4 2 Logon to EFIS 2.0... 5 2.1 Logon through Go Secure... 5 2.2 Bookmarking the Link... 6 3 Planning
Introduction to the MODx Manager
 Introduction to the MODx Manager To login to your site's Manager: Go to your school s website, then add /manager/ ex. http://alamosa.k12.co.us/school/manager/ Enter your username and password, then click
The first thing we ll need is some numbers. I m going to use the set of times and drug concentration levels in a patient s bloodstream given below.
 Graphing in Excel featuring Excel 2007 1 A spreadsheet can be a powerful tool for analyzing and graphing data, but it works completely differently from the graphing calculator that you re used to. If you
HTML REPORT VIEWER. Intellicus Enterprise Reporting and BI Platform. Intellicus Technologies
 HTML REPORT VIEWER Intellicus Enterprise Reporting and BI Platform Intellicus Technologies info@intellicus.com www.intellicus.com HTML Viewer i Copyright 2012 Intellicus Technologies This document and
This Tutorial is for Word 2007 but 2003 instructions are included in [brackets] after of each step.
![This Tutorial is for Word 2007 but 2003 instructions are included in [brackets] after of each step.](/thumbs/72/67280806.jpg "This Tutorial is for Word 2007 but 2003 instructions are included in [brackets] after of each step.") This Tutorial is for Word 2007 but 2003 instructions are included in [brackets] after of each step. Table of Contents Just so you know: Things You Can t Do with Word... 1 Get Organized... 1 Create the
This Tutorial is for Word 2007 but 2003 instructions are included in [brackets] after of each step. Table of Contents Just so you know: Things You Can t Do with Word... 1 Get Organized... 1 Create the
On the Web sun.com/aboutsun/comm_invest STAROFFICE 8 DRAW
 STAROFFICE 8 DRAW Graphics They say a picture is worth a thousand words. Pictures are often used along with our words for good reason. They help communicate our thoughts. They give extra information that
EFIS User Guide Family Support Programs User
 Ministry of Education EFIS 2.0 - User Guide Family Support Programs User Version 2.0 June 2015 Table of Contents 1 Document History... 1 2 Logon to EFIS 2.0... 2 2.1 Logon through Go Secure... 2 2.2 Bookmarking
Academic Student Learning Outcomes Assessment Management System TracDat v5
 Academic Student Learning Outcomes Assessment Management System TracDat v5 Director of Assessment - Diane Beaudoin beaudoin@purdue.edu TracDat Coordinators Ada Uche: auche@purdue.edu Dan Whiteley: dan@purdue.edu
HOSTED CONTACT CENTRE
 ---------------------------------------------------------------------------- ------ HOSTED CONTACT CENTRE ANALYTICS GUIDE Version 9.4 Revision 1.0 Confidentiality and Proprietary Statement This document
AN INTRODUCTION TO OUTLOOK WEB ACCESS (OWA)
") INFORMATION TECHNOLOGY SERVICES AN INTRODUCTION TO OUTLOOK WEB ACCESS (OWA) The Prince William County School Division does not discriminate in employment or in its educational programs and activities against
INFORMATION TECHNOLOGY SERVICES AN INTRODUCTION TO OUTLOOK WEB ACCESS (OWA) The Prince William County School Division does not discriminate in employment or in its educational programs and activities against
User Guide. Web Intelligence Rich Client. Business Objects 4.1
 User Guide Web Intelligence Rich Client Business Objects 4.1 2 P a g e Web Intelligence 4.1 User Guide Web Intelligence 4.1 User Guide Contents Getting Started in Web Intelligence 4.1... 5 Log into EDDIE...
Word Select New in the left pane. 3. Select Blank document in the Available Templates pane. 4. Click the Create button.
 Microsoft QUICK Word 2010 Source Getting Started The Word Window u v w x z Opening a Document 2. Select Open in the left pane. 3. In the Open dialog box, locate and select the file you want to open. 4.