Tutorial for mapping Census 2016 data in Qgis by census tracts
|
|
|
- Jonathan Foster
- 5 years ago
- Views:
Transcription
1 Tutorial for mapping Census 2016 data in Qgis by census tracts Skills you will learn: How to join a Census 2016 map layer to a Census 2016 non-map layer, based on a common joining field shared by the two tables. The data in the joined tables and the location of the census tracts can be analysed for newsworthy trends. If you are unfamiliar with the basic functionality of QGIS, such as how to add map layers and other data tables to the map document, please review the tutorial A Quick Tour of QGIS Desktop, which you can access by clicking here. We will be using version If you re using a different version, there may be some minor differences in the interface, but the functionality remains the same. Getting started Census tracts (CTs) are among the smallest of geographic areas that have populations between 2,500 and 8,000 people. The tracts allow journalists looking for Census-related stories to see patterns at the neighborhood level. Census tracts are located census metropolitan areas. Statistics Canada points out the many ways in which census tracts and the data inside them can be used: municipalities evaluating and revising their officials plans; high schools and post-secondary institutions conducting research; companies evaluating areas to conduct marketing campaigns, build recreational facilities or retail outlets. Journalists can use similar research techniques to find stories. It is for these reasons that Statistics Canada s 2016 Census Program releases are extremely valuable. For instance, knowing the neighborhoods with the fastest growth rates in high- or low-income

2 earners, new housing or, in the case of this tutorial, visible minorities, allows newsrooms to know where to conduct interviews. So, let s get started! Add the map layer and the non-geographic layer to the data frame. For the purposes of this illustration, we are using a shapefile of all census tracts in Canada and a dataset of visible minorities from the 2016 census. To obtain the zip folder with these contents, please click here. Be sure to save the file in the folder for this tutorial. Once you ve downloaded it into the folder, unzip the file, which will look like this: Page 121 of The Data Journalist explains the shape file and the role of its component parts. The screen shot below is what the csv table looks like when opened in Excel. You can download the table by clicking here. Be sure to save the file in the folder used for this tutorial.

3 Importing files into QGIS

4 Open Qgis and select the Add Vector Layer icon.
5 Browse to the folder that contains the shape file, and choose the layer with the.shp extension. Your layer will look like this: Only parts of the country are represented in Qgis data frame to the right. Remember, census tracts are geographic areas located in the country s largest census metropolitan areas of more than 100,000 people. To see the data behind the layer, right-click on its icon in the menu to the left, and select the Open Attribute Table from the shortcut menu.

6

7 The first field is the one we will join to the layer that contains the data for visible minorities. Ten characters in length, a CTUID is a unique identifier for a census tract within a census metropolitan area. Close the attribute table. And use the Add Delimited Text Layer option to browse for, and then import our csv file.
8

9 Qgis defaults to the csv file format. Text file can also be in other formats like tab delimited, which you can locate by clicking the radio

10 button to the left of Custom delimiters. But, this is a csv file, so we ll stick with that format, and make sure that the radio button to the left of No geometry (attribute only table) option is selected.

11

12

13 Open the csv layer s attribute table. You ll notice that it s identical to the file we opened in Excel. We ll join the CT_UID field to the CTUID field in the shape file, but not before we do bit of formatting. In order to edit the numbers in the csv layer, we must make a copy. Return to the menu, right-click on the Visible Minorities layer, and select Save as.

14

15 Make sure the file format is Comma Separated Value (CSV), and select the radio button to the left of the Add saved file to map option. Browse to the folder for this tutorial and save the file with a name that makes sense. Scroll to the dialogue box s Layer Options section, select the YES option from the drop-down menu to the right of
16 CREATE_CSVT. The csvt file is a helper file that Qgis needs to properly format the numbers. Also select the default from the drop-down menu to the right of GEOMETRY.

17 Make sure the selections in your save vector layer as dialogue box match those in the screen shot below.

18 Open the attribute table for your new csv file. Because we don t need the original VisibleMinorities csv layer, we can remove it from the Layers Panel by right-clicking and selecting the

19 Remove option, or simply leave it in place. Before joining two layers, we must reformat the numbers in the census tract identification fields for both layers. Let s begin with the new csv layer that we created. Open the attribute table and select the Open field calculator icon at the top right-hand corner of the table s menu.


20

21 Click the radio button to the left of Create virtual field and type CT_UID_New to the right of Output field name.

22 Click the + sign for the Fields and Values from the menu on the right, and double-click the CT_UID column so it appears to the left.

23 Click the downward arrow to obtain the drop-down menu to the right of Output field name and select Decimal number (real)

24 Leave the Output length as 10. Increase the precision from zero to 2. Before selecting OK, it s important to explain what we ve done. In order to execute a join in Qgis, or any other database program like MySQL or Microsoft s Access, the columns must contain similarly formatted data. For numbers, they must be integers, or for this tutorial, decimal numbers. So, let s continue.

25 Select OK to return to the attribute table. Our new column is on the far right. We must perform the same task with our census tract shape file.


26 Open the attribute table. Repeat the same steps to reformat field CTUID.

27 Now we have two matching census tract identifications fields. Return to Qgis Layers Panel menu, and select the shape file layer. Right-click, and select Properties from the short-cut menu.
28 Select the Joins option.

29

30 Click the green + sign. The layer identified in the Add vector join dialogue box is the csv file we re about to join to the shape file. All that s left is to tell Qgis which fields we want to join, which will be the new ones we ve created. Select the CT_UID_NEW field from the

31 drop-down menu.

32 And the CTUID_NEW field from our shape file.

33 You should now have the two matching fields to be joined.
34 Select OK. Select Apply and OK.
35 Open the attribute table to see the joined tables.

36 Before assigning colours to values, give some thought to the focus of your story. If you re in a particular city, you d want to colour-code the census tracts for that area in order to spot the neighborhoods of interest fastest growth, zero growth, declines, and so on. For instance, we may choose to do a story about an area of the city were visible minorities are leaving. Let s focus on the nation s capital, Ottawa. Leave the attribute table open. We ll use an SQL query to select the Ottawa census tracts, which we will save as a new layer. Sort the CMANAME column in descending order and scroll down to Ottawa. Because the national capital region spans both sides of the Ottawa River to take in Ontario and Quebec, we only want the Ontario section. To the left of the CMANAME column is the CMAPUID for the region, which is Now we can run a query that will select the CMAs, or Census Metropolitan Areas, numbered Hover your mouse over the Select features using an expression icon above the table towards the left-


37 hand side. Click the + sign to the left of Fields and Values on the dialogue box s right-hand side.

38 Click the = tab above CMAPUID, and then type the numer 35505, bracketed by single quotes.

39 Click the Select tab a the bottom right.

40 You ll notice that all the rows with the CMAPUID number have been selected. Close the dialogue box. Now we want to save a new layer with only those selected identification numbers.

41 Right-click on the layer, and select Save As from the short-cut menu. The new layer s format will be a shape file, so make sure that option is selected. Browse to the folder for this tutorial and name the file something like Visible_Minorities_In_Ottawa.

42 Be sure to select Save only selected features. Neglecting to check this box is an easy mistake to make. However, if you don t select it, then you simply end up re-saving the entire file.

43 In the Select fields to export and their export options section, you can deselect the columns that you don t want to appear in your new layer. Let s just leave all the fields selected. Before saving, make sure that the box to the left of Add saved file to map layer is checked off. Double check all of your steps ( a good habit to get into for each step in the process ) before selecting the OK tab.

44 A message indicating success will briefly appear. To your left, you ll notice the new layer. Deslect the first layer, right-click on your new layer, and choose the Zoom to layer option in order to see the Ottawa census tracts.

45

46 Note, your default colour will likely be different. The uniform colour might make you think nothing has happened. However, that s because we must symbolize, or create a colour scheme that assigns colours on a grid to specific ranges of values. Before we assign values to differentiate census tracts, we ll have to clean up the numbers in our new layer s attribute table, add a new column, and then rename some columns.


47 Open the attribute table. There are too many decimal points in the percent difference column, which Qgis has renamed VisibleM_3. (more on the reason for this a bit later in this tutorial). Select the Open field calculator icon.

48 Give your field a new name, make the field type a decimal number with a precision of 2, and select the VisibleM_3 column.


49 If your dialogue box looks like this, select the OK tab to return to the attrbute table. Now we can fix the titles for our VisibleM_1 and VisibleM_2 fields.
50 The first column to the left represents the 2016 values. The second, The third is the field that contains the percent difference, which was refomatted with two decimal places in the previous step. Close the attribute table, right click on the layer. Go to Properties.

51 Select the Fields icon in the vertical menu to the left.

52 We will rename VisibleM_1 and Visible_2. Double-click the cell in the Alias column and type 2016 and 2011, respectively.

53 Select Apply and OK. Return to the attribute table to see the renamed columns. So far, for each census tract, we have visible minority numbers for 2016, 2011 and the percent differences. This means that we can eventually assign column colours based on numeric values in each of these fields. However, before doing this, let s create one more column -- the growth or decrease from 2011 to In a spreadsheet, we would just create a new column, and calculate using the - operator to obtain the difference. In Qgis, we can do the same thing using an SQL expression.

54 Select the Open field calculator icon to obtain the Field calculator dialogue box. Call the new field Diff

55 Select VisibleM_1, the - operator, and then VisibleM_2. (NOTE: The field calculator dialogue box loses the aliases we created in the previous step.) Your dialogue box should resemble this screen shot.

56 Return to the attribute table. Now we have a new column with the raw differences between 2011 and We are ready to symbolize, or assign colours, to our values we choose to write about.

57 Close the attribute table, right-click on your layer, chose Properties from the short-cut menu to produce your Layer Properties dialogue box, and then the Style section.

58 Just below the Single symbol option at the top, click the arrow to obtain the drop-down menu. Choose Graduated. And click the arrow to right of the rectangular box beside Column to obtain a drop-down menu.


59 Qgis defaults to five Classes or categories, which we can increase or decrease.

60 Select the Classify tab. Qgis defaults to the blue colour ramp, which you can change by clicking on the colour to the right of Colour ramp. We can also change the intervals between the numbers so that the census tracts with the negative growth are one category. Qgis will only display the columns with numeric values. In this step, the aliases we ve created for the new columns have been preserved, making it easier to determine which column contains the values we want to display on our map. Let s choose the percent differences, which will allow us to symbolize, or colour-code, the census tracts that experienced the fastest growth between 2011 and 2016.

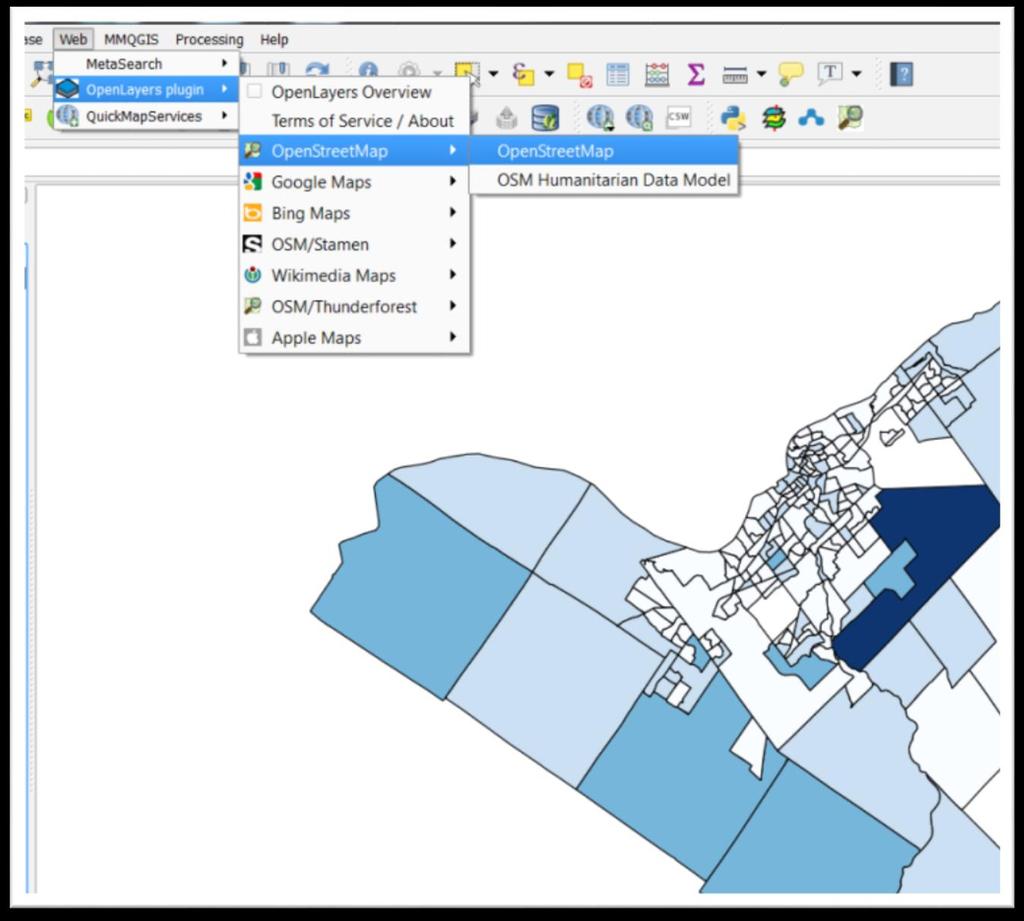
61 If we re happy with our choice, select Apply, and then OK. Let s add an OpenStreetLayers base map. If you don t have it, go to the Plugins section of the menu, select Manage and Install Plugins, and search for OpenLayers and Quick Finder. Click Install plugin.
62


63 Click on the OpenStreetMap layer label and drag it to the bottom of the menu.

64 The darkest colours are the areas with the highest growth. To see the actual data, select the Identify Features icon above the map.

65 Make sure the Visible_Minorities_In_Ottawa layer is highlighted, then click the dark blue census tract. The census tract s information is located in the Identify Results section to the left. Because we have renamed the key number fields, it s easy to spot the %Diff, which is the per cent difference expressed as decimal number. From the Diff_11-16, we can also see that the number of visible minorities in this census tract also increased significantly, which is also obvious by looking at the values in 2011 and We will eventually export this layer to ArcGIS Online, which we learn in the tutorial, Building Maps with ArGIS Online. But before we re done, we have one more layer to import which will help with our analysis, Ottawa s municipal ward boundaries. They will help us identify the city politicians whose wards contain the kind of growth that we want to write about. In this case, it could be the ward with the fastest visible minority growth rate.


66 Click here to obtain the zipped folder that contains Ottawa s wards. Unzip the folder and use the Add Vector Layer icon to import the shape file into Qgis.


67


68

69 Move the wards layer to the bottom. Now we want to make the ward boundaries tranparent, display the ward names, and thicken the boundaries to make them easy to see where the census tracts lay.

70 Right click on the wards= layer and select properties from the short-cut menu. Click Sample Fill. Select the colour black for your Outline.

71


72 Increase the Outline width to 2 millimetres. Set Layer transparency in the same dialogue box to 0%. Select the Fill icon to return to the previous dialogue box. Make Transparency for the fill colour 0% in order to make the ward boundary outlines stand out. Selecting the Apply tab, makes the boundary outline colour and thickness appear in the preview area to the right.


73 Select Apply, then OK. To make the ward boundaries easier to see, we ll need to make the colours for the census tracts more transparent. Right-click on the visible minorities layer, select properties.


74 To increase the transparency, use your cursor to slide the arrow on the bar to the right of the Layer rendering label to the 50% mark. Select Apply and OK. It would help to have the ward labels displayed on the map.

75 Right-click the wards layer, select properties and the Labels tab.


76 Select the Show labels for this layer option. Description is the field that contains the ward names. You can also change the font, point size, colour and transparency.

77 Select Apply and OK. If we zoom to the high-growth area still highlighted, we can see that the tracts fall within three wards, located on the outskirts of Ottawa. Now we know which councillors to interview for our story on growth in that area of town. What we have created is a choropleth map which, as we learned on page 156 of The Data Journalist, applies a number of colours to polygons to show variations in the values of a particular numeric value. For the positive values, it s best to use various hues on a colour grid. We can stick with blue, Qgis default colour. For zero values, we can use yellow. And for negative values, we can use another contrasting colour like red. We can begin by increasing the number of classes from five to a greater number. Since our range of values is fairly limited, we can stick with five classes: red for negative; yellow for zero; and the remaining three colours on the blue colour ramp for positive values. This red-yellow-blue combination creates a nice contrast that helps distinguish the different ranges at first glance. The ranges must be based on specific values in your data. Right-click on the visible minorities layer, go to properties and select Style. Change the precision number of decimal points from 2 to one.


78
79 To get an idea of your range of values, open the attribute table, and sort the percent difference column in descending order.


80 The values in the negative column go from (ignore the NULL values) from So your negative range will be to Double-click on the first number range in the Values column to obtain a dialogue box where we will type beside the Upper value.
 and plug in the")


81 Double-click on the corresponding numbers in the Legend (which does not produce a dialogue box) and plug in the same number for the upper value of the range. Select OK. To change the colour, click the first coloured square under Symbol right below the classes tab to obtain the Symbol selector dialogue box. Click the arrow to the far right.

82 Click the Choose color option. Select red.


83 Once the red has been selected, click OK to return to the Layer Properties dialogue box to change the next value range for the census tracts where growth is minimal (-0.010) to zero. Employing the same process used to colour code the negative-growth census tracts, make this range yellow.

84

85 Click OK to return to the map. Let s change the colour of the value range in the lowest category of the positive-growth census tracts. Return to properties. Using our attribute table as a reference, choose a range for the census tracts with the lowest growth rate, To disginguish this low-growth area from the higher growth tracts, make the colour a lighter blue to increase the colour contrast. You can preserve the default colours for the remaining categories and use the previous steps to alter the numeric ranges. Now we have completed all the steps for visible minorities. Now we have completed the tutorial. For an addded bonus that could enrich your analysis, you can also use other census data. For instance, on Oct. 25, Statistics Canada released income data that compared how much people earned in 2005 to salaries in It would be interesting to see if the growth in visible minority populations is occurring in affluent areas, or vice-versa: visible minorities are leaving more affluent areas.

86 This would involve comparing particular census tracts for visible minorities with those for median household income. Though correlation doesn t necessary mean causation, this context could become an important part of your story, provided you allowed experts to weigh in with their analysis. To do this, we could us the same steps to map out income, either in a brand new Qgis file, or this one. The choice is yours, though it may make more sense to have all the layers in one map. To obtain the csv file containing income for the median household income for 2005, 2015 and the percent difference, please click here. The csv file looks like this. Once you bring it into Qgis, we must re-save the layer in order to reformat the numbers in the CT_UID field as decimal numbers that can be joined to the CTUID field in the shape file.

87 Re-save the layer to create a new one, calling it Median_Household_Income_copy.csv.

88 Scroll down to the dialogue box s Layer Options and be sure to select YES from the drop-down menu to the right of the CREATE_CSVT option. Make the GEOMETRY default.


89 Select OK and open the attribute table. Using the steps from earlier in this tutorial, reformat the values in the CT_UID field as decimal numbers.

90

91 Import a second census tract shape file and move it above the OpenStreetMap lawyer so that it appears in the frame to the right.
92 Following the steps from earlier in this tutorial, create a newly named and formatted CTUID field (CTUID_NEW), using the previous steps in this tutorial. Using the new field, you can join this layer to your census tract shape file, select the tracts for Ottawa, and then save the selected tracts as a brand new layer. Following the previous steps in this tutorial, you can select the Ottawa census tracts from the median household income layer, create a new layer, and use the same colours in your grid to allow for easy comparisons with the tracts in the visble minorities layer.
Chapter 7. Joining Maps to Other Datasets in QGIS
 Chapter 7 Joining Maps to Other Datasets in QGIS Skills you will learn: How to join a map layer to a non-map layer in preparation for analysis, based on a common joining field shared by the two tables.
Census tutorial using the city of Ottawa s wards
 Census tutorial using the city of Ottawa s wards Every five years, Statistics Canada uses the Census Program to collect vital data about Canadians that paints a portrait of who we are. Traditionally, the
Chapter 7. Buffering in QGIS Desktop
 Chapter 7 Buffering in QGIS Desktop Summary: How far away is that? How many are too close? These are some of the most compelling mapping questions journalists can ask. A buffer is one of the most useful
The Data Journalist Chapter 7 tutorial Geocoding in ArcGIS Desktop
 The Data Journalist Chapter 7 tutorial Geocoding in ArcGIS Desktop Summary: In many cases, online geocoding services are all you will need to convert addresses and other location data into geographic data.
Chapter 6. Building Maps with ArcGIS Online
 Chapter 6 Building Maps with ArcGIS Online Summary: ArcGIS Online is an on-line mapping software that allows you to upload tables with latitude and longitude geographic coordinates to create map layers
Quantitative Mapping Using Census Data
 MAP, DATA & GIS LIBRARY maplib@brocku.ca ArcGIS Pro Census Mapping Quantitative Mapping Using Census Data This tutorial includes all necessary steps to create a thematic map using numeric census tract
Selecting Attributes and Location in QGIS Desktop
 Chapter 7 Selecting Attributes and Location in QGIS Desktop Summary: This tutorial covers selecting features in QGIS. If you are unfamiliar with the basics of the QGIS user interface, please read the tutorial
Add to the ArcMap layout the Census dataset which are located in your Census folder.
 Building Your Map To begin building your map, open ArcMap. Add to the ArcMap layout the Census dataset which are located in your Census folder. Right Click on the Labour_Occupation_Education shapefile
-In windows explorer navigate to your Exercise_4 folder and right-click the DEC_10_SF1_P1.csv file and choose Open With > Notepad.
 BIOL 4460/5460 and GEOL 4460 Introduction to GIS LAB 4 MAKING A THEMATIC MAP This exercise is to show you how to create a map for printing. As you have seen in the lecture, maps can have different purposes
QGIS LAB SERIES GST 102: Spatial Analysis Lab 2: Introduction to Geospatial Analysis
 QGIS LAB SERIES GST 102: Spatial Analysis Lab 2: Introduction to Geospatial Analysis Objective Understand Attribute Table Joins and Data Classification Document Version: 2014-06-16 (Beta) Contents Introduction...2
Mapping Census data in QGIS
 Mapping Census data in QGIS Contents Contents 1. Introduction...3 1.1. Census data...3 1.2. Boundary data...3 1.3. Mapping software...3 2. Obtain your census data...4 Step 1: Geography...4 Step 2: Topics...5
Part one of an Excel tutorial using the the Alberta Sunshine List Data
 Part one of an Excel tutorial using the the Alberta Sunshine List Data Given that most of you are on Macs, your Excel interfaces will be different from mine. Still, the tutorial and screenshots will give
Downloading 2010 Census Data
 Downloading 2010 Census Data These instructions cover downloading the Census Tract polygons and the separate attribute data. After that, the attribute data will need additional formatting in Excel before
Introduction to GIS & Mapping: ArcGIS Desktop
 Introduction to GIS & Mapping: ArcGIS Desktop Your task in this exercise is to determine the best place to build a mixed use facility in Hudson County, NJ. In order to revitalize the community and take
Introduction to using QGIS for Archaeology and History Workshop by the Empirical Reasoning Center
 Introduction to using QGIS for Archaeology and History Workshop by the Empirical Reasoning Center In this workshop, we will cover the basics of working with spatial data, as well as its main uses for archaeology.
Len Preston Chief, Labor Market Information New Jersey Department of Labor & Workforce Development
 Len Preston Chief, Labor Market Information New Jersey Department of Labor & Workforce Development Cooperative project of the State of New Jersey and the U.S. Bureau of the Census serving data users in
1. Download Federal Electoral Districts and add to map document
 1. Download Federal Electoral Districts and add to map document Federal Electoral Districts (FEDs) are the geographic areas for which one Member of Parliament is elected. It is downloaded as a shapefile
TUTORIAL FOR IMPORTING OTTAWA FIRE HYDRANT PARKING VIOLATION DATA INTO MYSQL
 TUTORIAL FOR IMPORTING OTTAWA FIRE HYDRANT PARKING VIOLATION DATA INTO MYSQL We have spent the first part of the course learning Excel: importing files, cleaning, sorting, filtering, pivot tables and exporting
Exercise 1: An Overview of ArcMap and ArcCatalog
 Exercise 1: An Overview of ArcMap and ArcCatalog Introduction: ArcGIS is an integrated collection of GIS software products for building a complete GIS. ArcGIS enables users to deploy GIS functionality
Community Health Maps Lab Series
 Community Health Maps Lab Series Lab 6 Data Visualization with Carto Objective Understand how to upload and style data with Carto to create an online visualization of your data Document Version: 2017-08-28(Final)
GIS Basics for Urban Studies
 GIS Basics for Urban Studies Date: March 21, 2018 Contacts: Mehdi Aminipouri, Graduate Peer GIS Faciliator, SFU Library (maminipo@sfu.ca) Keshav Mukunda, GIS & Map Librarian Librarian for Geography (kmukunda@sfu.ca)
Using Census Data to Calculate Social Inequality in Colombia
 Using Census Data to Calculate Social Inequality in Colombia Written by Carolyn Talmadge, February 8, 2017 What is Social Inequality?... 1 Accessing the Data... 2 Understanding the Metadata & Attribute
Mapping 2001 Census Data Using ArcView 3.3
 Mapping 2001 Census Data Using ArcView 3.3 These procedures outline: 1. Mapping a theme (making a map) 2. Preparing the layout for printing and exporting the map into various file formats. In order to
ArcGIS Online (AGOL) Quick Start Guide Fall 2018
 Quick Start Guide Fall 2018") ArcGIS Online (AGOL) Quick Start Guide Fall 2018 ArcGIS Online (AGOL) is a web mapping tool available to UC Merced faculty, students and staff. The Spatial Analysis and Research Center (SpARC) provides
ArcGIS Online (AGOL) Quick Start Guide Fall 2018 ArcGIS Online (AGOL) is a web mapping tool available to UC Merced faculty, students and staff. The Spatial Analysis and Research Center (SpARC) provides
DOING MORE WITH EXCEL: MICROSOFT OFFICE 2010
 DOING MORE WITH EXCEL: MICROSOFT OFFICE 2010 GETTING STARTED PAGE 02 Prerequisites What You Will Learn MORE TASKS IN MICROSOFT EXCEL PAGE 03 Cutting, Copying, and Pasting Data Filling Data Across Columns
DOING MORE WITH EXCEL: MICROSOFT OFFICE 2013
 DOING MORE WITH EXCEL: MICROSOFT OFFICE 2013 GETTING STARTED PAGE 02 Prerequisites What You Will Learn MORE TASKS IN MICROSOFT EXCEL PAGE 03 Cutting, Copying, and Pasting Data Basic Formulas Filling Data
TUTORIAL FOR IMPORTING OTTAWA FIRE HYDRANT PARKING VIOLATION DATA INTO MYSQL
 TUTORIAL FOR IMPORTING OTTAWA FIRE HYDRANT PARKING VIOLATION DATA INTO MYSQL We have spent the first part of the course learning Excel: importing files, cleaning, sorting, filtering, pivot tables and exporting
Mapping discarded needles in Fusion Tables Tutorial
 Mapping discarded needles in Fusion Tables Tutorial In the previous tutorials, we ve learned how to turn pivot tables into heat maps and place colour code geographic points using markers that Fusion Tables
Chapter 7. A Quick Tour of ArcGIS Pro
 Chapter 7 A Quick Tour of ArcGIS Pro Skills you will learn: This tutorial is intended to get you going using ArcGIS Pro, a new desktop application that is part of ArcGIS Desktop. A separate tutorial gives
1. Start ArcMap by going to the Start menu > All Programs > ArcGIS > ArcMap.
 Learning ArcGIS: Introduction to ArcMap 10.1 The Map Document Feature Manipulation Navigating ArcMap Map Documents, Layers, and Features Shapes, Location, and Attribute Data Symbology Zoom, Pan and Map
Tableau Tutorial Using Canadian Arms Sales Data
 Tableau Tutorial Using Canadian Arms Sales Data 1) Your data comes from Industry Canada s Trade site. 2) If you don t want to download the data yourself, use this file. You can also download it from the
Step by Step GIS. Section 1
 Step by Step GIS Section 1 Contact the web page given below for the data required to do the exercises (http://www.pasda.psu.edu/default.asp) Before beginning the tutorials please visit the Preparation
GGR 375 QGIS Tutorial
 GGR 375 QGIS Tutorial With text taken from: Sherman, Gary E. Shuffling Quantum GIS into the Open Source GIS Stack. Free and Open Source Software for Geospatial (FOSS4G) Conference. 2007. Available online
Introduction to SAGA GIS
 GIS Tutorial ID: IGET_RS_001 This tutorial has been developed by BVIEER as part of the IGET web portal intended to provide easy access to geospatial education. This tutorial is released under the Creative
MAPLOGIC CORPORATION. GIS Software Solutions. Getting Started. With MapLogic Layout Manager
 MAPLOGIC CORPORATION GIS Software Solutions Getting Started With MapLogic Layout Manager Getting Started with MapLogic Layout Manager 2011 MapLogic Corporation All Rights Reserved 330 West Canton Ave.,
Working with Attributes
 Working with Attributes QGIS Tutorials and Tips Author Ujaval Gandhi http://www.spatialthoughts.com This work is licensed under a Creative Commons Attribution 4.0 International License. Working with Attributes
Downloading shapefiles and using essential ArcMap tools
 CHAPTER 1 KEY CONCEPTS downloading shapefiles learning essential tools exploring the ArcMap table of contents understanding shapefiles customizing shapefiles saving projects Downloading shapefiles and
QGIS Workshop Su Zhang and Laura Gleasner 11/10/2016. QGIS Workshop
 1. Introduction to Quantum GIS (QGIS) QGIS Workshop QGIS is a free and open source Geographic Information System (GIS). QGIS can help you create, edit, visualize, and publish geospatial information on
HOW TO USE THE EXPORT FEATURE IN LCL
 HOW TO USE THE EXPORT FEATURE IN LCL In LCL go to the Go To menu and select Export. Select the items that you would like to have exported to the file. To select them you will click the item in the left
QGIS LAB SERIES GST 102: Spatial Analysis Lab 7: Raster Data Analysis - Density Surfaces
 QGIS LAB SERIES GST 102: Spatial Analysis Lab 7: Raster Data Analysis - Density Surfaces Objective Learn Density Analysis Methods Document Version: 2014-07-11 (Beta) Contents Introduction...2 Objective:
QGIS LAB SERIES GST 102: Spatial Analysis Lab 3: Advanced Attributes and Spatial Queries for Data Exploration
 QGIS LAB SERIES GST 102: Spatial Analysis Lab 3: Advanced Attributes and Spatial Queries for Data Exploration Objective Understanding Attribute Queries and Spatial Queries Document Version: 2014-06-19
If you are off campus, first go to Waterloo Library Homepage (http://www.lib.uwaterloo.ca/) and click Connect from Home on the left side.
 and click Connect from Home on the left side.") SimplyMap 2.0 Canada Tutorial SimplyMap Canada is a web mapping application developed by Geographic Research Inc. The application enables users to create thematic maps and reports using demographic, business,
SimplyMap 2.0 Canada Tutorial SimplyMap Canada is a web mapping application developed by Geographic Research Inc. The application enables users to create thematic maps and reports using demographic, business,
Tutorial for downloading and analyzing data from the Atlantic Canada Opportunities Agency
 Tutorial for downloading and analyzing data from the Atlantic Canada Opportunities Agency The agency, which goes by the acronym ACOA, is one of many federal institutions that uploads data to the federal
Session 3: Cartography in ArcGIS. Mapping population data
 Exercise 3: Cartography in ArcGIS Mapping population data Background GIS is well known for its ability to produce high quality maps. ArcGIS provides useful tools that allow you to do this. It is important
Geography 281 Map Making with GIS Project Three: Viewing Data Spatially
 Geography 281 Map Making with GIS Project Three: Viewing Data Spatially This activity introduces three of the most common thematic maps: Choropleth maps Dot density maps Graduated symbol maps You will
SPREADSHEETS. (Data for this tutorial at
 SPREADSHEETS (Data for this tutorial at www.peteraldhous.com/data) Spreadsheets are great tools for sorting, filtering and running calculations on tables of data. Journalists who know the basics can interview
ADD AND NAME WORKSHEETS
 1 INTERMEDIATE EXCEL While its primary function is to be a number cruncher, Excel is a versatile program that is used in a variety of ways. Because it easily organizes, manages, and displays information,
Welcome to Cole On-line Help system!
 Welcome to Cole On-line Help system! Cole Online is an Internet based information directory that allows fast and efficient access to demographic information about residences and businesses. You can search
Using pivot tables in Excel (live exercise with data)
") Using pivot tables in Excel (live exercise with data) In chapter four, we used B.C. s political donations data to learn how to build pivot tables, which group elements in your data and summarize the information
Using pivot tables in Excel (live exercise with data) In chapter four, we used B.C. s political donations data to learn how to build pivot tables, which group elements in your data and summarize the information
Using Pivot Tables in Excel (Live Exercise with Data)
") Chapter 4 Using Pivot Tables in Excel (Live Exercise with Data) In chapter four, we used B.C. s political donations data to learn how to build pivot tables, which group elements in your data and summarize
Chapter 4 Using Pivot Tables in Excel (Live Exercise with Data) In chapter four, we used B.C. s political donations data to learn how to build pivot tables, which group elements in your data and summarize
Buffering in ArcMap tutorial
 Buffering in ArcMap tutorial 1) Open ArcMap 2) Bring in the Wards_2010 and Parks shape files from the city of Ottawa s open data portal. (NOTE: for the purposes of this tutorial, you could also bring in
Store Mapper User Guide
 Store Mapper User Guide Find & Display Local Retailer Data D R A F T S e p t e m b e r 1 0, 2 0 1 5 Table of Contents Introduction/Purpose... 3 Site Tour... 4 Map... 4 Info-box... 5 Map Tools... 6 Base
Working with International Census Data in GIS
 Working with International Census Data in GIS Updated February 23, 2015 Table of Contents SETTING UP... 1 DATA SOURCES... 1 TABULAR CENSUS DATA... 2 2001 Tabular Census Data... 5 GEOGRAPHIC DATA... 5 JOINING
Geography 281 Mapmaking with GIS Project One: Exploring the ArcMap Environment
 Geography 281 Mapmaking with GIS Project One: Exploring the ArcMap Environment This activity is designed to introduce you to the Geography Lab and to the ArcMap software within the lab environment. Please
Note: you must explicitly follow these instructions to avoid problems
 Exercise 4 Attribute Tables and Census Tract Mapping 30 Points Note: We recommend that you use the Firefox web browser when working with the Census Bureau web site. Objectives: Become familiar with census
Tutorial 2: Query and Select TRI Spatial Data to Study State-Wide Emissions Quantum GIS
 Tutorial 2: Query and Select TRI Spatial Data to Study State-Wide Emissions Quantum GIS This tutorial will introduce you to the following: Identifying Attribute Data Sources Toxic Release Inventory (TRI)
Exercise 1: Introduction to MapInfo
 Geog 578 Exercise 1: Introduction to MapInfo Page: 1/22 Geog 578: GIS Applications Exercise 1: Introduction to MapInfo Assigned on January 25 th, 2006 Due on February 1 st, 2006 Total Points: 10 0. Convention
Mapping Tabular Data
 Mapping Tabular Data ArcGIS Desktop 10.1 Instructional Guide Kim Ricker GIS/Data Center Head (713) 348-5691 Jean Niswonger GIS Support Specialist (713) 348-2595 This guide was created by the staff of the
Using Spatial Data in a Desktop GIS; QGIS 2.8 Practical 2
 Using Spatial Data in a Desktop GIS; QGIS 2.8 Practical 2 Practical 2 Learning objectives: To work with a vector base map within a GIS and overlay point data. To practise using Ordnance Survey mapping
SUM - This says to add together cells F28 through F35. Notice that it will show your result is
 COUNTA - The COUNTA function will examine a set of cells and tell you how many cells are not empty. In this example, Excel analyzed 19 cells and found that only 18 were not empty. COUNTBLANK - The COUNTBLANK
Tutorial 1: Finding and Displaying Spatial Data Using ArcGIS
 Tutorial 1: Finding and Displaying Spatial Data Using ArcGIS This tutorial will introduce you to the following: Websites where you may browse to find geospatial information Identifying spatial data, usable
Ryerson University, March Table of Contents. Joining CHASS Data To ArcView Cartographic Files A. Importing An Arc Export File...
 Ryerson University, March 2001 Table of Contents Joining CHASS Data To ArcView Cartographic Files... -1 A. Importing An Arc Export File... -1 B. Opening The Arc/Info Coverage In ArcView... -2 C. Converting
Exploring extreme weather with Excel - The basics
 Exploring extreme weather with Excel - The basics These activities will help to develop your data skills using Excel and explore extreme weather in the UK. This activity introduces the basics of using
GIS LAB 1. Basic GIS Operations with ArcGIS. Calculating Stream Lengths and Watershed Areas.
 GIS LAB 1 Basic GIS Operations with ArcGIS. Calculating Stream Lengths and Watershed Areas. ArcGIS offers some advantages for novice users. The graphical user interface is similar to many Windows packages
Introduction to district compactness using QGIS
 Introduction to district compactness using QGIS Mira Bernstein, Metric Geometry and Gerrymandering Group Designed for MIT Day of Engagement, April 18, 2017 1) First things first: before the session Download
Ontario Cancer Profiles User Help File
 Ontario Cancer Profiles User Help File Contents Introduction... 2 Module 1 Tool Overview and Layout... 3 Overview of the tool... 3 Highlights vs. selections... 6 Data suppression or unreliable estimates...
EXCEL BASICS: MICROSOFT OFFICE 2010
 EXCEL BASICS: MICROSOFT OFFICE 2010 GETTING STARTED PAGE 02 Prerequisites What You Will Learn USING MICROSOFT EXCEL PAGE 03 Opening Microsoft Excel Microsoft Excel Features Keyboard Review Pointer Shapes
Geography 281 Mapmaking with GIS Project One: Exploring the ArcMap Environment
 Geography 281 Mapmaking with GIS Project One: Exploring the ArcMap Environment This activity is designed to introduce you to the Geography Lab and to the ArcMap software within the lab environment. Before
MicroStrategy Academic Program
 MicroStrategy Academic Program Creating a center of excellence for enterprise analytics and mobility. DATA PREPARATION: HOW TO WRANGLE, ENRICH, AND PROFILE DATA APPROXIMATE TIME NEEDED: 1 HOUR TABLE OF
Building Vector Layers
 Building Vector Layers in QGIS Introduction: Spatially referenced data can be separated into two categories, raster and vector data. This week, we focus on the building of vector features. Vector shapefiles
Introduction to QGIS: Instructor s Notes
 2016 Introduction to QGIS: Instructor s Notes Created by: MARK DE BLOIS, CEO / FOUNDER, UPANDE LIMITED WITH SUPPORT FROM THE WORLD BANK AND THE UK DEPARTMENT FOR INTERNATIONAL DEVELOPMENT (DFID) Module
Download the Latest LTR QGIS version (2.18) from the QGIS website: download.qgis.org/ >> Settings > Options > Locale
 from the QGIS website: download.qgis.org/ >> Settings > Options > Locale") Exercise 1: Introduction to QGIS Aim: To understand the basis of GIS To learn the basics of a GIS software (QGIS) INTRODUCTION Software Access Download the Latest LTR QGIS version (2.18) from the QGIS
Exercise 1: Introduction to QGIS Aim: To understand the basis of GIS To learn the basics of a GIS software (QGIS) INTRODUCTION Software Access Download the Latest LTR QGIS version (2.18) from the QGIS
Geographical Information Systems Institute. Center for Geographic Analysis, Harvard University. LAB EXERCISE 1: Basic Mapping in ArcMap
 Harvard University Introduction to ArcMap Geographical Information Systems Institute Center for Geographic Analysis, Harvard University LAB EXERCISE 1: Basic Mapping in ArcMap Individual files (lab instructions,
FrontPage 98 Quick Guide. Copyright 2000 Peter Pappas. edteck press All rights reserved.
 Master web design skills with Microsoft FrontPage 98. This step-by-step guide uses over 40 full color close-up screen shots to clearly explain the fast and easy way to design a web site. Use edteck s QuickGuide
Getting Started with GIS using ArcGIS 10.6 What is GIS? and - Module 1 Creating a map document
 Getting Started with GIS using ArcGIS 10.6 What is GIS? and - Module 1 Creating a map document Marcel Fortin Map & Data Library mdl@library.utoronto.ca 2018 http://mdl.library.utoronto.ca This workshop
QGIS Workshop Su Zhang and Laura Gleasner 11/15/2018. QGIS Workshop
 1. Introduction to QGIS QGIS Workshop QGIS is a free and open source Geographic Information System (GIS). QGIS can help users create, edit, visualize, analyze, and publish geospatial information on various
Tutorial for downloading and analyzing data from the Atlantic Canada Opportunities Agency
 Tutorial for downloading and analyzing data from the Atlantic Canada Opportunities Agency The agency, which goes by the acronym ACOA, is one of many federal institutions that uploads data to the federal
Introduction to QGIS: Student Workbook
 2016 Introduction to QGIS: Student Workbook Created by: MARK DE BLOIS, CEO / FOUNDER, UPANDE LIMITED WITH SUPPORT FROM THE WORLD BANK AND THE UK DEPARTMENT FOR INTERNATIONAL DEVELOPMENT (DFID) Module 3:
1 Introduction to Using Excel Spreadsheets
 Survey of Math: Excel Spreadsheet Guide (for Excel 2007) Page 1 of 6 1 Introduction to Using Excel Spreadsheets This section of the guide is based on the file (a faux grade sheet created for messing with)
A Practical Guide to Using QGIS
 A Practical Guide to Using QGIS 1.1 INTRODUCTION Quantum GIS (QGIS) is a useful mapping software that enables the compilation and displaying of spatial data in the form of a map. Gaining experience in
Microsoft Excel 2007
 Microsoft Excel 2007 1 Excel is Microsoft s Spreadsheet program. Spreadsheets are often used as a method of displaying and manipulating groups of data in an effective manner. It was originally created
Importing a txt or csv file into ArcGIS Online [AGO]
![Importing a txt or csv file into ArcGIS Online [AGO]](/thumbs/90/101387846.jpg "Importing a txt or csv file into ArcGIS Online [AGO]") Importing a txt or csv file into ArcGIS Online [AGO] Spring 2014 This is how to find addresses online and copy them into an Excel spreadsheet, save them in a format that ArcGIS can use, and then import
Importing a txt or csv file into ArcGIS Online [AGO] Spring 2014 This is how to find addresses online and copy them into an Excel spreadsheet, save them in a format that ArcGIS can use, and then import
Georeferencing Soil Maps in ArcMap 10.x: Basic procedures to download, open, manipulate and print spatial data
 Georeferencing Soil Maps in ArcMap 10.x: Basic procedures to download, open, manipulate and print spatial data These procedures outline: A. Obtaining soil maps. B. Downloading boundary files. C. Uncompressing
Tutorial for mapping Toronto s 2013 fire hydrant parking ticket data
 Tutorial for mapping Toronto s 2013 fire hydrant parking ticket data Toronto, like cities including Vancouver, Edmonton, Ottawa and Halifax, has an open data site with lots of great data to download. The
Using Tables, Sparklines and Conditional Formatting. Module 5. Adobe Captivate Wednesday, May 11, 2016
 Slide 1 - Using Tables, Sparklines and Conditional Formatting Using Tables, Sparklines and Conditional Formatting Module 5 Page 1 of 27 Slide 2 - Lesson Objectives Lesson Objectives Explore the find and
Using Microsoft Word. Tables
 Using Microsoft Word are a useful way of arranging information on a page. In their simplest form, tables can be used to place information in lists. More complex tables can be used to arrange graphics on
Geographical Information Systems Institute. Center for Geographic Analysis, Harvard University
 Geographical Information Systems Institute Center for Geographic Analysis, Harvard University LAB EXERCISE 5: Queries, Joins: Spatial and Non-spatial 1.0 Getting Census data 1. Go to the American Factfinder
Project 2 CIVL 3161 Advanced Editing
 Project 2 CIVL 3161 Advanced Editing Introduction This project will involve more advanced editing/manipulation of data within ArcGIS. You will use the map that you create in this project as a starting
Guide to using QGIS. QGIS is a free and open source Geographical Information System programme which can be downloaded at
 Guide to using QGIS QGIS is a free and open source Geographical Information System programme which can be downloaded at http://www.qgis.org/en/site/ It is a great programme for displaying data which can
Introduction to Social Explorer
 Introduction to Social Explorer Janine Billadello, Geospatial Data Lab, Baruch College October 1, 2015 Abstract This tutorial will introduce you to Social Explorer, an online mapping interface that allows
Creating a reference map
 Chapter 1 Creating a reference map Reference maps are basic, traditional maps. Their purpose is to illustrate geographic boundaries for cities, counties, and other areas. Reference maps have no underlying
Blackboard for Faculty: Grade Center (631) In this document:
 In this document:") 1 Blackboard for Faculty: Grade Center (631) 632-2777 Teaching, Learning + Technology Stony Brook University In this document: blackboard@stonybrook.edu http://it.stonybrook.edu 1. What is the Grade Center?..
1 Blackboard for Faculty: Grade Center (631) 632-2777 Teaching, Learning + Technology Stony Brook University In this document: blackboard@stonybrook.edu http://it.stonybrook.edu 1. What is the Grade Center?..
EXCEL BASICS: MICROSOFT OFFICE 2007
 EXCEL BASICS: MICROSOFT OFFICE 2007 GETTING STARTED PAGE 02 Prerequisites What You Will Learn USING MICROSOFT EXCEL PAGE 03 Opening Microsoft Excel Microsoft Excel Features Keyboard Review Pointer Shapes
1. Open the New American FactFinder using this link:
 Exercises for Mapping and Using US Census Data MIT GIS Services, IAP 2012 More information, including a comparison of tools available through the MIT Libraries, can be found at: http://libraries.mit.edu/guides/types/census/tools-overview.html
US Geo-Explorer User s Guide. Web:
 US Geo-Explorer User s Guide Web: http://usgeoexplorer.org Updated on October 26, 2016 TABLE OF CONTENTS Introduction... 3 1. System Interface... 5 2. Administrative Unit... 7 2.1 Region Selection... 7
Part 2: Build your own Map Tour with ArcGIS Online
 Part 2: Build your own Map Tour with ArcGIS Online Tutorial Overview In this tutorial, students will create and publish their own Map Tour application, a type of Story Map Web application, through ArcGIS
Desktop Studio: Charts. Version: 7.3
 Desktop Studio: Charts Version: 7.3 Copyright 2015 Intellicus Technologies This document and its content is copyrighted material of Intellicus Technologies. The content may not be copied or derived from,
SPATIAL DESIGN NETWORK ANALYSIS sdna in QGIS
 SPATIAL DESIGN NETWORK ANALYSIS sdna in QGIS 1 Installing sdna+ as plugin for QGIS... 2 1.1 Download & Install sdna... 2 1.2 Setting up sdna in QGIS... 3 1.3 Open the sdna toolbox... 5 2 sdna in QGIS Processing
Geocoding Reference USA data in ArcMap 9.3
 Tufts GIS Tip Sheet Geocoding Reference USA data in ArcMap 9.3 Written by Barbara Parmenter Revised 3/1/2011 In this exercise, you will map businesses or services for a town in the Boston metropolitan
for secondary school teachers & administrators
 for secondary school teachers & administrators 2b: presenting worksheets effectively Contents Page Workshop 2B: Presenting Worksheets Effectively 1 2.1 The Formatting Toolbar 2.1.1 The Format Cells Dialogue