SPATIAL DESIGN NETWORK ANALYSIS sdna in QGIS
|
|
|
- Rolf Collins
- 5 years ago
- Views:
Transcription
1 SPATIAL DESIGN NETWORK ANALYSIS sdna in QGIS 1 Installing sdna+ as plugin for QGIS Download & Install sdna Setting up sdna in QGIS Open the sdna toolbox sdna in QGIS Processing HK Vehicle network Load the Transport vector layer Running sdna prepare Using sdna Integral Analysis Displaying sdna Results Save project Exporting an image from QGIS Use Export as Image Use Print Composer to create high-resolution output Adding Basemaps (Google, OpenStreetMap, Yahoo!, Bing) Appendix: How to use OSM data for sdna analysing Download OSM data extract from Mapzen/Geofabrik/BBBike Clean OSM map for processing Repeat 2.2 to 2.4 to process the map using sdna


2 SPATIAL DESIGN NETWORK ANALYSIS 3D pedestrian network mapping & accessibility and flow analyses 1 Installing sdna+ as plugin for QGIS 1.1 Download & Install sdna Get into sdna official website, go to the download page Choose the latest version (v3_4_6) to download Run the downloaded file sdna_setup_win_v3_4_6.msi, follow the installation instruction Next Next Next Tick box I accept Install Finish License sdna you need to sign up to get a free sdna license From sdna website: From the Windows Start menu, find sdna License Manager in the sdna folder; Click and select All Users


3 Follow the instructions show in sdna License Manager window to authorize. 1.2 Setting up sdna in QGIS Open QGIS. Plugins tab Manage and install plugins, it may take a bit of time to fetch the list of plugin In Plugins Settings window, under Settings, make sure you have checked the box Show also experimental plugins


4 Back to ALL search SDNA Install plugin In Processing tab, Select Options Select General and check the Keep dialog open after running an algorithm


5 Then go into Providers, sdna should show up as activate and the location should be as shown below. 1.3 Open the sdna toolbox Find the Processing tab > click Toolbox, a toolbox panel should show up on the right of the QGIS window. 2 sdna in QGIS Processing HK Vehicle network 2.1 Load the Transport vector layer click on the Add Vector Layer toolbar button, load HKisland_Centreline.shp 2.2 Running sdna prepare This is a stage to take care of error in the network. For more details see:
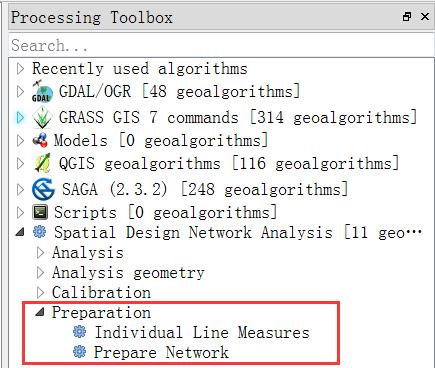
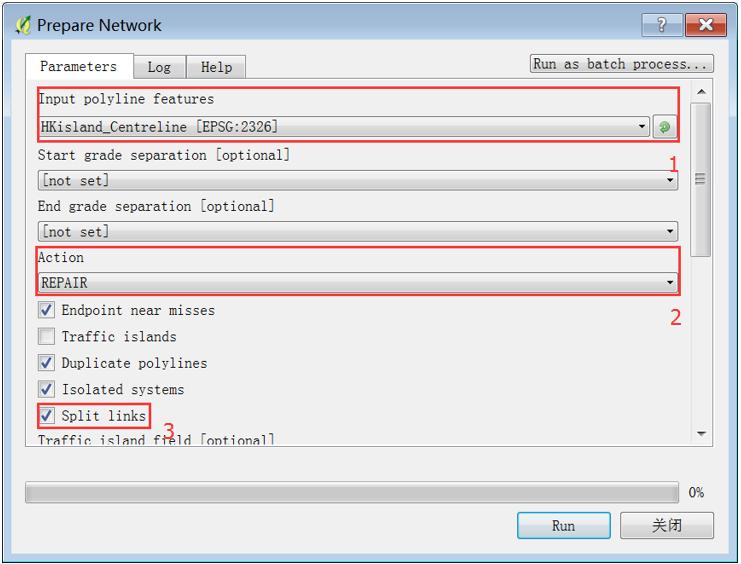
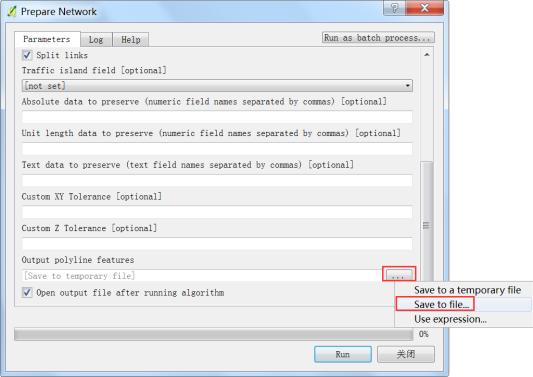
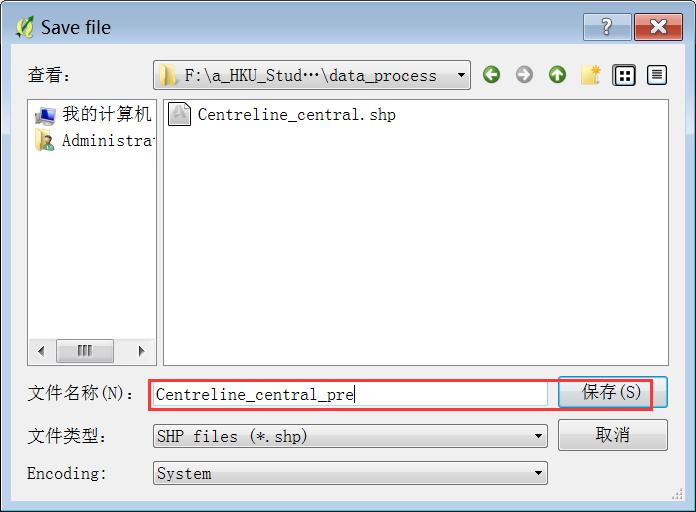
6 nciples content/downloads/documentation/manual/sdna_manual_v3_4_5/network_preparation.html#pri In Processing toolbox on the right, in sdna toolbox click Preparation and double- Click Prepare Network. In Input polyline features select the layer HKisland_Centreline 1 (if only one it is automatically selected); change the Action set to Repair 2; tick Split links to join all the segments between junctions into one continuous segment3. save the output file as clipped _prepare.shp, then click on RUN to prepare network. Close Prepare Network window 2.3 Using sdna Integral Analysis


7 Double click Integral Analysis In Processing toolbox on the right Select the prepared layer as input dataset1; select Angular analysis metric2; set the analysis radii: 800, 2000, ; specify output dataset location, name the new layer as Centreline_central_pre_ang 4; click Run to compute5. Once processing is finished, close the Integral Analysis and rename the output layer to HKisland_Centreline_pre_ang 2.4 Displaying sdna Results Right click on the layer Properties
 2;")
 4; Classes: 105; Tick Invert6.")

8 In Style, change the Single Symbol to Graduated 1; Column: select BtA 800 (Betweenness Angular 800m) 2; Change Color ramp to RdYlBu 3; Mode: Quantile (Equal Count) 4; Classes: 105; Tick Invert6. In Advanced, select Symbols Levels, Tick Enable Symbols Level, and then from blue to red, number the layer 0 from 1 to 10. OK


9 Apply to see what this give you and OK Set the line thickness through the Layer Properties Style Symbol1, set the line width 2 Right click on the layer, and Rename the layer as HKisland_Centreline_pre_BtA800


10 Copy the layer by Right clicking on the layer Duplicate ; Rename the layer as HKisland_Centreline_pre_BtA2000 Right click the Centreline_central_pre_BtA2000 layer Properties Style and change Column to BtA To make the change to happen toggle Mode between Equal Interval and back to Quantile2. Then the legend change and you can Apply and Close. Do the same for layer SO you have 3 graphic + 3 legends.
 and the location to save it 3 Exporting an image from QGIS 3.")
11 2.5 Save project Go to menu, Project Save choose the name for your project (e.g., HKisland_vehicle) and the location to save it 3 Exporting an image from QGIS 3.1 Use Export as Image Project > "Save as Image". Save in the desired format (png, jpg, tiff)


12 "Save as Image" simply saves the currently visible map. It's not possible to adjust the resolution of an output image 3.2 Use Print Composer to create high-resolution output Un-check the box next to layers to turn off some map layers for data that we do not need. Go to Project New Print Composer. You will be prompted to enter a title for the composer. You can leave it empty and click Ok.


13 In the Print Composer window, click on Zoom full Layout. Then go to Layout Add Map. to display the full extent of the Once the Add Map button is active, hold the left mouse button and drag a rectangle where you want to insert the map. You will see that the rectangle window will be rendered with the map from the main QGIS canvas. Use Layout Move item content to pan the map in the window and center it in the composer.


14 Add a Scalebar. Click on Layout Add Scalebar Click on the layout where you want the scale bar to appear. In the Item Properties tab, choose the Style that fit your requirement..


15 Layout Add Legend. I the Item properties tab, find Legend items panel. Use minus button to remove unwanted items. Select a layer from the same list1, Click the Edit button2; Re name the layer to HKISLAND_BtA Composer Export as image, Browse to locate the file. Set the output image resolution, and save
 From the main menu click Plugins Manage and")


16 4 Adding Basemaps (Google, OpenStreetMap, Yahoo!, Bing) From the main menu click Plugins Manage and Install Plugins Search openlayers to filter plugins, select OpenLayers Plugin install plugin CLOSE the Plugins window after you see "successfully installed" dialog box. Click Web OpenLayers Plugin OpenStreetMap


17 Click and drag the Google Street layer to beneath the sdna analyzed layers. 5 Appendix: How to use OSM data for sdna analysing 5.1 Download OSM data extract from Mapzen/Geofabrik/BBBike Click the search button Move the map to the desired position using the zoom function on your mouse, click here to create a bounding box when satisfied.

.")


18 If the bounding box does not cover the area required, you can cancel the selection by clicking on select a different area. Repeat the process of navigating till you are satisfies with the area the bounding box covers (data extracted will fall within the bounding box). When satisfied input your address, hit extract After the arrival of the with a link that directs to your data download. Save your OSM data extract in a folder. The OSM data comes in a zip folder, unzip the contents. 5.2 Clean OSM map for processing Difference between Link & unlink intersections Break all of the link intersections at once (or you can use Cleanup in AutoCAD Map 3D to do the same) Select the road layer, then click Edit mode Show Processing Toolbox


19 Processing Toolbox QGIS geoalgorithms Vector overlay tools Split lines with lines Double-click to open Split lines with lines dialog, set Input layer and Split layer, save the splitted file as osm_hkisland_roads_split.shp, click Run Import osm_hkisland_roads_split.shp into QGIS Use Select Feature to check that all of the intersections were broken. 5.3 Repeat 2.2 to 2.4 to process the map using sdna.
Working with demographic grids in QGIS
 Working with demographic grids in QGIS Anna Dmowska dmowska@amu.edu.pl April 2017 1. Introduction SocScape (Social Landscape) is a research project which provides open access to high resolution (30 m)
Introduction to QGIS: Student Workbook
 2016 Introduction to QGIS: Student Workbook Created by: MARK DE BLOIS, CEO / FOUNDER, UPANDE LIMITED WITH SUPPORT FROM THE WORLD BANK AND THE UK DEPARTMENT FOR INTERNATIONAL DEVELOPMENT (DFID) Module 3:
A Practical Guide to Using QGIS
 A Practical Guide to Using QGIS 1.1 INTRODUCTION Quantum GIS (QGIS) is a useful mapping software that enables the compilation and displaying of spatial data in the form of a map. Gaining experience in
Introduction to QGIS: Instructor s Notes
 2016 Introduction to QGIS: Instructor s Notes Created by: MARK DE BLOIS, CEO / FOUNDER, UPANDE LIMITED WITH SUPPORT FROM THE WORLD BANK AND THE UK DEPARTMENT FOR INTERNATIONAL DEVELOPMENT (DFID) Module
Introduction to using QGIS for Archaeology and History Workshop by the Empirical Reasoning Center
 Introduction to using QGIS for Archaeology and History Workshop by the Empirical Reasoning Center In this workshop, we will cover the basics of working with spatial data, as well as its main uses for archaeology.
The Digital City: Warmoesstraat in 16 th Century
 The Digital City: Warmoesstraat in 16 th Century Manual: Weixuan Li, summer 2017 PART I: A data view of Warmoesstraat and its surroundings You probably have wandered in the restaurant/shop-packed Warmoesstraat
Tutorial for Lane County Mapping Applications
 Tutorial for Lane County Mapping Applications Contents Overview... 2 Tools... 2 Navigation Tools... 3 Display Tools... 5 Information Tools... 6 Sharing Tools... 7 Common Tasks... 9 Identify or Show Data
Searching and Downloading OpenStreetMap Data
 Searching and Downloading OpenStreetMap Data QGIS Tutorials and Tips Author Ujaval Gandhi http://www.spatialthoughts.com This work is licensed under a Creative Commons Attribution 4.0 International License.
Getting Started with GIS using ArcGIS 10.6 What is GIS? and - Module 1 Creating a map document
 Getting Started with GIS using ArcGIS 10.6 What is GIS? and - Module 1 Creating a map document Marcel Fortin Map & Data Library mdl@library.utoronto.ca 2018 http://mdl.library.utoronto.ca This workshop
CHAPTER 5 DIGITAL ELEVATION MODEL AND 3D VISUALIZATION
 CHAPTER 5 DIGITAL ELEVATION MODEL AND 3D VISUALIZATION A digital elevation model (DEM) is a digital model or 3D representation of a terrain's surface. A DEM can be represented as a raster (a grid of squares,
Exercise 3-1: Soil property mapping
 Exercise 3-1: Soil property mapping Mapping objectives: Create a soil analysis point layer from tabular data in QGIS Create a continuous surface soil property map using Kriging Interpolation in SAGA GIS
Introduction to GIS & Mapping: ArcGIS Desktop
 Introduction to GIS & Mapping: ArcGIS Desktop Your task in this exercise is to determine the best place to build a mixed use facility in Hudson County, NJ. In order to revitalize the community and take
Practical 3 Creating your map layouts using the print composer in QGIS
 Practical 3 Creating your map layouts using the print composer in QGIS www.thiswormyworld.org Aim of practical This third and final practical aims to familiarize the trainees with the Print Composer, the
Guide to Mapping Website (Public) December 2016 GC_236594
 December 2016 GC_236594") Guide to Mapping Website (Public) December 2016 GC_236594 Table of Contents Guide to Mapping Website (Public)... 1 December 2016... 1 Quick Start... 3 Map Layers... 4 How do I?... 5 Draw on the Map...
Guide to Mapping Website (Public) December 2016 GC_236594 Table of Contents Guide to Mapping Website (Public)... 1 December 2016... 1 Quick Start... 3 Map Layers... 4 How do I?... 5 Draw on the Map...
CHAPTER 2 GEOREFERENCING AND SHAPEFILE CREATION
 CHAPTER 2 GEOREFERENCING AND SHAPEFILE CREATION Georeferencing is the process of assigning real-world coordinates to each pixel of the raster. These coordinates are obtained by doing field surveys - collecting
Press the Plus + key to zoom in. Press the Minus - key to zoom out. Scroll the mouse wheel away from you to zoom in; towards you to zoom out.
 Navigate Around the Map Interactive maps provide many choices for displaying information, searching for more details, and moving around the map. Most navigation uses the mouse, but at times you may also
To the GeoView System Overview Online Training Course
 Welcome! To the GeoView System Overview Online Training Course The Alberta Department of Energy provides GeoView as a mapping system to enable users to find geographic information in Alberta. GeoView retrieves
Starting the QGIS Program. Exercise 1: Exploring QGIS
 Exercise 1: Exploring QGIS In this exercise you will learn how to open maps, manipulate layers, add spatial data, change symbols, and navigate within QGIS. You will also learn to repair broken data links.
Geographical Information Systems Institute. Center for Geographic Analysis, Harvard University. LAB EXERCISE 1: Basic Mapping in ArcMap
 Harvard University Introduction to ArcMap Geographical Information Systems Institute Center for Geographic Analysis, Harvard University LAB EXERCISE 1: Basic Mapping in ArcMap Individual files (lab instructions,
GGR 375 QGIS Tutorial
 GGR 375 QGIS Tutorial With text taken from: Sherman, Gary E. Shuffling Quantum GIS into the Open Source GIS Stack. Free and Open Source Software for Geospatial (FOSS4G) Conference. 2007. Available online
Explore some of the new functionality in ArcMap 10
 Explore some of the new functionality in ArcMap 10 Scenario In this exercise, imagine you are a GIS analyst working for Old Dominion University. Construction will begin shortly on renovation of the new
Intro to GIS (requirements: basic Windows computer skills and a flash drive)
") Introduction to GIS Intro to GIS (requirements: basic Windows computer skills and a flash drive) Part 1. What is GIS. 1. System: hardware (computers, devices), software (proprietary or free), people. 2.
Introduction to GIS Intro to GIS (requirements: basic Windows computer skills and a flash drive) Part 1. What is GIS. 1. System: hardware (computers, devices), software (proprietary or free), people. 2.
Quantum GIS (QGIS) Basics: India
 Basics: India") Quantum GIS (QGIS) Basics: India Written by Barbara Parmenter and Irina Rasputnis, updated by Carolyn Talmadge, Aishwarya Venkat, and Kyle M. on March 6, 2017 INTRODUCTION... 1 STARTING QGIS AND ADDING
Quantum GIS (QGIS) Basics: India Written by Barbara Parmenter and Irina Rasputnis, updated by Carolyn Talmadge, Aishwarya Venkat, and Kyle M. on March 6, 2017 INTRODUCTION... 1 STARTING QGIS AND ADDING
Getting Started with VicMap
 Getting Started with VicMap This is a brief overview of some of the tools and features available on VicMap. At any time you can right click on the map and click Identify What s Here to find more information
QGIS Workshop Su Zhang and Laura Gleasner 11/15/2018. QGIS Workshop
 1. Introduction to QGIS QGIS Workshop QGIS is a free and open source Geographic Information System (GIS). QGIS can help users create, edit, visualize, analyze, and publish geospatial information on various
Segmentation Guide using open source resources By Paul Russell, Ana Carolina Fiorini, and Trevor Caughlin
 Segmentation Guide using open source resources By Paul Russell, Ana Carolina Fiorini, and Trevor Caughlin This guide aims to give you a step by step guidance to digitize tree cover in google earth using
Community Health Maps Lab Series
 Community Health Maps Lab Series Lab 6 Data Visualization with Carto Objective Understand how to upload and style data with Carto to create an online visualization of your data Document Version: 2017-08-28(Final)
City of La Crosse Online Mapping Website Help Document
 City of La Crosse Online Mapping Website Help Document This document was created to assist in using the new City of La Crosse online mapping sites. When the website is first opened, a map showing the City
Select the Parks within Forest Acres
 Select the Parks within Forest Acres TASKS RESULT 1. Add the county boundary, municipalities and parks (pts.) layers to your map 2. Save your map (.mxd) to your desktop Your map should look something like
The ArcMap Interface and Using Basic ArcMap Analysis Tools to Create a Map
 The ArcMap Interface and Using Basic ArcMap Analysis Tools to Create a Map *You will need a computer with ESRI ArcGIS Desktop version 9.3 or higher installed* Data Download 1. Save the zipped folder with
Low Cost and Free Public Health Mapping Tools
 Low Cost and Free Public Health Mapping Tools Quantum GIS - QGIS 1) Download and Install a) QGIS can be quickly and easily installed on Windows, Macs and Linux from installers found here: http://hub.qgis.org/projects/quantum-gis/wiki/download
Join Queries in Cognos Analytics Reporting
 Join Queries in Cognos Analytics Reporting Business Intelligence Cross-Join Error A join is a relationship between a field in one query and a field of the same data type in another query. If a report includes
QGIS Workshop Su Zhang and Laura Gleasner 11/10/2016. QGIS Workshop
 1. Introduction to Quantum GIS (QGIS) QGIS Workshop QGIS is a free and open source Geographic Information System (GIS). QGIS can help you create, edit, visualize, and publish geospatial information on
1. Download Federal Electoral Districts and add to map document
 1. Download Federal Electoral Districts and add to map document Federal Electoral Districts (FEDs) are the geographic areas for which one Member of Parliament is elected. It is downloaded as a shapefile
All data is in Universal Transverse Mercator (UTM) Zone 6 projection, and WGS 84 datum.
 Zone 6 projection, and WGS 84 datum.") 111 Mulford Hall, College of Natural Resources, UC Berkeley (510) 643-4539 EXPLORING MOOREA DATA WITH QUANTUM GIS In this exercise, you will be using an open-source FREE GIS software, called Quantum GIS,
111 Mulford Hall, College of Natural Resources, UC Berkeley (510) 643-4539 EXPLORING MOOREA DATA WITH QUANTUM GIS In this exercise, you will be using an open-source FREE GIS software, called Quantum GIS,
Map Direct Lite. Quick Start Guide: Map Layers 5/14/2018
 Map Direct Lite Quick Start Guide: Map Layers 5/14/2018 Contents Quick Start Guide: Map Layers... 1 Map Layers in Map Direct Lite.... 3 What is a Basemap Layer?... 4 Change the Basemap Using the Basemap
for ArcSketch Version 1.1 ArcSketch is a sample extension to ArcGIS. It works with ArcGIS 9.1
 ArcSketch User Guide for ArcSketch Version 1.1 ArcSketch is a sample extension to ArcGIS. It works with ArcGIS 9.1 ArcSketch allows the user to quickly create, or sketch, features in ArcMap using easy-to-use
WA L KT H R O U G H 1
 WA L KT H R O U G H 1 udig Install and Introduction 08 June 2008 TABLE OF CONTENTS 1Goals...3 2Installing and Running The udig Application...4 3Online Documentation and Tutorials...8 3.1Help Categories...9
Geospatial Day II Introduction to ArcGIS Editor for Open Street Map
 Geospatial Day II Introduction to ArcGIS Editor for Open Street Map Geospatial Operations Support Team (GOST) Katie McWilliams kmcwilliams@worldbankgroup.org GOST@worldbank.org 0 Using OSM for Network
Orchard Link Mapping Workshop (QGIS Training) Contact
 Contact") Orchard Link Mapping Workshop (QGIS Training) Contact email: info@neetmaps.co.uk for technical support, bespoke mapping or further information or visit www.neetmaps.co.uk 1 2 1: Introduction to QGIS What
Orchard Link Mapping Workshop (QGIS Training) Contact email: info@neetmaps.co.uk for technical support, bespoke mapping or further information or visit www.neetmaps.co.uk 1 2 1: Introduction to QGIS What
The Preparing for Success Online Mapping Tool
 The Preparing for Success Online Mapping Tool Baker Polito Administration The Executive Office of Housing and Economic Development and MassGIS Questions & Comments? Please contact MassWorks@state.ma.us
DWG FastView for Web. User Guide
 DWG FastView for Web User Guide Contents 1. Software installation and start-up... 1 1.1 Software installation... 1 1.2 Software start-up... 1 2.Operation interface and functions... 3 2.1 Operation interface...
Map Preparation. Using QGIS
 Map Preparation Using QGIS Tutorial ID: IGET_GIS_006 This tutorial has been developed by BVIEER as part of the IGET web portal intended to provide easy access to geospatial education. This tutorial is
Exercise 1-1: Using GPS track data to create a field boundary
 Exercise 1-1: Using GPS track data to create a field boundary Learning objectives: Add QGIS plugins Create a point vector file from a text file Convert GPS tracking points to a field boundary Data folder:
User Guide To CRITFC s Interactive Mappers
 User Guide To CRITFC s Interactive Mappers CRITFC is using ESRI products to build online interactive mapping applications for the display of general spatial and tabular data or for specific projects. The
Making a Sackville Coastal Flood Map
 Making a Sackville Coastal Flood Map Demo covers: Accessing and previewing map templates Modifying map elements such as titles, data frames, legends & scale bars Drawing a graphic on a map Adding text
DIRECTORY OF FOREST PRODUCTS INDUSTRIES APPLICATION USER GUIDE
 DIRECTORY OF FOREST PRODUCTS INDUSTRIES APPLICATION USER GUIDE Directory of Forest Products Industries Table of Contents 1 ABOUT THE DIRECTORY OF FOREST PRODUCTS INDUSTRIES... 4 1.1 ACCESSING THE DIRECTORY.
Community Health Maps Lab Series
 Community Health Maps Lab Series Lab 5 Cartography with QGIS Objective Understand how to style data and compose a map with QGIS Desktop Document Version: 2017-08-28(Final) This course is a collaborative
Norwegian Polar Institute, February 2018 Project website: quantarctica.npolar.no
 Get started with Quantarctica 3 Norwegian Polar Institute, February 2018 Project website: quantarctica.npolar.no Quantarctica is the result of an initiative by the Norwegian Polar Institute (NPI) to develop
OnCOR Silverlight Viewer Guide
 Getting Around There are many ways to move around the map! The simplest option is to use your mouse in the map area. If you hold the left button down, then click and drag, you can pan the map to a new
GEO 465/565 Lab 6: Modeling Landslide Susceptibility
 1 GEO 465/565 Lab 6: Modeling Landslide Susceptibility This lab will give you more practice in understanding and building a GIS analysis model. Recall from class lecture that a GIS analysis model is a
Exercise Producing Thematic Maps for Dissemination
 Exercise Producing Thematic Maps for Dissemination 2007 In this exercise you will work with an existing file geodatabase which contains administrative boundaries (named wards) feature class and population
Using GIS to Site Minimal Excavation Helicopter Landings
 Using GIS to Site Minimal Excavation Helicopter Landings The objective of this analysis is to develop a suitability map for aid in locating helicopter landings in mountainous terrain. The tutorial uses
Batch Clipping in Modeler Geomatica 2015 Tutorial
 In Geomatica, you can use the integration capabilities between Focus and Modeler to create custom models and combine tasks using batch processing. This tutorial shows you how to create a model to clip
Crop Counting and Metrics Tutorial
 Crop Counting and Metrics Tutorial The ENVI Crop Science platform contains remote sensing analytic tools for precision agriculture and agronomy. In this tutorial you will go through a typical workflow
USING DATA DRIVEN PAGES
 USING DATA DRIVEN PAGES Mid-West ESRI Utility User s Group Conference March 26, 2014 Presented by: Hillary Bjorstrom, GIS Analyst STAR Energy Services LLC Alexandria, Minnesota EXERCISE 1 CREATING A GRID
QGIS for Geoscientists
 QGIS for Geoscientists Robin Armit, Tom Carmichael, Lachlan Grose Monash Structural Geophysics group 22 nd 26th February 2016 GIS A geographic information system (GIS) is a system designed to capture,
Lesson 8 : How to Create a Distance from a Water Layer
 Created By: Lane Carter Advisor: Paul Evangelista Date: July 2011 Software: ArcGIS 10 Lesson 8 : How to Create a Distance from a Water Layer Background This tutorial will cover the basic processes involved
Out of the Office and Into the Field: Introduction to ArcPad and ArcPad Application Builder
 Out of the Office and Into the Field: Introduction to ArcPad and ArcPad Application Builder A Yale Map Collection GIS Workshop Preparing For the Tutorial 1. Navigate to the C:\Temp folder on your harddrive.
GIS Basics for Urban Studies
 GIS Basics for Urban Studies Date: March 21, 2018 Contacts: Mehdi Aminipouri, Graduate Peer GIS Faciliator, SFU Library (maminipo@sfu.ca) Keshav Mukunda, GIS & Map Librarian Librarian for Geography (kmukunda@sfu.ca)
Step by Step GIS. Section 1
 Step by Step GIS Section 1 Contact the web page given below for the data required to do the exercises (http://www.pasda.psu.edu/default.asp) Before beginning the tutorials please visit the Preparation
Second Summer School on Digital Tools for Humanists. Instructions for the hands-on tutorial on GIS
 Second Summer School on Digital Tools for Humanists Instructions for the hands-on tutorial on GIS Augusto Ciuffoletti Dipartimento di Informatica - Università di Pisa Pisa - June 2018 Abstract This document
MapInfo Stratus. Version 41. MapInfo Stratus Administration Guide
 MapInfo Stratus Version 41 MapInfo Stratus Administration Guide Contents Chapter 1: Getting Started...7 Signing In and Out...8 Home...8 Version Number and Build Number...9 Using MapInfo Stratus Administration
Census Small Area Population Statistics (SAPS) A Guide to using the SAPMAP web application
 A Guide to using the SAPMAP web application") Census Small Area Population Statistics (SAPS) A Guide to using the SAPMAP web application 1 When you open the application you will see this page. This screen gives a brief description of the application.
Census Small Area Population Statistics (SAPS) A Guide to using the SAPMAP web application 1 When you open the application you will see this page. This screen gives a brief description of the application.
Interactive Maps Purpose: Login to the System: Interactive Maps ONTINUE AGREE
 Interactive Maps Purpose: The purpose of this application is to provide the facility to the citizen to navigate to a Property through an On-line Free Web Application in real time. The application uses
User Guide. Web Intelligence Rich Client. Business Objects 4.1
 User Guide Web Intelligence Rich Client Business Objects 4.1 2 P a g e Web Intelligence 4.1 User Guide Web Intelligence 4.1 User Guide Contents Getting Started in Web Intelligence 4.1... 5 Log into EDDIE...
How to view details for your project and view the project map
 Tutorial How to view details for your project and view the project map Objectives This tutorial shows how to access EPANET model details and visualize model results using the Map page. Prerequisites Login
Reset Cursor Tool Clicking on the Reset Cursor tool will clear all map and tool selections and allow tooltips to be displayed.
 SMS Featured Icons: Mapping Toolbar This document includes a brief description of some of the most commonly used tools in the SMS Desktop Software map window toolbar as well as shows you the toolbar shortcuts
Town of Amherst, NY. GIS Map Machine User Guide. Map Window Search Functions. Help. Toolbar. Layer Control. Scale Bar
 Town of Amherst, NY GIS Map Machine User Guide Toolbar Map Window Search Functions Help Layer Control Scale Bar Map Window Main Elements The MAP WINDOW is the main focus of the screen and where the map
Full Search Map Tab. This map is the result of selecting the Map tab within Full Search.
 Full Search Map Tab This map is the result of selecting the Map tab within Full Search. This map can be used when defining your parameters starting from a Full Search. Once you have entered your desired
US Geo-Explorer User s Guide. Web:
 US Geo-Explorer User s Guide Web: http://usgeoexplorer.org Updated on October 26, 2016 TABLE OF CONTENTS Introduction... 3 1. System Interface... 5 2. Administrative Unit... 7 2.1 Region Selection... 7
Mapping Census data in QGIS
 Mapping Census data in QGIS Contents Contents 1. Introduction...3 1.1. Census data...3 1.2. Boundary data...3 1.3. Mapping software...3 2. Obtain your census data...4 Step 1: Geography...4 Step 2: Topics...5
The user guide may be freely distributed in its entirety, either digitally or in printed format, to all EPiServer Composer users.
 Copyright This user guide is protected by the Copyright Act. Changes to the contents, or partial copying of the contents, may not be made without permission from the copyright holder. The user guide may
Tutorial Base Module
 Tutorial Base Module CONTENTS Part 1 - Introduction to the CycloLog desktop... 7 1.1 Introduction to the CycloLog desktop... 7 1.2 Using Log Data panes... 9 Part 2 - Importing and displaying well log data...
-In windows explorer navigate to your Exercise_4 folder and right-click the DEC_10_SF1_P1.csv file and choose Open With > Notepad.
 BIOL 4460/5460 and GEOL 4460 Introduction to GIS LAB 4 MAKING A THEMATIC MAP This exercise is to show you how to create a map for printing. As you have seen in the lecture, maps can have different purposes
ArcView QuickStart Guide. Contents. The ArcView Screen. Elements of an ArcView Project. Creating an ArcView Project. Adding Themes to Views
 ArcView QuickStart Guide Page 1 ArcView QuickStart Guide Contents The ArcView Screen Elements of an ArcView Project Creating an ArcView Project Adding Themes to Views Zoom and Pan Tools Querying Themes
Introduction to web page creation
 Introduction to web page creation Step 1: Planning website and page layouts... 2 Step 2: Demonstrating Mediator... 2 Step 3: Linking the pages... 6 Step 4: Exporting your files... 6 MatchWare Page 1 Step
Launch QGIS. Launch QGIS from. Open window Quantum GIS (Figure 1.1 below) Start All Programs Quantum GIS. QGISIcon on the desk top
 Start All Programs Quantum GIS. QGISIcon on the desk top") QGIS Launch QGIS Launch QGIS from Start All Programs Quantum GIS OR QGISIcon on the desk top Open window Quantum GIS (Figure 1.1 below) 2 Figure 1.1 3 Opening Raster For this exercise we demonstrate three
QGIS Launch QGIS Launch QGIS from Start All Programs Quantum GIS OR QGISIcon on the desk top Open window Quantum GIS (Figure 1.1 below) 2 Figure 1.1 3 Opening Raster For this exercise we demonstrate three
EDINA Workshop: Creating a Campus Map and Displaying it in OpenLayers
 Contents Introduction... 2 What steps are involved?... 3 Before you start... 4 Create your campus map... 5 1. Load the basemap data into ArcMap... 5 2. Set up Symbology and Labels of Layers... 6 Improve
SUMMARY... 1 FIGURES... 1 INTRODUCTION... 1 LAYERS PANEL... 2 MAP PANEL...10
 MapStore Guide Summary SUMMARY... 1 FIGURES... 1 INTRODUCTION... 1 LAYERS PANEL... 2 MAP PANEL...10 Figures FIGURE 1: LAYER PANEL DRAG-AND-DROP... 2 FIGURE 2: LAYER TAB TOOLBAR... 2 FIGURE 3: AVAILABLE
MapInfo2Leaflet. User Guide TWIAV.NL
 MapInfo2Leaflet User Guide TWIAV.NL Version 0.35 7 November 2014 Table of Contents 1. Introduction... 2 2. Export a MapInfo Table to a Web Map Application using Leaflet... 3 2.1. Preparation: open a table
Mn/DOT MnCMAT Crash Analysis Application Help
 Mn/DOT MnCMAT Crash Analysis Application Contents Login... 5 User Login Dialog... 5 Login... 5 Request Access Dialog... 5 Forgotten Password Dialog... 6 Create/Open Project... 7 Create/Open Project Dialog...
MAPLOGIC CORPORATION. GIS Software Solutions. Getting Started. With MapLogic Layout Manager
 MAPLOGIC CORPORATION GIS Software Solutions Getting Started With MapLogic Layout Manager Getting Started with MapLogic Layout Manager 2011 MapLogic Corporation All Rights Reserved 330 West Canton Ave.,
Viewing the Data 3 Turning Layers On / Off 4 Navigation Toolbar 5 Layout Toolbar 7 Identify Tool 8 Find Tool 10 Measure Tool 12 Go To XY Tool 14
 1 Viewing the Data 3 Turning Layers On / Off 4 Navigation Toolbar 5 Layout Toolbar 7 Identify Tool 8 Find Tool 10 Measure Tool 12 Go To XY Tool 14 Transparency Tool 16 Markup Tools 19 ArcMap Markup Tools
Microsoft Access 2010
 Microsoft Access 2010 Chapter 2 Querying a Database Objectives Create queries using Design view Include fields in the design grid Use text and numeric data in criteria Save a query and use the saved query
GIS Exercise 10 March 30, 2018 The USGS NCGMP09v11 tools
 GIS Exercise 10 March 30, 2018 The USGS NCGMP09v11 tools As a result of the collaboration between ESRI (the manufacturer of ArcGIS) and USGS, ESRI released its Geologic Mapping Template (GMT) in 2009 which
Tutorial 01 Quick Start Tutorial
 Tutorial 01 Quick Start Tutorial Homogeneous single material slope No water pressure (dry) Circular slip surface search (Grid Search) Intro to multi scenario modeling Introduction Model This quick start
RAPIDMAP Geocortex HTML5 Viewer Manual
 RAPIDMAP Geocortex HTML5 Viewer Manual This site was developed using the evolving HTML5 web standard and should work in most modern browsers including IE, Safari, Chrome and Firefox. Even though it was
VANGUARD LOAD TAP CHANGER ANALYZER (LTCA) VERSION 2.xx SOFTWARE MANUAL. LTCA-10, LTCA-40, WRM-10P, WRM-40, TRM-20, TRM-40, TRM-203, and TRM-403
 VERSION 2.xx SOFTWARE MANUAL. LTCA-10, LTCA-40, WRM-10P, WRM-40, TRM-20, TRM-40, TRM-203, and TRM-403") VANGUARD LOAD TAP CHANGER ANALYZER (LTCA) VERSION 2.xx SOFTWARE MANUAL For Use with Vanguard s LTCA-10, LTCA-40, WRM-10P, WRM-40, TRM-20, TRM-40, TRM-203, and TRM-403 Load Tap Changer Analyzers and Winding
VANGUARD LOAD TAP CHANGER ANALYZER (LTCA) VERSION 2.xx SOFTWARE MANUAL For Use with Vanguard s LTCA-10, LTCA-40, WRM-10P, WRM-40, TRM-20, TRM-40, TRM-203, and TRM-403 Load Tap Changer Analyzers and Winding
Map Viewer User Guide
 Map Viewer User Guide Sea Level Scenario Sketch Planning Tool Version 2, 2017 University of Florida GeoPlan Center Introduction The purpose of this document is to guide users on how to use the Sea Level
Microsoft Access 2013
 Microsoft Access 2013 Chapter 2 Querying a Database Objectives Create queries using Design view Include fields in the design grid Use text and numeric data in criteria Save a query and use the saved query
Microsoft Access 2013
 Microsoft Access 2013 Chapter 2 Querying a Database Objectives Create queries using Design view Include fields in the design grid Use text and numeric data in criteria Save a query and use the saved query
Exercise 1: An Overview of ArcMap and ArcCatalog
 Exercise 1: An Overview of ArcMap and ArcCatalog Introduction: ArcGIS is an integrated collection of GIS software products for building a complete GIS. ArcGIS enables users to deploy GIS functionality
_Tutorials. Arcmap. Linking additional files outside from Geodata
 _Tutorials Arcmap Linking additional files outside from Geodata 2017 Sourcing the Data (Option 1): Extracting Data from Auckland Council GIS P1 First you want to get onto the Auckland Council GIS website
GY301 Geomorphology Lab 5 Topographic Map: Final GIS Map Construction
 GY301 Geomorphology Lab 5 Topographic Map: Final GIS Map Construction Introduction This document describes how to take the data collected with the total station for the campus topographic map project and
Visual Studies Exercise.Topic08 (Architectural Paleontology) Geographic Information Systems (GIS), Part I
 Geographic Information Systems (GIS), Part I") ARCH1291 Visual Studies II Week 8, Spring 2013 Assignment 7 GIS I Prof. Alihan Polat Visual Studies Exercise.Topic08 (Architectural Paleontology) Geographic Information Systems (GIS), Part I Medium: GIS
ARCH1291 Visual Studies II Week 8, Spring 2013 Assignment 7 GIS I Prof. Alihan Polat Visual Studies Exercise.Topic08 (Architectural Paleontology) Geographic Information Systems (GIS), Part I Medium: GIS
Student Manual. Cognos Analytics
 Student Manual Cognos Analytics Join Queries in Cognos Analytics Reporting Cross-Join Error A join is a relationship between a field in one query and a field of the same data type in another query. If
STEPS FOR DIGITIZING TAX MAPS
 STEPS FOR DIGITIZING TAX MAPS TO START A NEW DISTRICT/CORP. 1) Start AutoCAD Map 5 2) From start-up dialog box, a) Pick Create Project on the tab b) Select Start from Scratch to begin c) Click on Metric
Biodiversity GIS (BGIS) Internet Mapping User Guide
 Internet Mapping User Guide") Biodiversity GIS (BGIS) Internet Mapping User Guide http://bgis.sanbi.org Contents 1 Basic Introduction to BGIS Website (http://bgis.sanbi.org)... 6 1.1 LUDS... 6 1.2 Projects... 6 1.3 Services... 6 1.4
Biodiversity GIS (BGIS) Internet Mapping User Guide http://bgis.sanbi.org Contents 1 Basic Introduction to BGIS Website (http://bgis.sanbi.org)... 6 1.1 LUDS... 6 1.2 Projects... 6 1.3 Services... 6 1.4
GIS LAB 1. Basic GIS Operations with ArcGIS. Calculating Stream Lengths and Watershed Areas.
 GIS LAB 1 Basic GIS Operations with ArcGIS. Calculating Stream Lengths and Watershed Areas. ArcGIS offers some advantages for novice users. The graphical user interface is similar to many Windows packages