Mapping discarded needles in Fusion Tables Tutorial
|
|
|
- Melinda Dickerson
- 5 years ago
- Views:
Transcription
1 Mapping discarded needles in Fusion Tables Tutorial In the previous tutorials, we ve learned how to turn pivot tables into heat maps and place colour code geographic points using markers that Fusion Tables recognizes. The rational for this tutorial using discarded needles reported to the city of Ottawa is to show how you can map the locations were city inspectors found the needles, and then show the hot spots on a heat map. We will then use the same data set for a tutorial in Tableau to show you how you can use the same data set to create yet a third visualization. First a word about discarded needles data. Obtained using the city of Ottawa s Freedom-of-Information Act, it s a subset of a larger database of 311 calls on the city of Ottawa s open data website. The difference here is that this data base contains exact addresses where city inspectors with Ottawa s property standards branch picked up discarded needles. The specific address allow us to create a heat map -- something we can also do with the city s data on its website because the categories are broken down by ward -- and place the locations on a map. CBC News and the Toronto Star have used this data to tell stories. So let s get started. 1) Download the discarded syringe table by clicking here. 2) Copy the table in the master worksheet, paste it in a new worksheet named WorkingCopy. 3) Insert a column to the right of the Date column and call it Year.


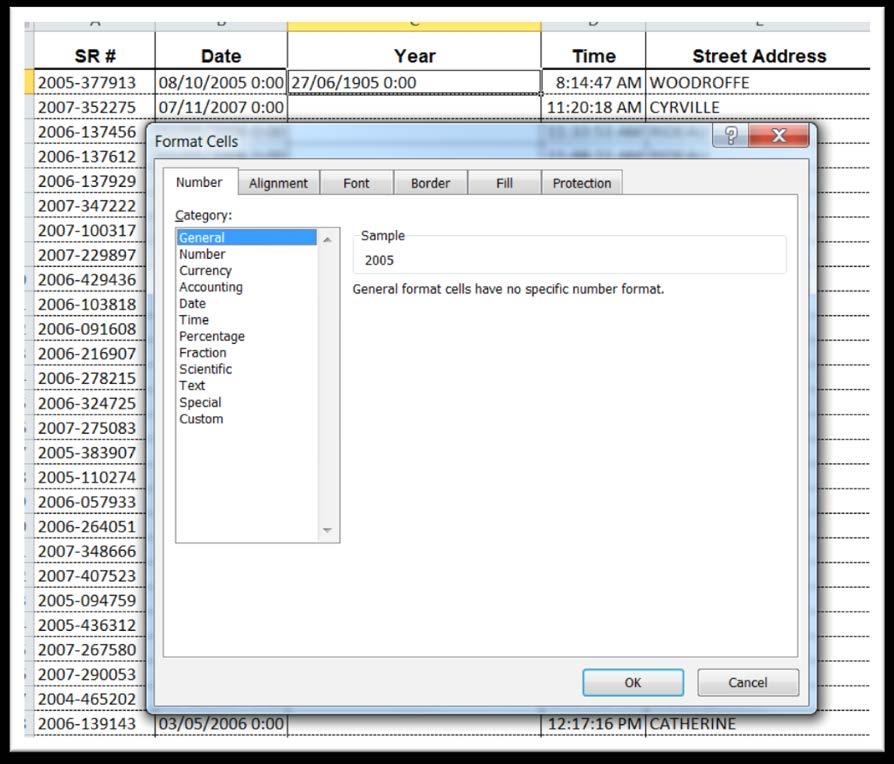
2 4) Use the Year function to pull the year out of the date column. 5) Before copying the formula to the bottom of the table, be sure to format the value as General.

3
 We ll use a concatenation function (pages 96 to 97 in our textbook) to combine the columns E,F and G.")
4 6) Highlight the Call Description column and insert a column to the left. 7) Call it Address_New. 8) We ll use a concatenation function (pages 96 to 97 in our textbook) to combine the columns E,F and G. We must combine the address information because Fusion Tables needs a whole address in order to place the locations on a map. 9) Notice the space between the quotation marks. Translated into English, the function in the screen shot above means that we have used the ampersand <&> to combine the bits in the three columns,

5 separated by spaces to make the addresses easier to read. 10) We re almost there. But Google s Fusion Tables needs a bit more information to ensure that these addresses get placed in Ottawa and not some other city that may have a similar address. 11) So let s add a new field to the right of Address_New, and call it, Address_For_FT.
 Make sure Ottawa, Ontario, Canada is within quotation marks, as you can see in the screenshot above.")
 16) Now let s pull the numbers out of the Ward column, allowing us to merge the ward number with the similar column")
6 12) We will use a variation of the concatenation function to add the city, province and country to each address. 13) Make sure Ottawa, Ontario, Canada is within quotation marks, as you can see in the screenshot above. 14) Copy to the bottom. 15) 16) Now let s pull the numbers out of the Ward column, allowing us to merge the ward number with the similar column the Ward KML file we already have uploaded to our Google Drive. 17) We ll use the Text to Columns option to separate the numbers.
 Excel considers it a delimited file because a space separates the name WARD from the number. 20) Choose the Next tab.")
7 18) Highlight the Ward column, and click on the Text to Columns option (covered on pages 97 and 98 of the textbook). 19) Excel considers it a delimited file because a space separates the name WARD from the number. 20) Choose the Next tab. 21) Excel will always default to Tab.
 This tells Excel where to create a new")
8 22) We want space, so check that box. 23) This tells Excel where to create a new column.

9 24) Select Next and then Finish. 25) Excel wants to know if it s okay for the new column containing the numbers to replace the contents in the adjacent cells. In this case it s fine, because the column is blank. This might not be the case if we were using the Text to Column option in the middle of a table with columns on either side.
 But first, we re going to plot the individual addresses in the Address_For_FT column on a map.")
10 26) Select the OK tab. 27) Label column M Ward_No. 28) This is the column we ll merge with the corresponding column in the Ward KML file to create a heat map. 29) But first, we re going to plot the individual addresses in the Address_For_FT column on a map. 30) To make the data set manageable for readers, let s select the two most recent years, 2012 and 2013, which, when sorting column B in descending order, tell us that the most recent date is Sept. 12, 2013.

11 31)
 Label the worksheet Syringes. (NOTE: MAKE SURE THAT YOU CREATE A NEW WORKSHEET FOR THIS TABLE. FUSION TABLES CAN ONLY HANDLE WORKBOOKS WITH SINGLE WORKSHEETS.")
12 32) Filter the table for the years 2012 and 2013, giving us 272 records out of a total of ) Select the filtered table, copy and paste it into a new worksheet, which you can call SyringesforFT. 34) Label the worksheet Syringes. (NOTE: MAKE SURE THAT YOU CREATE A NEW WORKSHEET FOR THIS TABLE. FUSION TABLES CAN ONLY HANDLE WORKBOOKS WITH SINGLE WORKSHEETS. IF YOU FORGET TO DO THIS, THEN FUSION TABLES WILL DEFAULT TO THE FIRST WORKSHEET IN THE WORKBOOK.)
13 35) Upload the file to Fusion Tables.
14 36) The yellow means that Fusion Tables has recognized our new address column as the one to geocode ( a process discussed in our textbook s mapping section on page 206 and 207 ). 37) If it didn t, you d have to manually change the data type for this column from text to location by going to the Edit from the menu above, and then to the Change columns option. 38) Fortunately, we don t have to do this. To see what this table looks like on a map, select the Map of Address tab at the top right.

15 39) The geocoding could take a minute or two. So be patient. The larger the data set, the more time it takes, one of the reasons we filtered our data for the period of 2012 and the first nine months of 2013.


16
 Let s give ourselves the ability to allow people to search this map by selecting the ward number.")
17 40) You can follow the steps from the previous mapping tutorial to clean up your pop-up box. 41) Once you re happy with the result, share it and get the embed code for your blog post. 42) Let s give ourselves the ability to allow people to search this map by selecting the ward number. To do this, we ll dip into another tutorial (from another course) on mapping Toronto parking-infraction data. Steps explaining how to use the wizard, begins on the tutorial s page ) To learn how to embed the code from the Fusion Table Layer Wizard, consult this tutorial. 44) Your result should look like this screen grab, which you can also find here.
 Return to our workingcopy worksheet, create a pivot table for the years 2012 and 2013, and sort the results in the Grand Total column in descending order to")
18 45) Now that we have a visualization that we can filter according to, let s create a heat map that will allow us to identify hot spots. 46) Return to our workingcopy worksheet, create a pivot table for the years 2012 and 2013, and sort the results in the Grand Total column in descending order to see which wards have the
19 highest numbers. 47) If you re happy with the result, copy the pivot table, using Excel s paste special to paste the table into a new worksheet. 48) Clean up the top by deleting the extraneous row 49) Rename column A, Ward_No. (Which you can also rename in FT) delete the Grand Total row at the bottom, but be sure to keep the Grand Total column.
 What we ve done so far is to create a master Excel workbook that contains all the original files we ll use for each visualization.")
20 50) Rename the worksheet DiscardedSyringesforHeatMap. 51) What we ve done so far is to create a master Excel workbook that contains all the original files we ll use for each visualization. 52) Copy this worksheet, paste it into a new Excel workbook, and name it DiscardedSyringesforHeatMap 53) Name the worksheet DiscardedSyinges, and upload it to Fusion Tables.
21 54) 55) You may notice that some of the ward numbers are missing. That s because not every ward contains discarded needles. It turns out wards, 3, 5, 6 and 20 contain no needles. This means that the ward numbers in the KML file we downloaded will not have any corresponding numbers, leaving blanks in our heat map. This didn t matter in the previous step, because we were only placing the needle locations on the map, irrespective of what ward they were in.
22 56) And if we were only creating a graphic ( as we will eventually do in Tableau ), this wouldn t matter much. But for a map, blank spots looks strange. To get around this problem, let s assign zero values to the four wards we ve mentioned. 57) There are two ways to do this. You can add add rows to the table that you ve uploaded.
23
24 58) Or, you can do the same in your original Excel file, which you d have to upload again.
 Now use the steps we learned in the Mapping Ottawa Crime Rate Tutorial to merge this discarded syringe")
25 59) 60) Either method is fine. 61) Now use the steps we learned in the Mapping Ottawa Crime Rate Tutorial to merge this discarded syringe table with the Ottawa Wards KML file which is already on your Google Drive. If you
26 still need to download a version, please click here.
 It s best to do this, by sorting the row containing the values we care most about Grand_Total in descending order from 120 to 0.")
27 62) Select the Map of geometry tab to see the result. 63) It s all the same colour. As we learned in the previous Mapping Crime Rate Tutorial, we have to assign colours to each set of values. 64) It s best to do this, by sorting the row containing the values we care most about Grand_Total in descending order from 120 to 0. 65) Let s make the zeros the category one, the lowest ranking; one-to-five, the second; five-to-10, the third, 14, the fourth; 26, the fifth, 49, the sixth; and120, the seventh. 66) It s best to use one colour ramp for each category, except for the hot spot, 120, which we will assign the colour black. In order to ensure the map is as vibrant as it can be, increase each colour s
 The hot spot, Rideau-Vanier, is in black.")
28 opacity to 100%. 67) You can see that our zeros are the lightest colours. Had we not assigned zeros to those wards with no discarded syringes, Google would have left us with blank spaces. 68) The hot spot, Rideau-Vanier, is in black. 69) You ll also notice that we ve given the legend an appropriate title so people understand that they re seeing.
29 70) So far in this tutorial, Fusion Tables has given us two ways of visualizing data on a map with the help of a KML file of Ottawa ward boundaries. Although Fusion Tables is excellent for mapping trends, it can also create tables. However, we will use another tool to accomplish this task, one that creates interactive tables and maps, allowing the audience additional ways to interact with your data. 71) You ll find that tutorial by clicking here. 72) And for look at the visualizations on one page, click here.
Tutorial for downloading the city of Ottawa s monthly service request submissions data
 Tutorial for downloading the city of Ottawa s monthly service request submissions data Which ward has the gets the most noise complaints in the summer? Where are the city s graffiti hotspots? Which residents
Tutorial for mapping Toronto s 2013 fire hydrant parking ticket data
 Tutorial for mapping Toronto s 2013 fire hydrant parking ticket data Toronto, like cities including Vancouver, Edmonton, Ottawa and Halifax, has an open data site with lots of great data to download. The
Tutorial for analyzing and mapping contaminated sites data
 Tutorial for analyzing and mapping contaminated sites data The federal government oversees thousands of sites that are contaminated with a number of pollutants such as petroleum hydrocarbons, a mixture
TUTORIAL FOR IMPORTING OTTAWA FIRE HYDRANT PARKING VIOLATION DATA INTO MYSQL
 TUTORIAL FOR IMPORTING OTTAWA FIRE HYDRANT PARKING VIOLATION DATA INTO MYSQL We have spent the first part of the course learning Excel: importing files, cleaning, sorting, filtering, pivot tables and exporting
Tableau tutorial using the city of Ottawa crime Data
 Tableau tutorial using the city of Ottawa 2011-2013 crime Data Tableau is a free tool that according to its mission statement helps people see and understand data. The program helps the people for whom
Chapter 7. Buffering in QGIS Desktop
 Chapter 7 Buffering in QGIS Desktop Summary: How far away is that? How many are too close? These are some of the most compelling mapping questions journalists can ask. A buffer is one of the most useful
Buffering in ArcMap tutorial
 Buffering in ArcMap tutorial 1) Open ArcMap 2) Bring in the Wards_2010 and Parks shape files from the city of Ottawa s open data portal. (NOTE: for the purposes of this tutorial, you could also bring in
Chapter 7. Joining Maps to Other Datasets in QGIS
 Chapter 7 Joining Maps to Other Datasets in QGIS Skills you will learn: How to join a map layer to a non-map layer in preparation for analysis, based on a common joining field shared by the two tables.
TUTORIAL FOR IMPORTING OTTAWA FIRE HYDRANT PARKING VIOLATION DATA INTO MYSQL
 TUTORIAL FOR IMPORTING OTTAWA FIRE HYDRANT PARKING VIOLATION DATA INTO MYSQL We have spent the first part of the course learning Excel: importing files, cleaning, sorting, filtering, pivot tables and exporting
Selecting Attributes and Location in QGIS Desktop
 Chapter 7 Selecting Attributes and Location in QGIS Desktop Summary: This tutorial covers selecting features in QGIS. If you are unfamiliar with the basics of the QGIS user interface, please read the tutorial
Excel Tables and Pivot Tables
 A) Why use a table in the first place a. Easy to filter and sort if you only sort or filter by one item b. Automatically fills formulas down c. Can easily add a totals row d. Easy formatting with preformatted
The Data Journalist Chapter 7 tutorial Geocoding in ArcGIS Desktop
 The Data Journalist Chapter 7 tutorial Geocoding in ArcGIS Desktop Summary: In many cases, online geocoding services are all you will need to convert addresses and other location data into geographic data.
Tableau Tutorial Using Canadian Arms Sales Data
 Tableau Tutorial Using Canadian Arms Sales Data 1) Your data comes from Industry Canada s Trade site. 2) If you don t want to download the data yourself, use this file. You can also download it from the
Census tutorial using the city of Ottawa s wards
 Census tutorial using the city of Ottawa s wards Every five years, Statistics Canada uses the Census Program to collect vital data about Canadians that paints a portrait of who we are. Traditionally, the
ADVANCED INQUIRIES IN ALBEDO: PART 2 EXCEL DATA PROCESSING INSTRUCTIONS
 ADVANCED INQUIRIES IN ALBEDO: PART 2 EXCEL DATA PROCESSING INSTRUCTIONS Once you have downloaded a MODIS subset, there are a few steps you must take before you begin analyzing the data. Directions for
MIS0855: Data Science In-Class Exercise for Mar Creating Interactive Dashboards
 MIS0855: Data Science In-Class Exercise for Mar 25-27 Creating Interactive Dashboards Objective: Create a dashboard with interactive data filtering using Tableau Learning Outcomes: Understand how to create
Table JESSICA MILLER WCLS COORDINATOR
 Google Fusion Table JESSICA MILLER WCLS COORDINATOR JMILLER@CITLIB.ORG Purpose Google Fusion Tables is a data management tool that allows you to come to new conclusions about your data by seeing it in
Mapping with Google Fusion Tables
 Mapping with Google Fusion Tables You will learn how to transform location information stored in an Excel spreadsheet to a format that can be mapped directly with Google Fusion Tables. Format of Data within
Tutorial: Create an Excel Dashboard. Overview. **** Download the Example Dashboard ****
 Tutorial: Create an Excel Dashboard This page walks through building an Excel dashboard with a mobile tool called CommCare. Similar to how Excel helps people build spreadsheets, CommCare enables anyone
Part one of an Excel tutorial using the the Alberta Sunshine List Data
 Part one of an Excel tutorial using the the Alberta Sunshine List Data Given that most of you are on Macs, your Excel interfaces will be different from mine. Still, the tutorial and screenshots will give
LEIAG-Excel Workshop
 Random Sample Excel has a simple formula we can utilize to obtain a random sample (cases, citations, city, etc.) At the Sheriff s Department, we are able to run a case management report that generates
MIS 0855 Data Science (Section 006) Fall 2017 In-Class Exercise (Day 15) Creating Interactive Dashboards
 Fall 2017 In-Class Exercise (Day 15) Creating Interactive Dashboards") MIS 0855 Data Science (Section 006) Fall 2017 In-Class Exercise (Day 15) Creating Interactive Dashboards Objective: Create a dashboard with interactive data filtering using Tableau Learning Outcomes: Understand
MIS 0855 Data Science (Section 006) Fall 2017 In-Class Exercise (Day 15) Creating Interactive Dashboards Objective: Create a dashboard with interactive data filtering using Tableau Learning Outcomes: Understand
The first thing we ll need is some numbers. I m going to use the set of times and drug concentration levels in a patient s bloodstream given below.
 Graphing in Excel featuring Excel 2007 1 A spreadsheet can be a powerful tool for analyzing and graphing data, but it works completely differently from the graphing calculator that you re used to. If you
How to Excel - Part 2
 Table of Contents Exercise 1: Protecting cells and sheets... 3 Task 1 Protecting sheet... 3 Task 2 Protecting workbook... 3 Task 3 Unprotect workbook and sheet... 3 Task 4 Protecting cells... 4 Protecting
Filter and PivotTables in Excel
 Filter and PivotTables in Excel FILTERING With filters in Excel you can quickly collapse your spreadsheet to find records meeting specific criteria. A lot of reporters use filter to cut their data down
Tutorial for downloading and analyzing data from the Atlantic Canada Opportunities Agency
 Tutorial for downloading and analyzing data from the Atlantic Canada Opportunities Agency The agency, which goes by the acronym ACOA, is one of many federal institutions that uploads data to the federal
Tutorial: Getting Data into Your Spreadsheet
 Chapter 4 Tutorial: Getting Data into Your Spreadsheet Summary: Getting information into Excel is similar to working with a Word document. To enter text and data, you can simply click on the cell and begin
Using pivot tables in Excel (live exercise with data)
") Using pivot tables in Excel (live exercise with data) In chapter four, we used B.C. s political donations data to learn how to build pivot tables, which group elements in your data and summarize the information
Using pivot tables in Excel (live exercise with data) In chapter four, we used B.C. s political donations data to learn how to build pivot tables, which group elements in your data and summarize the information
Using Pivot Tables in Excel (Live Exercise with Data)
") Chapter 4 Using Pivot Tables in Excel (Live Exercise with Data) In chapter four, we used B.C. s political donations data to learn how to build pivot tables, which group elements in your data and summarize
Chapter 4 Using Pivot Tables in Excel (Live Exercise with Data) In chapter four, we used B.C. s political donations data to learn how to build pivot tables, which group elements in your data and summarize
TUTORIAL Get Started with Tableau Desktop
 TUTORIAL Get Started with Tableau Desktop Learn how to connect to data, create data visualizations, present your findings, and share your insights with others. http://onlinehelp.tableau.com/current/guides/get-started-tutorial/en-us/get-started-tutorialhome.html
Tutorial for downloading and analyzing data from the Atlantic Canada Opportunities Agency
 Tutorial for downloading and analyzing data from the Atlantic Canada Opportunities Agency The agency, which goes by the acronym ACOA, is one of many federal institutions that uploads data to the federal
Data to App: Web,Tablet and Smart Phone Duane Griffith, Montana State University,
 Data to App: Web,Tablet and Smart Phone Duane Griffith, Montana State University, griffith@montana.edu This tutorial is broken into several steps related mostly to the technology applied at each step.
Chapter 6. Building Maps with ArcGIS Online
 Chapter 6 Building Maps with ArcGIS Online Summary: ArcGIS Online is an on-line mapping software that allows you to upload tables with latitude and longitude geographic coordinates to create map layers
Mapping with Google Fusion Tables
 Mapping with Google Fusion Tables You will learn how to transform location information stored in an Excel spreadsheet to a format that can be mapped directly with the Google Fusion Tables. Format of Data
Excel Tips for Compensation Practitioners Weeks Text Formulae
 Excel Tips for Compensation Practitioners Weeks 70-73 Text Formulae Week 70 Using Left, Mid and Right Formulae When analysing compensation data, you generally extract data from the payroll, the HR system,
A cell is highlighted when a thick black border appears around it. Use TAB to move to the next cell to the LEFT. Use SHIFT-TAB to move to the RIGHT.
 Instructional Center for Educational Technologies EXCEL 2010 BASICS Things to Know Before You Start The cursor in Excel looks like a plus sign. When you click in a cell, the column and row headings will
Tutorial for mapping Census 2016 data in Qgis by census tracts
 Tutorial for mapping Census 2016 data in Qgis by census tracts Skills you will learn: How to join a Census 2016 map layer to a Census 2016 non-map layer, based on a common joining field shared by the two
SPREADSHEETS. (Data for this tutorial at
 SPREADSHEETS (Data for this tutorial at www.peteraldhous.com/data) Spreadsheets are great tools for sorting, filtering and running calculations on tables of data. Journalists who know the basics can interview
User Manual Mail Merge
 User Manual Mail Merge Version: 1.0 Mail Merge Date: 27-08-2013 How to print letters using Mail Merge You can use Mail Merge to create a series of documents, such as a standard letter that you want to
DecisionPoint For Excel
 DecisionPoint For Excel Getting Started Guide 2015 Antivia Group Ltd Notation used in this workbook Indicates where you need to click with your mouse Indicates a drag and drop path State >= N Indicates
Chart Wizard: Step 1 (Chart Types)
") Chart Wizard: Step 1 (Chart Types) 1. Select the chart type you want to use. You can choose from either the Standard Types tab or the Custom Types tab. Click and hold the button labeled Press and hold
Chart Wizard: Step 1 (Chart Types) 1. Select the chart type you want to use. You can choose from either the Standard Types tab or the Custom Types tab. Click and hold the button labeled Press and hold
 » How do I Integrate Excel information and objects in Word documents? How Do I... Page 2 of 10 How do I Integrate Excel information and objects in Word documents? Date: July 16th, 2007 Blogger: Scott Lowe
Select the Points You ll Use. Tech Assignment: Find a Quadratic Function for College Costs
 In this technology assignment, you will find a quadratic function that passes through three of the points on each of the scatter plots you created in an earlier technology assignment. You will need the
Step 1 Make a folder for chart workbooks in your excel folder, Open Excel and Save your File
 Step 1 Make a folder for chart workbooks in your excel folder, Open Excel and Save your File Open up MS Excel 2010 and save your file as lesson5. In this lesson you will create tables and charts on separate
Microsoft Excel 2010 Training. Excel 2010 Basics
 Microsoft Excel 2010 Training Excel 2010 Basics Overview Excel is a spreadsheet, a grid made from columns and rows. It is a software program that can make number manipulation easy and somewhat painless.
Concatenate Function Page 505
 Concatenate Function Page 505 The Concatenate Function is used to tie together different text strings. It is useful, for example, if you have columns in your Excel workbook for First Name and Last Name
3/31/2016. Spreadsheets. Spreadsheets. Spreadsheets and Data Management. Unit 3. Can be used to automatically
 MICROSOFT EXCEL and Data Management Unit 3 Thursday March 31, 2016 Allow users to perform simple and complex sorting Allow users to perform calculations quickly Organizes and presents figures that can
Making Excel Work for Your Tribal Community
 Making Excel Work for Your Tribal Community Excel Basics: Intermediate Skills PHONE: 1-800-871-8702 EMAIL: INFO@CBC4TRIBES.ORG WEB: TRIBALINFORMATIONEXCHANGE.ORG MAKING EXCEL WORK FOR YOUR TRIBAL COMMUNITY
Data Visualisation with Google Fusion Tables
 Data Visualisation with Google Fusion Tables Workshop Exercises Dr Luc Small 12 April 2017 1.5 Data Visualisation with Google Fusion Tables Page 1 of 33 1 Introduction Google Fusion Tables is shaping up
BaSICS OF excel By: Steven 10.1
 BaSICS OF excel By: Steven 10.1 Workbook 1 workbook is made out of spreadsheet files. You can add it by going to (File > New Workbook). Cell Each & every rectangular box in a spreadsheet is referred as
Data Should Not be a Four Letter Word Microsoft Excel QUICK TOUR
 Toolbar Tour AutoSum + more functions Chart Wizard Currency, Percent, Comma Style Increase-Decrease Decimal Name Box Chart Wizard QUICK TOUR Name Box AutoSum Numeric Style Chart Wizard Formula Bar Active
Service Line Export and Pivot Table Report (Windows Excel 2010)
") Service Line Export and Pivot Table Report (Windows Excel 2010) In this tutorial, we will take the Service Lines of the Active Students only and only the most recent record to take a snapshot look at approximate
Service Line Export and Pivot Table Report (Windows Excel 2010) In this tutorial, we will take the Service Lines of the Active Students only and only the most recent record to take a snapshot look at approximate
Business Process Procedures
 Business Process Procedures 14.40 MICROSOFT EXCEL TIPS Overview These procedures document some helpful hints and tricks while using Microsoft Excel. Key Points This document will explore the following:
University of North Dakota PeopleSoft Finance Tip Sheets. Utilizing the Query Download Feature
 There is a custom feature available in Query Viewer that allows files to be created from queries and copied to a user s PC. This feature doesn t have the same size limitations as running a query to HTML
Introduction to Microsoft Excel 2007
 Introduction to Microsoft Excel 2007 Microsoft Excel is a very powerful tool for you to use for numeric computations and analysis. Excel can also function as a simple database but that is another class.
* George Washington University report: Counting for Dollars 2020: The Role of the Decennial Census in the Geographic Distribution of Federal Funds
 1 2 * George Washington University report: Counting for Dollars 2020: The Role of the Decennial Census in the Geographic Distribution of Federal Funds (https://gwipp.gwu.edu/counting dollars role decennial
Excel 2016: Part 2 Functions/Formulas/Charts
 Excel 2016: Part 2 Functions/Formulas/Charts Updated: March 2018 Copy cost: $1.30 Getting Started This class requires a basic understanding of Microsoft Excel skills. Please take our introductory class,
Power Query for Parsing Data
 Excel Power Query Power Query for Parsing Data Data Models Screen 1In Excel 2010 and 2013 need to install the Power Query; however, in 2016 is automatically part of the Data Tab ribbon and the commands
Procedure Instructions for Exporting Client list to Excel to create labels:
 Procedure Instructions for Exporting Client list to Excel to create labels: 1. Go to the Reports Module and under Client select Client List. 2. Fill in the information you want/need depending on the list
Excel Tips for Compensation Practitioners Month 1
 Excel Tips for Compensation Practitioners Month 1 Introduction This is the first of what will be a weekly column with Excel tips for Compensation Practitioners. These tips will cover functions in Excel
Chemistry 30 Tips for Creating Graphs using Microsoft Excel
 Chemistry 30 Tips for Creating Graphs using Microsoft Excel Graphing is an important skill to learn in the science classroom. Students should be encouraged to use spreadsheet programs to create graphs.
Candy is Dandy Project (Project #12)
") Candy is Dandy Project (Project #12) You have been hired to conduct some market research about M&M's. First, you had your team purchase 4 large bags and the results are given for the contents of those
Candy is Dandy Project (Project #12) You have been hired to conduct some market research about M&M's. First, you had your team purchase 4 large bags and the results are given for the contents of those
Excel 2010 Charts and Graphs
 Excel 2010 Charts and Graphs In older versions of Excel the chart engine looked tired and old. Little had changed in 15 years in charting. The popular chart wizard has been replaced in Excel 2010 by a
Chemistry 1A Graphing Tutorial CSUS Department of Chemistry
 Chemistry 1A Graphing Tutorial CSUS Department of Chemistry Please go to the Lab webpage to download your own copy for reference. 1 When you open Microsoft Excel 2003, you will see a blank worksheet: Enter
Analysing crime data in Maps for Office and ArcGIS Online
 Analysing crime data in Maps for Office and ArcGIS Online For non-commercial use only by schools and universities Esri UK GIS for School Programme www.esriuk.com/schools Introduction ArcGIS Online is a
Objective: Class Activities
 Objective: A Pivot Table is way to present information in a report format. The idea is that you can click drop down lists and change the data that is being displayed. Students will learn how to group data
DOING MORE WITH EXCEL: MICROSOFT OFFICE 2013
 DOING MORE WITH EXCEL: MICROSOFT OFFICE 2013 GETTING STARTED PAGE 02 Prerequisites What You Will Learn MORE TASKS IN MICROSOFT EXCEL PAGE 03 Cutting, Copying, and Pasting Data Basic Formulas Filling Data
Microsoft Excel Basics Ben Johnson
 Microsoft Excel Basics Ben Johnson Topic...page # Basics...1 Workbook and worksheets...1 Sizing columns and rows...2 Auto Fill...2 Sort...2 Formatting Cells...3 Formulas...3 Percentage Button...4 Sum function...4
M i c r o s o f t E x c e l A d v a n c e d P a r t 3-4. Microsoft Excel Advanced 3-4
 Microsoft Excel 2010 Advanced 3-4 0 Absolute references There may be times when you do not want a cell reference to change when copying or filling cells. You can use an absolute reference to keep a row
SUM - This says to add together cells F28 through F35. Notice that it will show your result is
 COUNTA - The COUNTA function will examine a set of cells and tell you how many cells are not empty. In this example, Excel analyzed 19 cells and found that only 18 were not empty. COUNTBLANK - The COUNTBLANK
DOING MORE WITH EXCEL: MICROSOFT OFFICE 2010
 DOING MORE WITH EXCEL: MICROSOFT OFFICE 2010 GETTING STARTED PAGE 02 Prerequisites What You Will Learn MORE TASKS IN MICROSOFT EXCEL PAGE 03 Cutting, Copying, and Pasting Data Filling Data Across Columns
Taking Attendance with a Spreadsheet
 Appendix A Taking Attendance with a Spreadsheet In this chapter, we will learn the following to World Class standards: Designing an Attendance Spreadsheet Opening Microsoft Excel Build the Spreadsheet
EXCELLING WITH ANALYSIS AND VISUALIZATION
 EXCELLING WITH ANALYSIS AND VISUALIZATION A PRACTICAL GUIDE FOR DEALING WITH DATA Prepared by Ann K. Emery July 2016 Ann K. Emery 1 Welcome Hello there! In July 2016, I led two workshops Excel Basics for
Safari ODBC on Microsoft 2010
 Safari ODBC on Microsoft 2010 Creating an Excel spreadsheet using Safari ODBC 1. Click Data/From Other Sources/From Microsoft Query 2. Select your data source and click OK 3. Enter your Reflections username
Tableau Advanced Training. Student Guide April x. For Evaluation Only
 Tableau Advanced Training Student Guide www.datarevelations.com 914.945.0567 April 2017 10.x Contents A. Warm Up 1 Bar Chart Colored by Profit 1 Salary Curve 2 2015 v s. 2014 Sales 3 VII. Programmatic
Intermediate Excel 2003
 Intermediate Excel 2003 Introduction The aim of this document is to introduce some techniques for manipulating data within Excel, including sorting, filtering and how to customise the charts you create.
1. Two types of sheets used in a workbook- chart sheets and worksheets
 Quick Check Answers Session 1.1 1. Two types of sheets used in a workbook- chart sheets and worksheets 2. Identify the active cell- The active cell is surrounded by a thick border and its cell reference
Patricia Andrada Quick Guide Excel 2010 Data Management-July 2011 Page 1
 Patricia Andrada Quick Guide Excel 2010 Data Management-July 2011 Page 1 Excel 2010 Data Management AutoFill and Custom Lists AutoFill 1. Select the range that contains the initial value(s) of the series
You will demonstrate two strategies commonly used to geocode data, and demonstrate an ability to gather address data from a typical state database.
 Steve Graves Forensic Geography Lab: Preparing Address Data for Geocoding Background One of the most commonly used tools for people using GIS is geocoding. Geocoding, also sometimes called address mapping,
Lastly, in case you don t already know this, and don t have Excel on your computers, you can get it for free through IT s website under software.
 Welcome to Basic Excel, presented by STEM Gateway as part of the Essential Academic Skills Enhancement, or EASE, workshop series. Before we begin, I want to make sure we are clear that this is by no means
Tricking it Out: Tricks to personalize and customize your graphs.
 Tricking it Out: Tricks to personalize and customize your graphs. Graphing templates may be used online without downloading them onto your own computer. However, if you would like to use the templates
MS Office 2016 Excel Pivot Tables - notes
 Introduction Why You Should Use a Pivot Table: Organize your data by aggregating the rows into interesting and useful views. Calculate and sum data quickly. Great for finding typos. Create a Pivot Table
Assignment 1 MIS Spreadsheet (Excel)
") Assignment 1 MIS Spreadsheet (Excel) Summary Create a Microsoft Excel file with six worksheets that provides extensive use of Excel capabilities including: importing data, formatting data in tables, summarizing
Assignment 1 MIS Spreadsheet (Excel) Summary Create a Microsoft Excel file with six worksheets that provides extensive use of Excel capabilities including: importing data, formatting data in tables, summarizing
Tutorial 5: Working with Excel Tables, PivotTables, and PivotCharts. Microsoft Excel 2013 Enhanced
 Tutorial 5: Working with Excel Tables, PivotTables, and PivotCharts Microsoft Excel 2013 Enhanced Objectives Explore a structured range of data Freeze rows and columns Plan and create an Excel table Rename
Applied Systems Client Network SEMINAR HANDOUT. Excel 2007: Level 2
 Applied Systems Client Network SEMINAR HANDOUT Excel 2007: Level 2 Prepared for ASCnet Applied Systems Client Network 801 Douglas Avenue #205 Altamonte Springs, FL 32714 Phone: 407-869-0404 Fax: 407-869-0418
Hands-On Lab. Developing BI Applications. Lab version: Last updated: 2/23/2011
 Hands-On Lab Developing BI Applications Lab version: 1.0.0 Last updated: 2/23/2011 CONTENTS OVERVIEW... 3 EXERCISE 1: USING THE CHART WEB PART... 4 Task 1 Add the Chart Web Part to the page... 4 Task 2
Final Graded Project. Advanced PC Applications
 Final Graded Project Advanced PC Applications INTRODUCTION 1 SCENARIO 1 YOUR TASK 2 PART 1: CREATING YOUR ACCESS DATABASE 2 PART 2: CREATING YOUR EXCEL WORKSHEETS 3 PART 3: CREATING YOUR POWERPOINT PRESENTATION
Excel 2013 Intermediate
 Instructor s Excel 2013 Tutorial 2 - Charts Excel 2013 Intermediate 103-124 Unit 2 - Charts Quick Links Chart Concepts Page EX197 EX199 EX200 Selecting Source Data Pages EX198 EX234 EX237 Creating a Chart
Quick Guide for Excel 2015 Data Management November 2015 Training:
 http://pfw.edu Quick Guide for Excel 2015 Data Management November 2015 Training: http://pfw.edu/training Excel 2016 Data Management AutoFill and Custom Lists AutoFill 1. Select the range that contains
Using Census Data to Calculate Social Inequality in Colombia
 Using Census Data to Calculate Social Inequality in Colombia Written by Carolyn Talmadge, February 8, 2017 What is Social Inequality?... 1 Accessing the Data... 2 Understanding the Metadata & Attribute
Spreadsheet definition: Starting a New Excel Worksheet: Navigating Through an Excel Worksheet
 Copyright 1 99 Spreadsheet definition: A spreadsheet stores and manipulates data that lends itself to being stored in a table type format (e.g. Accounts, Science Experiments, Mathematical Trends, Statistics,
MAKING MAPS WITH GOOGLE FUSION TABLES. (Data for this tutorial at
 MAKING MAPS WITH GOOGLE FUSION TABLES (Data for this tutorial at www.peteraldhous.com/data) Thanks to Google Fusion Tables, creating maps from data and embedding them on a web page is now easy. We re going
Spreadsheet Warm Up for SSAC Geology of National Parks Modules, 2: Elementary Spreadsheet Manipulations and Graphing Tasks
 University of South Florida Scholar Commons Tampa Library Faculty and Staff Publications Tampa Library 2009 Spreadsheet Warm Up for SSAC Geology of National Parks Modules, 2: Elementary Spreadsheet Manipulations
ADD AND NAME WORKSHEETS
 1 INTERMEDIATE EXCEL While its primary function is to be a number cruncher, Excel is a versatile program that is used in a variety of ways. Because it easily organizes, manages, and displays information,
HOUR 12. Adding a Chart
 HOUR 12 Adding a Chart The highlights of this hour are as follows: Reasons for using a chart The chart elements The chart types How to create charts with the Chart Wizard How to work with charts How to
Intermediate Excel Training Course Content
 Intermediate Excel Training Course Content Lesson Page 1 Absolute Cell Addressing 2 Using Absolute References 2 Naming Cells and Ranges 2 Using the Create Method to Name Cells 3 Data Consolidation 3 Consolidating
Excel Macros, Links and Other Good Stuff
 Excel Macros, Links and Other Good Stuff COPYRIGHT Copyright 2001 by EZ-REF Courseware, Laguna Beach, CA http://www.ezref.com/ All rights reserved. This publication, including the student manual, instructor's
Making Tables and Graphs with Excel. The Basics
 Making Tables and Graphs with Excel The Basics Where do my IV and DV go? Just like you would create a data table on paper, your IV goes in the leftmost column and your DV goes to the right of the IV Enter
Today Function. Note: If you want to retrieve the date and time that the computer is set to, use the =NOW() function.
 function.") Today Function The today function: =TODAY() It has no arguments, and returns the date that the computer is set to. It is volatile, so if you save it and reopen the file one month later the new, updated
Today Function The today function: =TODAY() It has no arguments, and returns the date that the computer is set to. It is volatile, so if you save it and reopen the file one month later the new, updated
3 Excel Tips for Marketing Efficiency
 3 Excel Tips for Marketing Efficiency 3 Excel Database Tips for Marketing Efficiency In these challenging times, companies continue to reduce staff to save money. Those who remain must do more. How to