Using ArcGIS for Landcover Classification. Presented by CORE GIS May 8, 2012
|
|
|
- Bruno Holmes
- 6 years ago
- Views:
Transcription


1 Using ArcGIS for Landcover Classification Presented by CORE GIS May 8, 2012
2 How to use ArcGIS for Image Classification 1. Find and download the right data 2. Have a look at the data (true color/false color) 3. Obtain temporally similar air photos 4. Run an unsupervised classification 5. Digitize training polygons 6. Create signature files 7. Run a supervised classification 8. Addressing class confusion 9. Assess your accuracy the error matrix 10. Lessons learned
3 Case Study Stillaguamish Watershed The task: Create a landcover classification using Landsat data so that it will be analytically compatible with the 1991 and 2001 landcover classifications produced by Simmonds et al and Purser et al
4 But first!
5 Find and download the right data, 1

6 Find and download the right data, 2
7 Find and download the right data, 3
8 Find and download the right data, 4

9 Murphy s Law of Maps Any geographic area of interest will lie on the boundary between two or more mapsheets
10 But what about Landsat 7? SLC-off will get you! On May 31, 2003 the Scan Line Corrector (SLC) in the ETM+ instrument failed. The SLC consists of a pair of small mirrors that rotate about an axis in tandem with the motion of the main ETM+ scan mirror. The purpose of the SLC is to compensate for the forward motion (along-track) of the spacecraft so that the resulting scans are aligned parallel to each other. Without the effects of the SLC, the instrument images the Earth in a "zig-zag" fashion, resulting in some areas that are imaged twice and others that are not imaged at all. The net effect is that approximately 22% of the data in a Landsat 7 scene is missing when acquired without a functional SLC.

11 SLC-off data is challenging to work with
12 Have a look at the data an overview What do you get when you download Landsat data? L _ _B10.TIF, L _ _B20.TIF, etc., through _B70 These correspond to the 7 bands, as follows: Band 1 = blue Band 2 = green Band 3 = red Band 4 = near IR Band 5 = shortwave IR Band 6 = thermal infrared Band 7 = shortwave IR (although, not quite as short as Band 5) To generate images, first convert TIFs to rasters, then use Spatial Analyst as follows: True color = MAKESTACK truecol LIST [p46r26_3] [p46r26_2] [p46r26_1] False color = MAKESTACK falsecol LIST [p46r26_4] [p46r26_3] [p46r26_2]

13 Have a look at the data true color
14 Have a look at the data false color
15 Obtain temporally similar airphotos For 2011 classification, it s easy! Just use USDA NRCS NAIP for 2011 For other classifications (particularly pre- 2000s), not so easy Earth Explorer has loads of freely available air photos, but most are not georeferenced, much less orthorectified We will use the air photos later, for supervised classification
16 Supervised vs Unsupervised Classifications Unsupervised: ArcGIS looks at spectral reflectance characteristics and assigns every pixel into a class. You tell the software how many classes to create, then you look at the result and try to figure out what each class represents. Supervised: You use your temporally similar airphotos to digitize a series of training polygons, then tell ArcGIS this polygon is water or this polygon is old growth forest etc., then the software finds all pixels that have similar spectral reflectance characteristics and assigns them to the appropriate class.

17 Run an unsupervised classification The Iso Cluster tool uses an isodata clustering algorithm to determine the characteristics of the natural groupings of cells in multidimensional attribute space and stores the results in an ouput ASCII signature file. SA will allegedly run an unsupervised classification. That would have been great, but I could not get it to work. Crash, crash, crash.


18 Digitize training polygons The more, the better! P46 R27 P46 R26


19 Digitize training polygons be conservative Ortho Landsat True Color Composite


20 Create signature files Use Create Signatures tool Input bands 1-5 and 7 (no thermal band) Use training polys as feature sample data Name signature file with.gsg extension

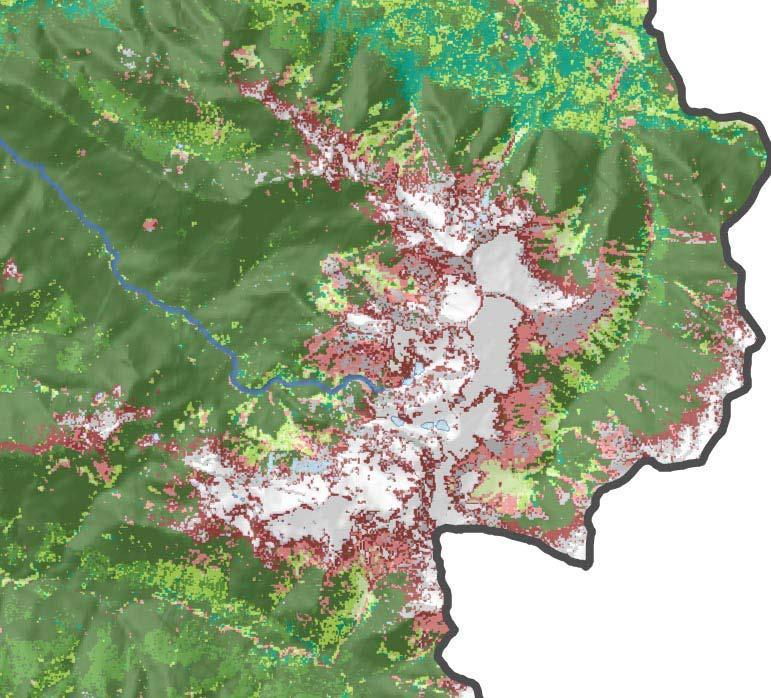
21 Addressing class confusion the problem
22 Addressing class confusion solutions More training polygons Use elevation and rules to re-assign uniformly wrong classes in specific areas For example: blw_200m_v2: elevations below 200m (part_01) abv_200m_v3: elevations between 200m and 599m (part_02) abv_600m_v2: elevations 600m+ (part_03) con(([part_03] == 7),4,[part_03])-->part_03_v2 This converts the incorrectly classified medium density in high elevation into grass (alpine meadows)

23 Addressing class confusion solutions
24 Assess your accuracy How to do it: Use a randomly selected collection of 10 5x5 pixel blocks of homogeneous land cover from each class Use Hawth s tools to generate a grid of 150m x 150m polygons (each Landsat pixel is 30m x 30m Convert each landcover class to polygon feature class Select grid polys that fall completely within polys of each landcover type Assign a random value to each of the grid polygons (e.g. arcgis.rand( Integer 1 10 ), where upper limit of random values is determined by dividing the total number of grid polys by 10, then randomly selecting 10 grid polygons Finally, take a look! Overlay selected polys on air photos Helps to have rules: in our case, 50%+ for a match


25 Assess your accuracy examples Mature Forest = Match! Landcover Ortho Medium Density Development = Error Landcover Ortho
26 Assess your accuracy the error matrix
27 Lessons learned It is possible to do landcover classification at acceptable levels of accuracy using ArcGIS It is difficult to run unsupervised classifications using ArcGIS SLC-off severely limits the usefulness of Landsat 7 ETM+ for novice to intermediate users I need to do more research into solving class confusion, particularly for the urban/rural/ag mix The more training polygons, the better!
28 More info Get data: Same idea in 10.x world: assifying-landsat-image-services-to-make-a-landcover-map/ Helpful descriptions of band combinations: s.html

29 Thank You Jason Griffith at Stillaguamish Tribe of Indians Luke Rogers for brainstorming and trouble-shooting
DIGITAL IMAGE ANALYSIS. Image Classification: Object-based Classification
 DIGITAL IMAGE ANALYSIS Image Classification: Object-based Classification Image classification Quantitative analysis used to automate the identification of features Spectral pattern recognition Unsupervised
Data: a collection of numbers or facts that require further processing before they are meaningful
 Digital Image Classification Data vs. Information Data: a collection of numbers or facts that require further processing before they are meaningful Information: Derived knowledge from raw data. Something
Classify Multi-Spectral Data Classify Geologic Terrains on Venus Apply Multi-Variate Statistics
 Classify Multi-Spectral Data Classify Geologic Terrains on Venus Apply Multi-Variate Statistics Operations What Do I Need? Classify Merge Combine Cross Scan Score Warp Respace Cover Subscene Rotate Translators
Lab 5: Image Analysis with ArcGIS 10 Unsupervised Classification
 Lab 5: Image Analysis with ArcGIS 10 Unsupervised Classification Peter E. Price TerraView 2010 Peter E. Price All rights reserved Revised 03/2011 Revised for Geob 373 by BK Feb 28, 2017. V3 The information
ArcGIS Pro: Image Segmentation, Classification, and Machine Learning. Jeff Liedtke and Han Hu
 ArcGIS Pro: Image Segmentation, Classification, and Machine Learning Jeff Liedtke and Han Hu Overview of Image Classification in ArcGIS Pro Overview of the classification workflow Classification tools
Lab #4 Introduction to Image Processing II and Map Accuracy Assessment
 FOR 324 Natural Resources Information Systems Lab #4 Introduction to Image Processing II and Map Accuracy Assessment (Adapted from the Idrisi Tutorial, Introduction Image Processing Exercises, Exercise
This is the general guide for landuse mapping using mid-resolution remote sensing data
 This is the general guide for landuse mapping using mid-resolution remote sensing data February 11 2015 This document has been prepared for Training workshop on REDD+ Research Project in Peninsular Malaysia
Spatial Density Distribution
 GeoCue Group Support Team 5/28/2015 Quality control and quality assurance checks for LIDAR data continue to evolve as the industry identifies new ways to help ensure that data collections meet desired
Raster Classification with ArcGIS Desktop. Rebecca Richman Andy Shoemaker
 Raster Classification with ArcGIS Desktop Rebecca Richman Andy Shoemaker Raster Classification What is it? - Classifying imagery into different land use/ land cover classes based on the pixel values of
An Introduction to Lidar & Forestry May 2013
 An Introduction to Lidar & Forestry May 2013 Introduction to Lidar & Forestry Lidar technology Derivatives from point clouds Applied to forestry Publish & Share Futures Lidar Light Detection And Ranging
Best Practices for Managing Processed Ortho Imagery
 Best Practices for Managing Processed Ortho Imagery Cody Benkelman DRAFT slides (June 2017) Characteristics of Processed Ortho Imagery Typically 8 bit (sometimes 16) Typically 3 spectral bands (sometimes
Lecture 06. Raster and Vector Data Models. Part (1) Common Data Models. Raster. Vector. Points. Points. ( x,y ) Area. Area Line.
 Common Data Models. Raster. Vector. Points. Points. ( x,y ) Area. Area Line.") Lecture 06 Raster and Vector Data Models Part (1) 1 Common Data Models Vector Raster Y Points Points ( x,y ) Line Area Line Area 2 X 1 3 Raster uses a grid cell structure Vector is more like a drawn map
Lecture 06 Raster and Vector Data Models Part (1) 1 Common Data Models Vector Raster Y Points Points ( x,y ) Line Area Line Area 2 X 1 3 Raster uses a grid cell structure Vector is more like a drawn map
Land Cover Classification Techniques
 Land Cover Classification Techniques supervised classification and random forests Developed by remote sensing specialists at the USFS Geospatial Technology and Applications Center (GTAC), located in Salt
Classifying. Stuart Green Earthobservation.wordpress.com MERMS 12 - L4
 Classifying Stuart Green Earthobservation.wordpress.com Stuart.Green@Teagasc.ie MERMS 12 - L4 Classifying Replacing the digital numbers in each pixel (that tell us the average spectral properties of everything
Integration of airborne LiDAR and hyperspectral remote sensing data to support the Vegetation Resources Inventory and sustainable forest management
 Integration of airborne LiDAR and hyperspectral remote sensing data to support the Vegetation Resources Inventory and sustainable forest management Executive Summary This project has addressed a number
Introduction to the Image Analyst Extension. Mike Muller, Vinay Viswambharan
 Introduction to the Image Analyst Extension Mike Muller, Vinay Viswambharan What is the Image Analyst Extension? The Image Analyst Extension (IA) is an application extension which extends ArcGIS Pro with
GEOBIA for ArcGIS (presentation) Jacek Urbanski
 Jacek Urbanski") GEOBIA for ArcGIS (presentation) Jacek Urbanski INTEGRATION OF GEOBIA WITH GIS FOR SEMI-AUTOMATIC LAND COVER MAPPING FROM LANDSAT 8 IMAGERY Presented at 5th GEOBIA conference 21 24 May in Thessaloniki.
GEOBIA for ArcGIS (presentation) Jacek Urbanski INTEGRATION OF GEOBIA WITH GIS FOR SEMI-AUTOMATIC LAND COVER MAPPING FROM LANDSAT 8 IMAGERY Presented at 5th GEOBIA conference 21 24 May in Thessaloniki.
General Digital Image Utilities in ERDAS
 General Digital Image Utilities in ERDAS These instructions show you how to use the basic utilities of stacking layers, converting vectors, and sub-setting or masking data for use in ERDAS Imagine 9.x
Lab 9. Julia Janicki. Introduction
 Lab 9 Julia Janicki Introduction My goal for this project is to map a general land cover in the area of Alexandria in Egypt using supervised classification, specifically the Maximum Likelihood and Support
BRIEF EXAMPLES OF PRACTICAL USES OF LIDAR
 BRIEF EXAMPLES OF PRACTICAL USES OF LIDAR PURDUE ROAD SCHOOL - 3/9/2016 CHRIS MORSE USDA-NRCS, STATE GIS COORDINATOR LIDAR/DEM SOURCE DATES LiDAR and its derivatives (DEMs) have a collection date for data
(Refer Slide Time: 0:51)
") Introduction to Remote Sensing Dr. Arun K Saraf Department of Earth Sciences Indian Institute of Technology Roorkee Lecture 16 Image Classification Techniques Hello everyone welcome to 16th lecture in
Introduction to Remote Sensing Dr. Arun K Saraf Department of Earth Sciences Indian Institute of Technology Roorkee Lecture 16 Image Classification Techniques Hello everyone welcome to 16th lecture in
The Gain setting for Landsat 7 (High or Low Gain) depends on: Sensor Calibration - Application. the surface cover types of the earth and the sun angle
 depends on: Sensor Calibration - Application. the surface cover types of the earth and the sun angle") Sensor Calibration - Application Station Identifier ASN Scene Center atitude 34.840 (34 3'0.64"N) Day Night DAY Scene Center ongitude 33.03270 (33 0'7.72"E) WRS Path WRS Row 76 036 Corner Upper eft atitude
Sensor Calibration - Application Station Identifier ASN Scene Center atitude 34.840 (34 3'0.64"N) Day Night DAY Scene Center ongitude 33.03270 (33 0'7.72"E) WRS Path WRS Row 76 036 Corner Upper eft atitude
Imagery and Raster Data in ArcGIS. Abhilash and Abhijit
 Imagery and Raster Data in ArcGIS Abhilash and Abhijit Agenda Imagery in ArcGIS Mosaic datasets Raster processing ArcGIS is a Comprehensive Imagery System Integrating All Types, Sources, and Sensor Models
Spectral Classification
 Spectral Classification Spectral Classification Supervised versus Unsupervised Classification n Unsupervised Classes are determined by the computer. Also referred to as clustering n Supervised Classes
GPS Located Accuracy Assessment Plots on the Modoc National Forest
 This file was created by scanning the printed publication. Errors identified by the software have been corrected; however, some errors may remain. GPS Located Accuracy Assessment Plots on the Modoc National
Attribute Accuracy. Quantitative accuracy refers to the level of bias in estimating the values assigned such as estimated values of ph in a soil map.
 Attribute Accuracy Objectives (Entry) This basic concept of attribute accuracy has been introduced in the unit of quality and coverage. This unit will teach a basic technique to quantify the attribute
Digital Image Classification Geography 4354 Remote Sensing
 Digital Image Classification Geography 4354 Remote Sensing Lab 11 Dr. James Campbell December 10, 2001 Group #4 Mark Dougherty Paul Bartholomew Akisha Williams Dave Trible Seth McCoy Table of Contents:
Notes: Notes: Notes: Notes:
 NR406 GIS Applications in Fire Ecology & Management Lesson 2 - Overlay Analysis in GIS Gathering Information from Multiple Data Layers One of the many strengths of a GIS is that you can stack several data
GIS in agriculture scale farm level - used in agricultural applications - managing crop yields, monitoring crop rotation techniques, and estimate
 Types of Input GIS in agriculture scale farm level - used in agricultural applications - managing crop yields, monitoring crop rotation techniques, and estimate soil loss from individual farms or agricultural
Classification (or thematic) accuracy assessment. Lecture 8 March 11, 2005
 accuracy assessment. Lecture 8 March 11, 2005") Classification (or thematic) accuracy assessment Lecture 8 March 11, 2005 Why and how Remote sensing-derived thematic information are becoming increasingly important. Unfortunately, they contain errors.
Classification (or thematic) accuracy assessment Lecture 8 March 11, 2005 Why and how Remote sensing-derived thematic information are becoming increasingly important. Unfortunately, they contain errors.
EAT 233/3 GEOGRAPHIC INFORMATION SYSTEM (GIS)
") EAT 233/3 GEOGRAPHIC INFORMATION SYSTEM (GIS) CO3: Ability to produce detail mapping using geographic information systems (GIS) BY : AYU WAZIRA AZHARI SPATIAL DATA & THE MODELLING Spatial Data in GIS Spatial
EAT 233/3 GEOGRAPHIC INFORMATION SYSTEM (GIS) CO3: Ability to produce detail mapping using geographic information systems (GIS) BY : AYU WAZIRA AZHARI SPATIAL DATA & THE MODELLING Spatial Data in GIS Spatial
Figure 1: Workflow of object-based classification
 Technical Specifications Object Analyst Object Analyst is an add-on package for Geomatica that provides tools for segmentation, classification, and feature extraction. Object Analyst includes an all-in-one
Aardobservatie en Data-analyse Image processing
 Aardobservatie en Data-analyse Image processing 1 Image processing: Processing of digital images aiming at: - image correction (geometry, dropped lines, etc) - image calibration: DN into radiance or into
Introduction to digital image classification
 Introduction to digital image classification Dr. Norman Kerle, Wan Bakx MSc a.o. INTERNATIONAL INSTITUTE FOR GEO-INFORMATION SCIENCE AND EARTH OBSERVATION Purpose of lecture Main lecture topics Review
Terms and definitions * keep definitions of processes and terms that may be useful for tests, assignments
 Lecture 1 Core of GIS Thematic layers Terms and definitions * keep definitions of processes and terms that may be useful for tests, assignments Lecture 2 What is GIS? Info: value added data Data to solve
Geographic Information Systems. using QGIS
 Geographic Information Systems using QGIS 1 - INTRODUCTION Generalities A GIS (Geographic Information System) consists of: -Computer hardware -Computer software - Digital Data Generalities GIS softwares
EVALUATION OF THE THEMATIC INFORMATION CONTENT OF THE ASTER-VNIR IMAGERY IN URBAN AREAS BY CLASSIFICATION TECHNIQUES
 EVALUATION OF THE THEMATIC INFORMATION CONTENT OF THE ASTER-VNIR IMAGERY IN URBAN AREAS BY CLASSIFICATION TECHNIQUES T. G. Panagou a *, G. Ch. Miliaresis a a TEI, Dpt. of Topography, 3 P.Drakou Str., Thiva,
Using Imagery for Intelligence Analysis
 2013 Esri International User Conference July 8 12, 2013 San Diego, California Technical Workshop Using Imagery for Intelligence Analysis Renee Bernstein Natalie Campos Esri UC2013. Technical Workshop.
EVALUATION OF CONVENTIONAL DIGITAL CAMERA SCENES FOR THEMATIC INFORMATION EXTRACTION ABSTRACT
 EVALUATION OF CONVENTIONAL DIGITAL CAMERA SCENES FOR THEMATIC INFORMATION EXTRACTION H. S. Lim, M. Z. MatJafri and K. Abdullah School of Physics Universiti Sains Malaysia, 11800 Penang ABSTRACT A study
Managing Imagery And Raster Data Using Mosaic Dataset. Peter Becker & Cody Benkelman
 Managing Imagery And Raster Data Using Mosaic Dataset Peter Becker & Cody Benkelman ArcGIS is a Comprehensive Imagery Platform Imagery is integral to the ArcGIS Platform System of Engagement System of
Defining Remote Sensing
 Defining Remote Sensing Remote Sensing is a technology for sampling electromagnetic radiation to acquire and interpret non-immediate geospatial data from which to extract information about features, objects,
APPLICATION OF SOFTMAX REGRESSION AND ITS VALIDATION FOR SPECTRAL-BASED LAND COVER MAPPING
 APPLICATION OF SOFTMAX REGRESSION AND ITS VALIDATION FOR SPECTRAL-BASED LAND COVER MAPPING J. Wolfe a, X. Jin a, T. Bahr b, N. Holzer b, * a Harris Corporation, Broomfield, Colorado, U.S.A. (jwolfe05,
LECTURE 2 SPATIAL DATA MODELS
 LECTURE 2 SPATIAL DATA MODELS Computers and GIS cannot directly be applied to the real world: a data gathering step comes first. Digital computers operate in numbers and characters held internally as binary
Glacier Mapping and Monitoring
 Glacier Mapping and Monitoring Exercises Tobias Bolch Universität Zürich TU Dresden tobias.bolch@geo.uzh.ch Exercise 1: Visualizing multi-spectral images with Erdas Imagine 2011 a) View raster data: Open
RASTER ANALYSIS S H A W N L. P E N M A N E A R T H D A T A A N A LY S I S C E N T E R U N I V E R S I T Y O F N E W M E X I C O
 RASTER ANALYSIS S H A W N L. P E N M A N E A R T H D A T A A N A LY S I S C E N T E R U N I V E R S I T Y O F N E W M E X I C O TOPICS COVERED Spatial Analyst basics Raster / Vector conversion Raster data
ii. From the Tools menu choose Multi-Extract
 Created By: Grant J. Firl Advisors: Paul Evangelista, Jim Graham Date: November 2010 Software: ArcGIS v9.2, TUGZip v3.5 Lesson 8: Mosaicking and Clipping Landsat Data The purpose of this tutorial is to
Geomatica II Course guide
 Course guide Geomatica Version 2017 SP4 2017 PCI Geomatics Enterprises, Inc. All rights reserved. COPYRIGHT NOTICE Software copyrighted by PCI Geomatics Enterprises, Inc., 90 Allstate Parkway, Suite 501
Image Classification. Introduction to Photogrammetry and Remote Sensing (SGHG 1473) Dr. Muhammad Zulkarnain Abdul Rahman
 Dr. Muhammad Zulkarnain Abdul Rahman") Image Classification Introduction to Photogrammetry and Remote Sensing (SGHG 1473) Dr. Muhammad Zulkarnain Abdul Rahman Classification Multispectral classification may be performed using a variety of methods,
Image Classification Introduction to Photogrammetry and Remote Sensing (SGHG 1473) Dr. Muhammad Zulkarnain Abdul Rahman Classification Multispectral classification may be performed using a variety of methods,
Image Classification. RS Image Classification. Present by: Dr.Weerakaset Suanpaga
 Image Classification Present by: Dr.Weerakaset Suanpaga D.Eng(RS&GIS) 6.1 Concept of Classification Objectives of Classification Advantages of Multi-Spectral data for Classification Variation of Multi-Spectra
Lesson 3: Introduction to Using QGIS
 Agricultural Nutrient Management Program Department of Environmental Science and Technology 0116 Symons Hall 7998 Regents Dr. College Park, MD 20742 TEL 301-405-1319 FAX 301-314-7375 www.extension.umd.edu/anmp
Geomatics 89 (National Conference & Exhibition) May 2010
 May 2010") Evaluation of the Pixel Based and Object Based Classification Methods For Monitoring Of Agricultural Land Cover Case study: Biddinghuizen - The Netherlands Hossein Vahidi MSc Student of Geoinformatics
Evaluation of the Pixel Based and Object Based Classification Methods For Monitoring Of Agricultural Land Cover Case study: Biddinghuizen - The Netherlands Hossein Vahidi MSc Student of Geoinformatics
APPENDIX E2. Vernal Pool Watershed Mapping
 APPENDIX E2 Vernal Pool Watershed Mapping MEMORANDUM To: U.S. Fish and Wildlife Service From: Tyler Friesen, Dudek Subject: SSHCP Vernal Pool Watershed Analysis Using LIDAR Data Date: February 6, 2014
Remote Sensing Introduction to the course
 Remote Sensing Introduction to the course Remote Sensing (Prof. L. Biagi) Exploitation of remotely assessed data for information retrieval Data: Digital images of the Earth, obtained by sensors recording
A Vector Agent-Based Unsupervised Image Classification for High Spatial Resolution Satellite Imagery
 A Vector Agent-Based Unsupervised Image Classification for High Spatial Resolution Satellite Imagery K. Borna 1, A. B. Moore 2, P. Sirguey 3 School of Surveying University of Otago PO Box 56, Dunedin,
Geometric Rectification of Remote Sensing Images
 Geometric Rectification of Remote Sensing Images Airborne TerrestriaL Applications Sensor (ATLAS) Nine flight paths were recorded over the city of Providence. 1 True color ATLAS image (bands 4, 2, 1 in
Spatial Data Models. Raster uses individual cells in a matrix, or grid, format to represent real world entities
 Spatial Data Models Raster uses individual cells in a matrix, or grid, format to represent real world entities Vector uses coordinates to store the shape of spatial data objects David Tenenbaum GEOG 7
ENGRG Introduction to GIS
 ENGRG 59910 Introduction to GIS Michael Piasecki April 3, 2014 Lecture 11: Raster Analysis GIS Related? 4/3/2014 ENGRG 59910 Intro to GIS 2 1 Why we use Raster GIS In our previous discussion of data models,
INCREASING CLASSIFICATION QUALITY BY USING FUZZY LOGIC
 JOURNAL OF APPLIED ENGINEERING SCIENCES VOL. 1(14), issue 4_2011 ISSN 2247-3769 ISSN-L 2247-3769 (Print) / e-issn:2284-7197 INCREASING CLASSIFICATION QUALITY BY USING FUZZY LOGIC DROJ Gabriela, University
Spatial data and QGIS
 Spatial data and QGIS Xue Jingbo IT Center 2017.08.07 A GIS consists of: Spatial Data. Computer Hardware. Computer Software. Longitude Latitude Disease Date 26.870436-31.909519 Mumps 13/12/2008 26.868682-31.909259
GISCI GEOSPATIAL CORE TECHNICAL KNOWLEDGE EXAM CANDIDATE MANUAL AUGUST 2017
 GISCI GEOSPATIAL CORE TECHNICAL KNOWLEDGE EXAM CANDIDATE MANUAL AUGUST 2017 This document provides information about the GISCI Geospatial Core Technical Knowledge Exam, now a requirement for GISCI GISP
Lesson 2 Installing and Using Quantum GIS (QGIS)
") Lesson 2 Installing and Using Quantum GIS (QGIS) Use file Explorer to open County QGIS portable hard drive provided. The program execute (.exe) will be at the bottom of the list. Double click on the file.
Lesson 2 Installing and Using Quantum GIS (QGIS) Use file Explorer to open County QGIS portable hard drive provided. The program execute (.exe) will be at the bottom of the list. Double click on the file.
Raster GIS applications
 Raster GIS applications Columns Rows Image: cell value = amount of reflection from surface DEM: cell value = elevation (also slope/aspect/hillshade/curvature) Thematic layer: cell value = category or measured
GIS-Generated Street Tree Inventory Pilot Study
 GIS-Generated Street Tree Inventory Pilot Study Prepared for: MSGIC Meeting Prepared by: Beth Schrayshuen, PE Marla Johnson, GISP 21 July 2017 Agenda 2 Purpose of Street Tree Inventory Pilot Study Evaluation
Longley Chapter 3. Representations
 Longley Chapter 3 Digital Geographic Data Representation Geographic Data Type Data Models Representing Spatial and Temporal Data Attributes The Nature of Geographic Data Representations Are needed to convey
How to georeference images in ArcMap (Arcinfo, ArcReader, ArcView)
") How to georeference images in ArcMap (Arcinfo, ArcReader, ArcView) This procedure outlines the steps required to georeference any image, including air photos or raster copies of scanned paper maps. In
How to georeference images in ArcMap (Arcinfo, ArcReader, ArcView) This procedure outlines the steps required to georeference any image, including air photos or raster copies of scanned paper maps. In
L7 Raster Algorithms
 L7 Raster Algorithms NGEN6(TEK23) Algorithms in Geographical Information Systems by: Abdulghani Hasan, updated Nov 216 by Per-Ola Olsson Background Store and analyze the geographic information: Raster
TOPOGRAPHIC NORMALIZATION INTRODUCTION
 TOPOGRAPHIC NORMALIZATION INTRODUCTION Use of remotely sensed data from mountainous regions generally requires additional preprocessing, including corrections for relief displacement and solar illumination
Understanding Geospatial Data Models
 Understanding Geospatial Data Models 1 A geospatial data model is a formal means of representing spatially referenced information. It is a simplified view of physical entities and a conceptualization of
Alaska Department of Transportation Roads to Resources Project LiDAR & Imagery Quality Assurance Report Juneau Access South Corridor
 Alaska Department of Transportation Roads to Resources Project LiDAR & Imagery Quality Assurance Report Juneau Access South Corridor Written by Rick Guritz Alaska Satellite Facility Nov. 24, 2015 Contents
Spatial Analysis (Vector) II
 II") Spatial Analysis (Vector) II GEOG 300, Lecture 9 Dr. Anthony Jjumba 1 A Spatial Network is a set of geographic locations interconnected in a system by a number of routes is a system of linear features
Spatial Analysis (Vector) II GEOG 300, Lecture 9 Dr. Anthony Jjumba 1 A Spatial Network is a set of geographic locations interconnected in a system by a number of routes is a system of linear features
INTRODUCTION TO GIS WORKSHOP EXERCISE
 111 Mulford Hall, College of Natural Resources, UC Berkeley (510) 643-4539 INTRODUCTION TO GIS WORKSHOP EXERCISE This exercise is a survey of some GIS and spatial analysis tools for ecological and natural
About the Land Image Analyst project Land Image Analyst was developed by GDA Corp for the USDA Forest Service Chesapeake Bay Program as a land cover
 About the Land Image Analyst project Land Image Analyst was developed by GDA Corp for the USDA Forest Service Chesapeake Bay Program as a land cover recognition tool to aid communities in developing land
ENVI. Get the Information You Need from Imagery.
 Visual Information Solutions ENVI. Get the Information You Need from Imagery. ENVI is the premier software solution to quickly, easily, and accurately extract information from geospatial imagery. Easy
Introduction to ERDAS IMAGINE. (adapted/modified from Jensen 2004)
") Introduction to ERDAS IMAGINE General Instructions (adapted/modified from Jensen 2004) Follow the directions given to you in class to login the system. If you haven t done this yet, create a folder and
Introduction to ERDAS IMAGINE General Instructions (adapted/modified from Jensen 2004) Follow the directions given to you in class to login the system. If you haven t done this yet, create a folder and
Drone2Map for ArcGIS: Bring Drone Imagery into ArcGIS
 Drone2Map for ArcGIS: Bring Drone Imagery into ArcGIS Mike Sweeney 1 Drone2Map for ArcGIS Turn Drones into Enterprise Productivity Tools ArcGIS Drone2Map for ArcGIS Create 2D and 3D products from raw drone
Raster GIS applications Columns
 Raster GIS applications Columns Rows Image: cell value = amount of reflection from surface Thematic layer: cell value = category or measured value - In both cases, there is only one value per cell (in
HYPERSPECTRAL REMOTE SENSING
 HYPERSPECTRAL REMOTE SENSING By Samuel Rosario Overview The Electromagnetic Spectrum Radiation Types MSI vs HIS Sensors Applications Image Analysis Software Feature Extraction Information Extraction 1
Leica - Airborne Digital Sensors (ADS80, ALS60) Update / News in the context of Remote Sensing applications
 Update / News in the context of Remote Sensing applications") Luzern, Switzerland, acquired with GSD=5 cm, 2008. Leica - Airborne Digital Sensors (ADS80, ALS60) Update / News in the context of Remote Sensing applications Arthur Rohrbach, Sensor Sales Dir Europe,
Luzern, Switzerland, acquired with GSD=5 cm, 2008. Leica - Airborne Digital Sensors (ADS80, ALS60) Update / News in the context of Remote Sensing applications Arthur Rohrbach, Sensor Sales Dir Europe,
Technical Specifications
 1 Contents INTRODUCTION...3 ABOUT THIS LAB...3 IMPORTANCE OF THIS MODULE...3 EXPORTING AND IMPORTING DATA...4 VIEWING PROJECTION INFORMATION...5...6 Assigning Projection...6 Reprojecting Data...7 CLIPPING/SUBSETTING...7
Image Management and Dissemination. Peter Becker
 Image Management and Dissemination Peter Becker OUTLINE Requirements Intro to Mosaic Datasets Workflows & Demo Dynamic Mosaicking, On-the-fly processing Properties Differentiator Raster Catalog, ISDef,
Producing Ortho Imagery In ArcGIS. Hong Xu, Mingzhen Chen, Ringu Nalankal
 Producing Ortho Imagery In ArcGIS Hong Xu, Mingzhen Chen, Ringu Nalankal Agenda Ortho imagery in GIS ArcGIS ortho mapping solution Workflows - Satellite imagery - Digital aerial imagery - Scanned imagery
Geodatabase over Taita Hills, Kenya
 Geodatabase over Taita Hills, Kenya Anna Broberg & Antero Keskinen Abstract This article introduces the basics of geographical information systems (GIS) and explains how the Taita Hills project can benefit
What s New in Imagery in ArcGIS. Presented by: Christopher Patterson Date: September 12, 2017
 What s New in Imagery in ArcGIS Presented by: Christopher Patterson Date: September 12, 2017 Agenda Ortho Mapping Elevation extraction Drone2Map Raster Analytics ArcGIS is a Comprehensive Imagery System
Introducing ArcScan for ArcGIS
 Introducing ArcScan for ArcGIS An ESRI White Paper August 2003 ESRI 380 New York St., Redlands, CA 92373-8100, USA TEL 909-793-2853 FAX 909-793-5953 E-MAIL info@esri.com WEB www.esri.com Copyright 2003
What s New in Imagery in ArcGIS. Presented by: Christopher Patterson Date: October 18, 2017
 What s New in Imagery in ArcGIS Presented by: Christopher Patterson Date: October 18, 2017 Imagery in ArcGIS Advancing 2010 Stretch, Extract Bands Clip, Mask Reproject, Orthorectify, Pan Sharpen Vegetation
Exelis Visual Information Software Solutions for TERRAIN ANALYSIS. Defense & Intelligence SOLUTIONS GUIDE.
 Exelis Visual Information for TERRAIN ANALYSIS Defense & Intelligence SOLUTIONS GUIDE www.exelisvis.com MISSION SUCCESS The U.S. Armed Forces has long acknowledged the connection between battlefield terrain
Uttam Kumar and Ramachandra T.V. Energy & Wetlands Research Group, Centre for Ecological Sciences, Indian Institute of Science, Bangalore
 Remote Sensing and GIS for Monitoring Urban Dynamics Uttam Kumar and Ramachandra T.V. Energy & Wetlands Research Group, Centre for Ecological Sciences, Indian Institute of Science, Bangalore 560 012. Remote
Graphic Display of Vector Object
 What is GIS? GIS stands for Geographic Information Systems, although the term Geographic Information Science is gaining popularity. A GIS is a software platform for storing, organizing, viewing, querying,
Computer Graphics. Lecture 9 Environment mapping, Mirroring
 Computer Graphics Lecture 9 Environment mapping, Mirroring Today Environment Mapping Introduction Cubic mapping Sphere mapping refractive mapping Mirroring Introduction reflection first stencil buffer
Lecture 20 - Chapter 8 (Raster Analysis, part1)
") GEOL 452/552 - GIS for Geoscientists I Lecture 20 - Chapter 8 (Raster Analysis, part) 4 lectures on rasters - but won t cover everything (Raster GIS course: Geol 588: GIS II (Spring 20) Today: Raster data,
GEOL 452/552 - GIS for Geoscientists I Lecture 20 - Chapter 8 (Raster Analysis, part) 4 lectures on rasters - but won t cover everything (Raster GIS course: Geol 588: GIS II (Spring 20) Today: Raster data,
Remote Sensing & Photogrammetry W4. Beata Hejmanowska Building C4, room 212, phone:
 Remote Sensing & Photogrammetry W4 Beata Hejmanowska Building C4, room 212, phone: +4812 617 22 72 605 061 510 galia@agh.edu.pl 1 General procedures in image classification Conventional multispectral classification
Introduction to Remote Sensing
 Introduction to Remote Sensing Spatial, spectral, temporal resolutions Image display alternatives Vegetation Indices Image classifications Image change detections Accuracy assessment Satellites & Air-Photos
The Raster Data Model
 The Raster Data Model 2 2 2 2 8 8 2 2 8 8 2 2 2 2 2 2 8 8 2 2 2 2 2 2 2 2 2 Llano River, Mason Co., TX 1 Rasters are: Regular square tessellations Matrices of values distributed among equal-sized, square
The Reference Library Generating Low Confidence Polygons
 GeoCue Support Team In the new ASPRS Positional Accuracy Standards for Digital Geospatial Data, low confidence areas within LIDAR data are defined to be where the bare earth model might not meet the overall
Raster Data Models 9/18/2018
 Raster Data Models The Raster Data Model Rasters are: Regular square tessellations Matrices of values distributed among equal-sized, square cells 5 5 5 5 5 5 5 5 2 2 5 5 5 5 5 5 2 2 2 2 5 5 5 5 5 2 2 2
Multiple-Choice Questionnaire Group C
 Family name: Vision and Machine-Learning Given name: 1/28/2011 Multiple-Choice naire Group C No documents authorized. There can be several right answers to a question. Marking-scheme: 2 points if all right
IMAGINE Objective. The Future of Feature Extraction, Update & Change Mapping
 IMAGINE ive The Future of Feature Extraction, Update & Change Mapping IMAGINE ive provides object based multi-scale image classification and feature extraction capabilities to reliably build and maintain
Bharath Setturu Research scholar, EWRG, Center for Ecological Sciences, IISc, Bangalore & IIIT-HYDERABAD
 Bharath Setturu Research scholar, EWRG, Center for Ecological Sciences, IISc, Bangalore settur@ces.iisc.ernet.in & IIIT-HYDERABAD Introduction to QGIS oquantum GIS (QGIS) is a GIS tool for managing geographical
GEOGRAPHIC INFORMATION SYSTEMS Lecture 24: Spatial Analyst Continued
 GEOGRAPHIC INFORMATION SYSTEMS Lecture 24: Spatial Analyst Continued Spatial Analyst - Spatial Analyst is an ArcGIS extension designed to work with raster data - in lecture I went through a series of demonstrations
Aerial photography: Principles. Visual interpretation of aerial imagery
 Aerial photography: Principles Visual interpretation of aerial imagery Overview Introduction Benefits of aerial imagery Image interpretation Elements Tasks Strategies Keys Accuracy assessment Benefits