Spatial Analysis (Vector) II
|
|
|
- Earl Singleton
- 5 years ago
- Views:
Transcription


1 Spatial Analysis (Vector) II GEOG 300, Lecture 9 Dr. Anthony Jjumba 1 A Spatial Network is a set of geographic locations interconnected in a system by a number of routes is a system of linear features that has appropriate attribute for the flow of objects A spatial network may be reduced to a topological graph. A connectivity matrix represents the interconnections between the nodes and edges 2 1
2 Spatial Network A network is topology-based Lines meet at intersections Lines cannot have gaps Lines have directions 3 V1 r4 V3 e1 e3 e4 r5 V2 r2 e8 V4 e2 e9 r3 V7 r1 V6 e5 e7 e6 V5 Topological Graph 4 2
3 Vertices(v) Regions(r) Edges(e) = Not connected; 1 = Connected Connectivity Matrices 5 A GIS can find the shortest route between two nodes on a network A user can control the route by selecting specific nodes the route must pass through Attributes of the edges represent impedance Impendence is the amount of resistance (or cost) when traversing along the network Examples of Impedance Length of the edge (distance or travel time) Turn Impedance A turn is a transition from one edge to another Turn impedance is directional 6 3
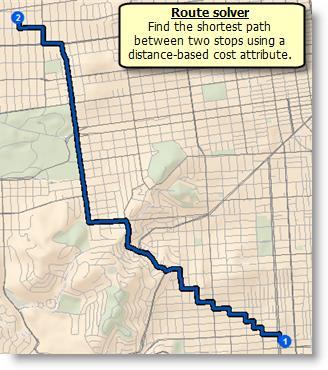
4 In ArcGIS network analysis, there are four types of operations that can be performed using route finding algorithms Finding a shortest route between point locations Determining the service area for a facility Finding the closest facility across the network Creating an origin destination matrix 7 Shortest route Starts with impendence matrix Shortest route may be represented by distance or travel time Commonly uses the Dijkstra algorithm Problems Traveling salesman problem Visits each stop, can start anywhere, must return to origin Vehicle routing problem Given a fleet of vehicles and customers, minimise travel time for each vehicle 8 4


5 Source: ESRI 9 Source: ESRI 10 5
. E.g.")
6 A service area for a facility A region that encompasses all accessible locations with a specified impedance (isochrones). E.g. 5min service area 11 Source: ESRI Location-allocation find the shortest path from the facility to demand points on the network allocating demand points to their nearest facility Some ESRI application examples: Given a set of existing fire stations, which site for a new fire station would provide the best response times for the community? If a retail company has to downsize, which stores should it close to maintain the most overall demand? Where should a factory be built to minimize the distance to distribution centers? 12 6


7 Source: ESRI 13 The closest facility for a location find the shortest path from the location to each possible (candidate) facility choose the shortest of these solutions. 14 Source: ESRI 7

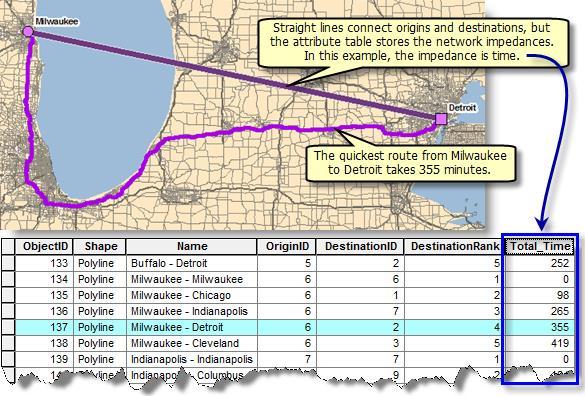
8 An origin destination matrix is table of shortest paths between all origins and destinations Source: ESRI 15 An origin destination matrix is table of shortest paths between all origins and destinations Source: ESRI 16 8
9 Utility Networks Referred to as Geometric Networks in ArcGIS Examples: water distribution, electrical lines, gas pipelines, telephone services, and water flow in a stream Junctions can act as sources or sinks and determine flow direction in a network Flow is away from sources Flow is toward sinks 17 Utility Networks A common type of analysis in geometric networks is network tracing. involves placing a marker on the network and tracing either upstream, or downstream, or both. 18 9
10 Point Pattern Analysis Point pattern analysis: the examination or evaluation of the pattern of distribution (spatial arrangement) for set of points. gispopsci.org 19 Point Pattern Analysis Can you tell which is one Random, Clustered or Uniformly (dispersed) distributed? 20 10

11 Point Pattern Analysis Nearest Neighbor Analysis A method used to determine whether a distribution is clustered, random or regular. ESRI To assess the spacing of points, the average nearest neighbor distance is determined. 21 Point Pattern Analysis Nearest Neighbor Analysis d1 = l12 d2 = l21 d3 = l32 4 r d4 = l42 obs n d i The Average Nearest neighbor distance = robs 22 11
12 Point Pattern Analysis Nearest Neighbor Analysis The nearest neighbor statistic is determined as a ratio of robs to rexp, the expected average nearest neighbor distance for a random distribution r 2 1 exp Where : n A A is area of study region n is number of points R r obs r exp 23 Point Pattern Analysis Nearest Neighbor Analysis Average distance from each point to its nearest neighbor, R 0 = clustered, 1 = random, 2.15 = even 12


13 Point Pattern Analysis Nearest-Neighbor Analysis in ArcGIS Tool: Average Nearest Neighbor Select a points layer Check Generate Report Hit OK Results are In: Nearest Neighbor Comparison of actual vs. random distances Clustered Significant Why? 13


14 Nearest Neighbor with Defined Area 800,000 hectares affected by budworm Vs. ~4,000,000ha minimum enclosing rectangle Set the study area size at 800,000ha Constrained Results are In Dispersed distribution Significant (statistically) 14
15 Density Analysis (Estimation) Density Analysis: The estimation of the variation of the density across a study area. measurements per area show where point or line features are concentrated Point or line data to raster surface E.g. Point value for each town representing the total number of people in the town, by calculating density, you can create a surface showing the predicted distribution of the population throughout the landscape. 29 Density Analysis Three density tools in Spatial Analyst All density tools produce new raster datasets Line density Point density Simple density estimation: the number of points or lines that fall within the search area are summed, then divided by the search area size to get each cell's density value The values in attribute field (e.g. population) that fall within the identified neighborhood are divided by the area of the neighborhood


16 Density Analysis Kernel density quadratic function; enter of the surface is the point location and tapering to zero at the search radius distance 31 Population density surface example SOURCE: ESRI 32 16

17 Point Density Estimation Line Density Estimation Kernel Density Estimation SOURCE: ESRI 33 Spatial Interpolation Interpolation: Predicts values at unsampled locations using a set of sampled data points within the study area Phenomenon: continuous field Methods of interpolation assume that the values measured at nearby sample points are more similar than the values measured at distant sample points(tobler s First Law) Point data to raster surface 34 17
18 Spatial Interpolation In estimating rainfall, temperature, and other attributes at places that are not weather stations, and where no direct measurements of these variables are available. In estimating the elevation of the surface between the measured locations of a digital elevation model (DEM) Methods: Thiessen Polygons, Inverse Distance Weighting, TIN, Thin plate splines, Kriging 35 18
Copyright The McGraw-Hill Companies, Inc. Permission required for reproduction or display.
 Chapter 17. PATH ANALYSIS AND NETWORK APPLICATIONS 17.1 Path Analysis 17.1.1 Source Raster 17.1.2 Cost Raster Box 17.1 Cost Raster for a Site Analysis of Pipelines 17.1.3 Cost Distance Measures 17.1.4
Watershed Sciences 4930 & 6920 GEOGRAPHIC INFORMATION SYSTEMS
 HOUSEKEEPING Watershed Sciences 4930 & 6920 GEOGRAPHIC INFORMATION SYSTEMS Quizzes Lab 8? WEEK EIGHT Lecture INTERPOLATION & SPATIAL ESTIMATION Joe Wheaton READING FOR TODAY WHAT CAN WE COLLECT AT POINTS?
Lecture 6: GIS Spatial Analysis. GE 118: INTRODUCTION TO GIS Engr. Meriam M. Santillan Caraga State University
 Lecture 6: GIS Spatial Analysis GE 118: INTRODUCTION TO GIS Engr. Meriam M. Santillan Caraga State University 1 Spatial Data It can be most simply defined as information that describes the distribution
Dijkstra's Algorithm
 Shortest Path Algorithm Dijkstra's Algorithm To find the shortest path from the origin node to the destination node No matrix calculation Floyd s Algorithm To find all the shortest paths from the nodes
Lesson 5 overview. Concepts. Interpolators. Assessing accuracy Exercise 5
 Interpolation Tools Lesson 5 overview Concepts Sampling methods Creating continuous surfaces Interpolation Density surfaces in GIS Interpolators IDW, Spline,Trend, Kriging,Natural neighbors TopoToRaster
Networks in GIS. Geometric Network. Network Dataset. Utilities and rivers One-way flow. Traffic data 2-way flow Multi-modal data
 Unit 6: Networks Networks in GIS Model the flow of resources Consist of a set of connected centers or junctions (ArcGIS) displayed as points. Junctions are connected by links, or edges (ArcGIS) displayed
Geol 588. GIS for Geoscientists II. Zonal functions. Feb 22, Zonal statistics. Interpolation. Zonal statistics Sp. Analyst Tools - Zonal.
 Zonal functions Geol 588 GIS for Geoscientists II Feb 22, 2011 Zonal statistics Interpolation Zonal statistics Sp. Analyst Tools - Zonal Choose correct attribute for zones (usually: must be unique ID for
Creating Surfaces. Steve Kopp Steve Lynch
 Steve Kopp Steve Lynch Overview Learn the types of surfaces and the data structures used to store them Emphasis on surface interpolation Learn the interpolation workflow Understand how interpolators work
Geographic Information Systems (GIS) Spatial Analyst [10] Dr. Mohammad N. Almasri. [10] Spring 2018 GIS Dr. Mohammad N. Almasri Spatial Analyst
![Geographic Information Systems (GIS) Spatial Analyst [10] Dr. Mohammad N. Almasri. [10] Spring 2018 GIS Dr. Mohammad N. Almasri Spatial Analyst](/thumbs/80/81171101.jpg "Geographic Information Systems (GIS) Spatial Analyst [10] Dr. Mohammad N. Almasri. [10] Spring 2018 GIS Dr. Mohammad N. Almasri Spatial Analyst") Geographic Information Systems (GIS) Spatial Analyst [10] Dr. Mohammad N. Almasri 1 Preface POINTS, LINES, and POLYGONS are good at representing geographic objects with distinct shapes They are less good
Geographic Information Systems (GIS) Spatial Analyst [10] Dr. Mohammad N. Almasri 1 Preface POINTS, LINES, and POLYGONS are good at representing geographic objects with distinct shapes They are less good
Mapping Distance and Density
 Mapping Distance and Density Distance functions allow you to determine the nearest location of something or the least-cost path to a particular destination. Density functions, on the other hand, allow
Getting Started with Spatial Analyst. Steve Kopp Elizabeth Graham
 Getting Started with Spatial Analyst Steve Kopp Elizabeth Graham Spatial Analyst Overview Over 100 geoprocessing tools plus raster functions Raster and vector analysis Construct workflows with ModelBuilder,
Spatial Interpolation & Geostatistics
 (Z i Z j ) 2 / 2 Spatial Interpolation & Geostatistics Lag Lag Mean Distance between pairs of points 1 Tobler s Law All places are related, but nearby places are related more than distant places Corollary:
Spatial Interpolation - Geostatistics 4/3/2018
 Spatial Interpolation - Geostatistics 4/3/201 (Z i Z j ) 2 / 2 Spatial Interpolation & Geostatistics Lag Distance between pairs of points Lag Mean Tobler s Law All places are related, but nearby places
Getting Started with Spatial Analyst. Steve Kopp Elizabeth Graham
 Getting Started with Spatial Analyst Steve Kopp Elizabeth Graham Workshop Overview Fundamentals of using Spatial Analyst What analysis capabilities exist and where to find them How to build a simple site
Esri International User Conference. San Diego, California. Technical Workshops. July Creating Surfaces. Steve Kopp and Steve Lynch
 Esri International User Conference San Diego, California Technical Workshops July 2011 Creating Surfaces Steve Kopp and Steve Lynch Overview Learn the types of surfaces and the data structures used to
GEOGRAPHIC INFORMATION SYSTEMS Lecture 24: Spatial Analyst Continued
 GEOGRAPHIC INFORMATION SYSTEMS Lecture 24: Spatial Analyst Continued Spatial Analyst - Spatial Analyst is an ArcGIS extension designed to work with raster data - in lecture I went through a series of demonstrations
Lecture 9. Raster Data Analysis. Tomislav Sapic GIS Technologist Faculty of Natural Resources Management Lakehead University
 Lecture 9 Raster Data Analysis Tomislav Sapic GIS Technologist Faculty of Natural Resources Management Lakehead University Raster Data Model The GIS raster data model represents datasets in which square
Network Analyst: Creating Network Datasets. Patrick Stevens Alan Hatakeyama
 Network Analyst: Creating Network Datasets Patrick Stevens Alan Hatakeyama Agenda Do you need to create a network dataset? Preparing street data for use in a network dataset Using turns, signposts, and
Object modeling and geodatabases. GEOG 419: Advanced GIS
 Object modeling and geodatabases GEOG 419: Advanced GIS CAD Data Model 1960s and 1970s Geographic data stored as points, lines, and areas No attributes; each feature type stored on a different layer No
ArcGIS Network Analyst and Network Dataset. Jim McKinney ESRI
 ArcGIS Network Analyst and Network Dataset Jim McKinney ESRI ArcGIS Network Analyst Everything in ArcView GIS 3x and more Routing Directions Network Analysis Tight Integration with Geoprocessing Models
Georeferencing. Georeferencing: = linking a layer or dataset with spatial coordinates. Registration: = lining up layers with each other
 Georeferencing How do we make sure all our data layers line up? Georeferencing: = linking a layer or dataset with spatial coordinates Registration: = lining up layers with each other Rectification: The
Surface Analysis. Data for Surface Analysis. What are Surfaces 4/22/2010
 Surface Analysis Cornell University Data for Surface Analysis Vector Triangulated Irregular Networks (TIN) a surface layer where space is partitioned into a set of non-overlapping triangles Attribute and
Spatial Interpolation & Geostatistics
 (Z i Z j ) 2 / 2 Spatial Interpolation & Geostatistics Lag Lag Mean Distance between pairs of points 11/3/2016 GEO327G/386G, UT Austin 1 Tobler s Law All places are related, but nearby places are related
Cell based GIS. Introduction to rasters
 Week 9 Cell based GIS Introduction to rasters topics of the week Spatial Problems Modeling Raster basics Application functions Analysis environment, the mask Application functions Spatial Analyst in ArcGIS
Surface Creation & Analysis with 3D Analyst
 Esri International User Conference July 23 27 San Diego Convention Center Surface Creation & Analysis with 3D Analyst Khalid Duri Surface Basics Defining the surface Representation of any continuous measurement
Surface Analysis with 3D Analyst
 2013 Esri International User Conference July 8 12, 2013 San Diego, California Technical Workshop Surface Analysis with 3D Analyst Khalid H. Duri Esri UC2013. Technical Workshop. Why use 3D GIS? Because
Analytical and Computer Cartography Winter Lecture 9: Geometric Map Transformations
 Analytical and Computer Cartography Winter 2017 Lecture 9: Geometric Map Transformations Cartographic Transformations Attribute Data (e.g. classification) Locational properties (e.g. projection) Graphics
Georeferencing & Spatial Adjustment
 Georeferencing & Spatial Adjustment Aligning Raster and Vector Data to the Real World Rotation Differential Scaling Distortion Skew Translation 1 The Problem How are geographically unregistered data, either
What can we represent as a Surface?
 Geography 38/42:376 GIS II Topic 7: Surface Representation and Analysis (Chang: Chapters 13 & 15) DeMers: Chapter 10 What can we represent as a Surface? Surfaces can be used to represent: Continuously
Geographic Surfaces. David Tenenbaum EEOS 383 UMass Boston
 Geographic Surfaces Up to this point, we have talked about spatial data models that operate in two dimensions How about the rd dimension? Surface the continuous variation in space of a third dimension
Spatial Analyst Identifying the Best Paths with Cost Distance Analysis. Kevin M. Johnston Elizabeth Graham
 Spatial Analyst Identifying the Best Paths with Cost Distance Analysis Kevin M. Johnston Elizabeth Graham Cost distance analysis - Outline What is cost distance analysis Creating a cost surface Cost Analysis
CPSC 695. Methods for interpolation and analysis of continuing surfaces in GIS Dr. M. Gavrilova
 CPSC 695 Methods for interpolation and analysis of continuing surfaces in GIS Dr. M. Gavrilova Overview Data sampling for continuous surfaces Interpolation methods Global interpolation Local interpolation
L7 Raster Algorithms
 L7 Raster Algorithms NGEN6(TEK23) Algorithms in Geographical Information Systems by: Abdulghani Hasan, updated Nov 216 by Per-Ola Olsson Background Store and analyze the geographic information: Raster
Network Analyst: Performing Network Analysis
 Esri International User Conference San Diego, California Technical Workshops July 24, 2012 Network Analyst: Performing Network Analysis Jay Sandhu Deelesh Mandloi Goals We assume you have some familiarity
GEOGRAPHIC INFORMATION SYSTEMS Lecture 18: Spatial Modeling
 Spatial Analysis in GIS (cont d) GEOGRAPHIC INFORMATION SYSTEMS Lecture 18: Spatial Modeling - the basic types of analysis that can be accomplished with a GIS are outlined in The Esri Guide to GIS Analysis
Georeferencing & Spatial Adjustment 2/13/2018
 Georeferencing & Spatial Adjustment The Problem Aligning Raster and Vector Data to the Real World How are geographically unregistered data, either raster or vector, made to align with data that exist in
NETWORK ANALYSIS in GIS
 NETWORK ANALYSIS in GIS SUBJECT PAPER MODULE Module ID GEOGRAPHY REMOTE SENSING, GIS and GPS NETWORK ANALYSIS in GIS Rs/GIS-26 Development Team Principal Investigator Prof. Masood Ahsan Siddiqui Jamia
What is Network Analyst?
 What is Network Analyst? Extension for analyzing transportation networks Four network solvers Route Closest Facility Service Area Uses Network Datasets Origin-Destination (OD) Cost Matrix Specialized layers
The Problem. Georeferencing & Spatial Adjustment. Nature Of The Problem: For Example: Georeferencing & Spatial Adjustment 9/20/2016
 Georeferencing & Spatial Adjustment Aligning Raster and Vector Data to the Real World The Problem How are geographically unregistered data, either raster or vector, made to align with data that exist in
GIS IN ECOLOGY: MORE RASTER ANALYSES
 GIS IN ECOLOGY: MORE RASTER ANALYSES Contents Introduction... 2 More Raster Application Functions... 2 Data Sources... 3 Tasks... 4 Raster Recap... 4 Viewshed Determining Visibility... 5 Hydrology Modeling
IMPROVING THE ACCURACY OF DIGITAL TERRAIN MODELS
 STUDIA UNIV. BABEŞ BOLYAI, INFORMATICA, Volume XLV, Number 1, 2000 IMPROVING THE ACCURACY OF DIGITAL TERRAIN MODELS GABRIELA DROJ Abstract. The change from paper maps to GIS, in various kinds of geographical
GIS Tools - Geometry. A GIS stores data as different layers of information Different feature types are stored in individual files.
 A Definition of GIS GIS is a system of hardware, software, and procedures designed to support the capture, management, manipulation, analysis, modeling and display of spatially referenced data for solving
Spatial Analysis (Vector) I
 I") Spatial Analysis (Vector) I GEOG 300, Lecture 8 Dr. Anthony Jjumba 1 Spatial Analysis In a GIS, Data are usually grouped into layers (or themes). The analysis functions of a GIS use the spatial and non-spatial
Spatial Analysis (Vector) I GEOG 300, Lecture 8 Dr. Anthony Jjumba 1 Spatial Analysis In a GIS, Data are usually grouped into layers (or themes). The analysis functions of a GIS use the spatial and non-spatial
UNDERSTAND HOW TO SET UP AND RUN A HYDRAULIC MODEL IN HEC-RAS CREATE A FLOOD INUNDATION MAP IN ARCGIS.
 CE 412/512, Spring 2017 HW9: Introduction to HEC-RAS and Floodplain Mapping Due: end of class, print and hand in. HEC-RAS is a Hydrologic Modeling System that is designed to describe the physical properties
Network Analyst Creating Network Datasets. Jay Sandhu Frank Kish
 Network Analyst Creating Network Datasets Jay Sandhu Frank Kish Agenda Preparing Street Data for use in a network dataset - One-way streets - Hierarchy - RoadClass attribute Using turns, signposts, and
Size: Small Medium X Large
 Field Operations Guide By: Elise Fisher Organization: EF Geographic. L.C. Response Time Analysis Brief Explanation: Uses GIS to assess expected response times from each of their existing public safety
Lab 12: Sampling and Interpolation
 Lab 12: Sampling and Interpolation What You ll Learn: -Systematic and random sampling -Majority filtering -Stratified sampling -A few basic interpolation methods Data for the exercise are in the L12 subdirectory.
Learn how to delineate a watershed using the hydrologic modeling wizard
 v. 10.1 WMS 10.1 Tutorial Learn how to delineate a watershed using the hydrologic modeling wizard Objectives Import a digital elevation model, compute flow directions, and delineate a watershed and sub-basins
Graphic Display of Vector Object
 What is GIS? GIS stands for Geographic Information Systems, although the term Geographic Information Science is gaining popularity. A GIS is a software platform for storing, organizing, viewing, querying,
Raster Data. James Frew ESM 263 Winter
 Raster Data 1 Vector Data Review discrete objects geometry = points by themselves connected lines closed polygons attributes linked to feature ID explicit location every point has coordinates 2 Fields
Network Analyst: An Introduction
 2013 Esri International User Conference July 8 12, 2013 San Diego, California Technical Workshop Network Analyst: An Introduction Patrick Stevens Robert Garrity Esri UC2013. Technical Workshop. Introduction
Delineating the Stream Network and Watersheds of the Guadalupe Basin
 Delineating the Stream Network and Watersheds of the Guadalupe Basin Francisco Olivera Department of Civil Engineering Texas A&M University Srikanth Koka Department of Civil Engineering Texas A&M University
Learn how to delineate a watershed using the hydrologic modeling wizard
 v. 11.0 WMS 11.0 Tutorial Learn how to delineate a watershed using the hydrologic modeling wizard Objectives Import a digital elevation model, compute flow directions, and delineate a watershed and sub-basins
The Problem. Georeferencing & Spatial Adjustment. Nature of the problem: For Example: Georeferencing & Spatial Adjustment 2/4/2014
 Georeferencing & Spatial Adjustment Aligning Raster and Vector Data to a GIS The Problem How are geographically unregistered data, either raster or vector, made to align with data that exist in geographical
GIS Data Models. 4/9/ GIS Data Models
 GIS Data Models 1 Conceptual models of the real world The real world can be described using two conceptually different models: 1. As discrete objects, possible to represent as points, lines or polygons.
Raster Analysis and Functions. David Tenenbaum EEOS 465 / 627 UMass Boston
 Raster Analysis and Functions Local Functions By-cell operations Operated on by individual operators or by coregistered grid cells from other themes Begin with each target cell, manipulate through available
Maps as Numbers: Data Models
 Maps as Numbers: Data Models vertices E Reality S E S arcs S E Conceptual Models nodes E Logical Models S Start node E End node S Physical Models 1 The Task An accurate, registered, digital map that can
Class #2. Data Models: maps as models of reality, geographical and attribute measurement & vector and raster (and other) data structures
 data structures") Class #2 Data Models: maps as models of reality, geographical and attribute measurement & vector and raster (and other) data structures Role of a Data Model Levels of Data Model Abstraction GIS as Digital
Class #2 Data Models: maps as models of reality, geographical and attribute measurement & vector and raster (and other) data structures Role of a Data Model Levels of Data Model Abstraction GIS as Digital
Soil texture: based on percentage of sand in the soil, partially determines the rate of percolation of water into the groundwater.
 Overview: In this week's lab you will identify areas within Webster Township that are most vulnerable to surface and groundwater contamination by conducting a risk analysis with raster data. You will create
Esri International User Conference. July San Diego Convention Center. Lidar Solutions. Clayton Crawford
 Esri International User Conference July 23 27 San Diego Convention Center Lidar Solutions Clayton Crawford Outline Data structures, tools, and workflows Assessing lidar point coverage and sample density
INTRODUCTION TO GIS WORKSHOP EXERCISE
 111 Mulford Hall, College of Natural Resources, UC Berkeley (510) 643-4539 INTRODUCTION TO GIS WORKSHOP EXERCISE This exercise is a survey of some GIS and spatial analysis tools for ecological and natural
Representing Geography
 Data models and axioms Chapters 3 and 7 Representing Geography Road map Representing the real world Conceptual models: objects vs fields Implementation models: vector vs raster Vector topological model
Surface Modeling with GIS
 Surface Modeling with GIS By Abdul Mohsen Al Maskeen ID # 889360 For CRP 514: Introduction to GIS Course Instructor: Dr. Baqer Al-Ramadan Date: December 29, 2004 1 Outline Page # Outline -------------------------------------------------------------
Open File Explorer Start Pro with SanFran project Open Locator in SanFran project Open Browser and AGOL with RouteExample Web map.
 Open File Explorer Start Pro with SanFran project Open Locator in SanFran project Open Browser and AGOL with RouteExample Web map. Open Browser with this: http://nadev.arcgis.com/arcgis/samples/easyvrp/easyvrp.html
GEOGRAPHIC INFORMATION SYSTEMS Lecture 02: Feature Types and Data Models
 GEOGRAPHIC INFORMATION SYSTEMS Lecture 02: Feature Types and Data Models Feature Types and Data Models How Does a GIS Work? - a GIS operates on the premise that all of the features in the real world can
Introduction to 3D Analysis. Jinwu Ma Jie Chang Khalid Duri
 Introduction to 3D Analysis Jinwu Ma Jie Chang Khalid Duri Area & Volume 3D Analyst Features Detect Change Determine Cut/Fill Calculate Surface Area & Volume Data Management Data Creation Data Conversion
Contents of Lecture. Surface (Terrain) Data Models. Terrain Surface Representation. Sampling in Surface Model DEM
 Data Models. Terrain Surface Representation. Sampling in Surface Model DEM") Lecture 13: Advanced Data Models: Terrain mapping and Analysis Contents of Lecture Surface Data Models DEM GRID Model TIN Model Visibility Analysis Geography 373 Spring, 2006 Changjoo Kim 11/29/2006 1
Lecture 13: Advanced Data Models: Terrain mapping and Analysis Contents of Lecture Surface Data Models DEM GRID Model TIN Model Visibility Analysis Geography 373 Spring, 2006 Changjoo Kim 11/29/2006 1
Delineating Watersheds from a Digital Elevation Model (DEM)
") Delineating Watersheds from a Digital Elevation Model (DEM) (Using example from the ESRI virtual campus found at http://training.esri.com/courses/natres/index.cfm?c=153) Download locations for additional
Delineating Watersheds from a Digital Elevation Model (DEM) (Using example from the ESRI virtual campus found at http://training.esri.com/courses/natres/index.cfm?c=153) Download locations for additional
WMS 9.1 Tutorial Watershed Modeling DEM Delineation Learn how to delineate a watershed using the hydrologic modeling wizard
 v. 9.1 WMS 9.1 Tutorial Learn how to delineate a watershed using the hydrologic modeling wizard Objectives Read a digital elevation model, compute flow directions, and delineate a watershed and sub-basins
DIGITAL TERRAIN MODELLING. Endre Katona University of Szeged Department of Informatics
 DIGITAL TERRAIN MODELLING Endre Katona University of Szeged Department of Informatics katona@inf.u-szeged.hu The problem: data sources data structures algorithms DTM = Digital Terrain Model Terrain function:
Lab 12: Sampling and Interpolation
 Lab 12: Sampling and Interpolation What You ll Learn: -Systematic and random sampling -Majority filtering -Stratified sampling -A few basic interpolation methods Videos that show how to copy/paste data
LECTURE 2 SPATIAL DATA MODELS
 LECTURE 2 SPATIAL DATA MODELS Computers and GIS cannot directly be applied to the real world: a data gathering step comes first. Digital computers operate in numbers and characters held internally as binary
Chapter 16: Network Analysis Functions
 Chapter 16: Network Analysis Functions Routing Routing in the API for JavaScript allows you to use the RouteTask to find routes between two or more locations and optionally get driving directions. The
Exercise 5. Height above Nearest Drainage Flood Inundation Analysis
 Exercise 5. Height above Nearest Drainage Flood Inundation Analysis GIS in Water Resources, Fall 2018 Prepared by David G Tarboton Purpose The purpose of this exercise is to learn how to calculation the
GIS Workbook #1. GIS Basics and the ArcGIS Environment. Helen Goodchild
 GIS Basics and the ArcGIS Environment Helen Goodchild Overview of Geographic Information Systems Geographical Information Systems (GIS) are used to display, manipulate and analyse spatial data (data that
Geoprocessing and georeferencing raster data
 Geoprocessing and georeferencing raster data Raster conversion tools Geoprocessing tools ArcCatalog tools ESRI Grid GDB Raster Raster Dataset Raster Catalog Erdas IMAGINE TIFF ArcMap - raster projection
Lidar and GIS: Applications and Examples. Dan Hedges Clayton Crawford
 Lidar and GIS: Applications and Examples Dan Hedges Clayton Crawford Outline Data structures, tools, and workflows Assessing lidar point coverage and sample density Creating raster DEMs and DSMs Data area
Raster Data Model & Analysis
 Topics: 1. Understanding Raster Data 2. Adding and displaying raster data in ArcMap 3. Converting between floating-point raster and integer raster 4. Converting Vector data to Raster 5. Querying Raster
Technology Advancements in Pipeline Data Management. Jeff Allen, Pipeline Practice Lead
 Technology Advancements in Pipeline Data Management Jeff Allen, Pipeline Practice Lead Common Patterns for Pipeline Organizations Mapping & Visualization Data Management Field Mobility Monitoring Analytics
ENGRG Introduction to GIS
 ENGRG 59910 Introduction to GIS Michael Piasecki April 3, 2014 Lecture 11: Raster Analysis GIS Related? 4/3/2014 ENGRG 59910 Intro to GIS 2 1 Why we use Raster GIS In our previous discussion of data models,
GIS Applications 22/10/2014. CentrographicStatistics LECTURE 2
 CentrographicStatistics GIS Applications LECTURE 2 The most basic type of descriptors for the spatial distribution of crime incidents are centrographic statistics. -basic parameters - They include: 1.
Statistical surfaces and interpolation. This is lecture ten
 Statistical surfaces and interpolation This is lecture ten Data models for representation of surfaces So far have considered field and object data models (represented by raster and vector data structures).
Spatial Analysis Exercise GIS in Water Resources Fall 2011
 Spatial Analysis Exercise GIS in Water Resources Fall 2011 Prepared by David G. Tarboton and David R. Maidment Goal The goal of this exercise is to serve as an introduction to Spatial Analysis with ArcGIS.
Welcome to NR402 GIS Applications in Natural Resources. This course consists of 9 lessons, including Power point presentations, demonstrations,
 Welcome to NR402 GIS Applications in Natural Resources. This course consists of 9 lessons, including Power point presentations, demonstrations, readings, and hands on GIS lab exercises. Following the last
layers in a raster model
 layers in a raster model Layer 1 Layer 2 layers in an vector-based model (1) Layer 2 Layer 1 layers in an vector-based model (2) raster versus vector data model Raster model Vector model Simple data structure
DATA MODELS IN GIS. Prachi Misra Sahoo I.A.S.R.I., New Delhi
 DATA MODELS IN GIS Prachi Misra Sahoo I.A.S.R.I., New Delhi -110012 1. Introduction GIS depicts the real world through models involving geometry, attributes, relations, and data quality. Here the realization
17/07/2013 RASTER DATA STRUCTURE GIS LECTURE 4 GIS DATA MODELS AND STRUCTURES RASTER DATA MODEL& STRUCTURE TIN- TRIANGULAR IRREGULAR NETWORK
 RASTER DATA STRUCTURE GIS LECTURE 4 GIS DATA MODELS AND STRUCTURES Space is subdivided into regular grids of square grid cells or other forms of polygonal meshes known as picture elements (pixels) the
Creating a Custom DEM and Measuring Bathymetric Change for the Multnomah Channel & Willamette River Confluence
 Creating a Custom DEM and Measuring Bathymetric Change for the Multnomah Channel & Willamette River Confluence Meara Butler Josh Schane GEOG 593 Fall 2012 Multnomah Channel begins three miles upstream
Proximity Analysis. Proximity Analysis
 Proximity Analysis Proximity Analysis 1 Ever wonder How close is the nearest gas station? What is the distance between your house and the candy store? What is the shortest route to get to Starbucks? Is
Data Assembly, Part II. GIS Cyberinfrastructure Module Day 4
 Data Assembly, Part II GIS Cyberinfrastructure Module Day 4 Objectives Continuation of effective troubleshooting Create shapefiles for analysis with buffers, union, and dissolve functions Calculate polygon
Copyright The McGraw-Hill Companies, Inc. Permission required for reproduction or display.
 CHAPTER 11 VECTOR DATA ANALYSIS 11.1 Buffering 11.1.1 Variations in Buffering Box 11.1 Riparian Buffer Width 11.1.2 Applications of Buffering 11.2 Overlay 11.2.1 Feature Type and Overlay 11.2.2 Overlay
Spatial Analysis with Raster Datasets
 Spatial Analysis with Raster Datasets Francisco Olivera, Ph.D., P.E. Srikanth Koka Lauren Walker Aishwarya Vijaykumar Keri Clary Department of Civil Engineering April 21, 2014 Contents Brief Overview of
APPENDIX E2. Vernal Pool Watershed Mapping
 APPENDIX E2 Vernal Pool Watershed Mapping MEMORANDUM To: U.S. Fish and Wildlife Service From: Tyler Friesen, Dudek Subject: SSHCP Vernal Pool Watershed Analysis Using LIDAR Data Date: February 6, 2014
Applied Cartography and Introduction to GIS GEOG 2017 EL. Lecture-7 Chapters 13 and 14
 Applied Cartography and Introduction to GIS GEOG 2017 EL Lecture-7 Chapters 13 and 14 Data for Terrain Mapping and Analysis DEM (digital elevation model) and TIN (triangulated irregular network) are two
Chapter 8: How to Pick a GIS
 Chapter 8: How to Pick a GIS 8. The Evolution of GIS Software 8.2 GIS and Operating Systems 8.3 GIS Software Capabilities 8.4 GIS Software and Data Structures 8.5 Choosing the Best GIS David Tenenbaum
University of West Hungary, Faculty of Geoinformatics. Béla Márkus. Spatial Analysis 5. module SAN5. 3D analysis
 University of West Hungary, Faculty of Geoinformatics Béla Márkus Spatial Analysis 5. module SAN5 3D analysis SZÉKESFEHÉRVÁR 2010 The right to this intellectual property is protected by the 1999/LXXVI
Geostatistics Predictions with Deterministic Procedures
 Instituto Superior de Estatística e Gestão de Informação Universidade Nova de Lisboa Master of Science in Geospatial Technologies Geostatistics Predictions with Deterministic Procedures Carlos Alberto
Practical II ArcGIS (10.0) for IWCM
 for IWCM") Author: A.Priki Practical II ArcGIS (10.0) for IWCM AIM: In this workshop we will introduce some of the most commonly used ArcGIS functionalities for Integrated Water Cycle Management. You will get a chance
Author: A.Priki Practical II ArcGIS (10.0) for IWCM AIM: In this workshop we will introduce some of the most commonly used ArcGIS functionalities for Integrated Water Cycle Management. You will get a chance
Review of Cartographic Data Types and Data Models
 Review of Cartographic Data Types and Data Models GIS Data Models Raster Versus Vector in GIS Analysis Fundamental element used to represent spatial features: Raster: pixel or grid cell. Vector: x,y coordinate
Steps for Modeling a Proposed New Reservoir in GIS
 Steps for Modeling a Proposed New Reservoir in GIS Requirements: ArcGIS ArcMap, ArcScene, Spatial Analyst, and 3D Analyst There s a new reservoir proposed for Right Hand Fork in Logan Canyon. I wanted