Steps for Modeling a Proposed New Reservoir in GIS
|
|
|
- Loren Gray
- 5 years ago
- Views:
Transcription

1 Steps for Modeling a Proposed New Reservoir in GIS Requirements: ArcGIS ArcMap, ArcScene, Spatial Analyst, and 3D Analyst There s a new reservoir proposed for Right Hand Fork in Logan Canyon. I wanted to estimate the footprint of the proposed reservoir and create a model that I could use to generate the elevation-storage and elevation-surface area relationships for the proposed reservoir. I also wanted to use the outline of the proposed reservoir to overlay with other datasets (e.g., roads and land cover) to see what the impact would be. The following are the steps I followed: 1. Download 10-m DEM from the MRLC website 2. Project the DEM into NAD83 UTM Zone 12N (ned10) 3. Create a polygon clip area feature class (clipsquare) to clip the larger DEM to a smaller area (I don t want to have to process the whole thing) 4. Clip DEM to a smaller area just to speed analysis (ned10sub this dataset is the basis for my analysis) 5. Convert clipped DEM to a TIN using 3D Analyst Tools à Conversion à Raster to Tin allowing 0.5 m elevation difference (elevationtin) 1
.")
2 6. Create a Dam surface tin. a. Create a new line feature class (damlines). Start editing and add a line representing the alignment of the dam, but extending far beyond the dam edges. Use the copy parallel function of the editor toolbar dropdown to copy the line to the right 10 m (this creates a new line to represent the dam crest width of 10 m). Then use the copy parallel function to copy a line to the right 310 m to represent the slope of the dam face + the crest. This new line is the heal of the dam. Copy parallel to the left 300 m to represent the downstream face of the dam this is the toe of the dam. 2

.")
3 b. Create a new column in the attribute table for the damlines feature class called Elevation as a double. Assign elevation values to each of the lines. The two crest lines were set to 1920 m. This is a total WAG based on the surrounding elevations. I don t know what the actual dam alignment or height would be. The upstream and downstream line elevations were set assuming a slope of 2:1 for the dam faces (1770 m for each). This extends below the earth surface, but that s what I want. c. Now convert these lines to a tin using 3D Anayst Tools à Data Management à TIN à Create TIN. Call the output damtin. 3


4 The Dam Surface Tin in ArcMap: 4


5 The Dam Surface Tin as shown in ArcScene: The Dam Surface Tin as shown in ArcScene with the DEM Tin: 7. Now create the outline contour of the potential reservoir from the elevation tin. It will never happen that the reservoir will get as high as the crest of the dam, but for the purposes of 5
. The first line should align with the upstream crest line of the dam.")

6 creating the full elevation-volume, elevation-surface area curve, create this contour at the crest elevation of the dam (I set it at 1920 m). a. Create a flat tin surface at 1920 m elevation. i. Digitize a few parallel lines covering the whole area in a new feature class (surface1920lines). The first line should align with the upstream crest line of the dam. Use the copy parallel function in the editor toolbar to create the additional lines. ii. Create an Elevation attribute column as a double in the table for this feature class and assign an elevation for each line of 1920 m using the field calculator. iii. Convert the surface1920lines feature class to a flat tin surface (surface1920tin) using 3D Anayst Tools à Data Management à TIN à Create TIN 6

.")
7 b. Now subtract the elevationtin from the surface1920tin produced in the last step to get a polygon representing the contour at 1920 m (polygon1920). Use 3D Analyst Tools à Triangulated Surface à Surface Difference 7


8 The DAM and the 1920 m surface in ArcScene: The DAM, 1920 m Surface and DEM Tin in ArcScene: 8


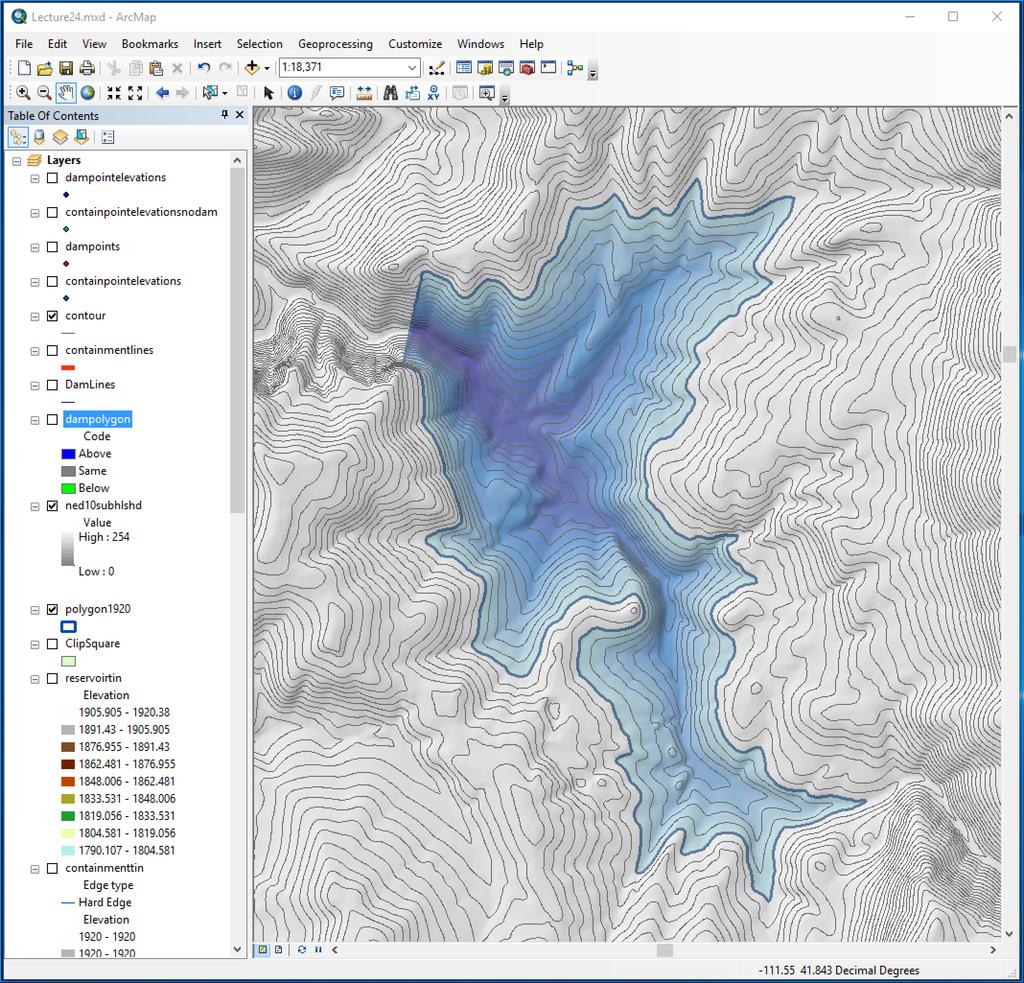
9 c. Now edit the resulting polygon1920 feature class to delete everything but the 1920 m elevation polygon representing the reservoir. 9


10 8. Now create the polygon footprint of the Dam (dampolygon). a. Use 3D Analyst Tools à Triangulated Surface à Surface Difference to subtract the elevationtin from the damtin. The following is the result: b. Edit the Dam polygon feature class to include only the dam footprint. 10

11 9. Now, we need a tin of just the reservoir for volume and surface area creation that includes everything below 1920 m elevation, but that also includes the slope of the upstream face of the dam. So do the following: a. Convert the polygon1920 feature class to a raster (reservoirrast) with value of 1 inside of the polygon and nodata outside using Conversion Tools à To Raster à Polygon to Raster. Set the environment settings so extent, grid sell size, and snap raster are the same as the input DEM (ned10sub) before doing this. 11
 to get a raster of the")
 using raster")
12 b. Now multiply the reservoirrast by the input DEM (ned10sub) to get a raster of the elevation for grid cells within the 1920m contour (reservoirelevations) using raster calculator. 12
 because they are based on the original DEM.")
13 c. Now convert the new raster of elevation values within the reservoir (reservoirelevations) to points using Conversion Tools à From Raster à Raster to Point (reservoirpointelevations) d. These points all have the right elevations except the ones that are on top of the new dam footprint (dampolygon) because they are based on the original DEM. So, use select by location to extract all points that do not intersect the new dam footprint and save to a new feature class (reservoirpointelevationsnodam) 13

14 e. Use select by location to select the points from reservoirpointelevations that intersect the dam footprint and convert to a new feature class (dampoints). f. Now the elevation values in the dampoints feature class are wrong because they are based on the ground elevation. So, I need to use the 3D Analyst Tools à Functional Surface à Interpolate Shape function to set the elevation values in the dampoints to 14
. 10.")

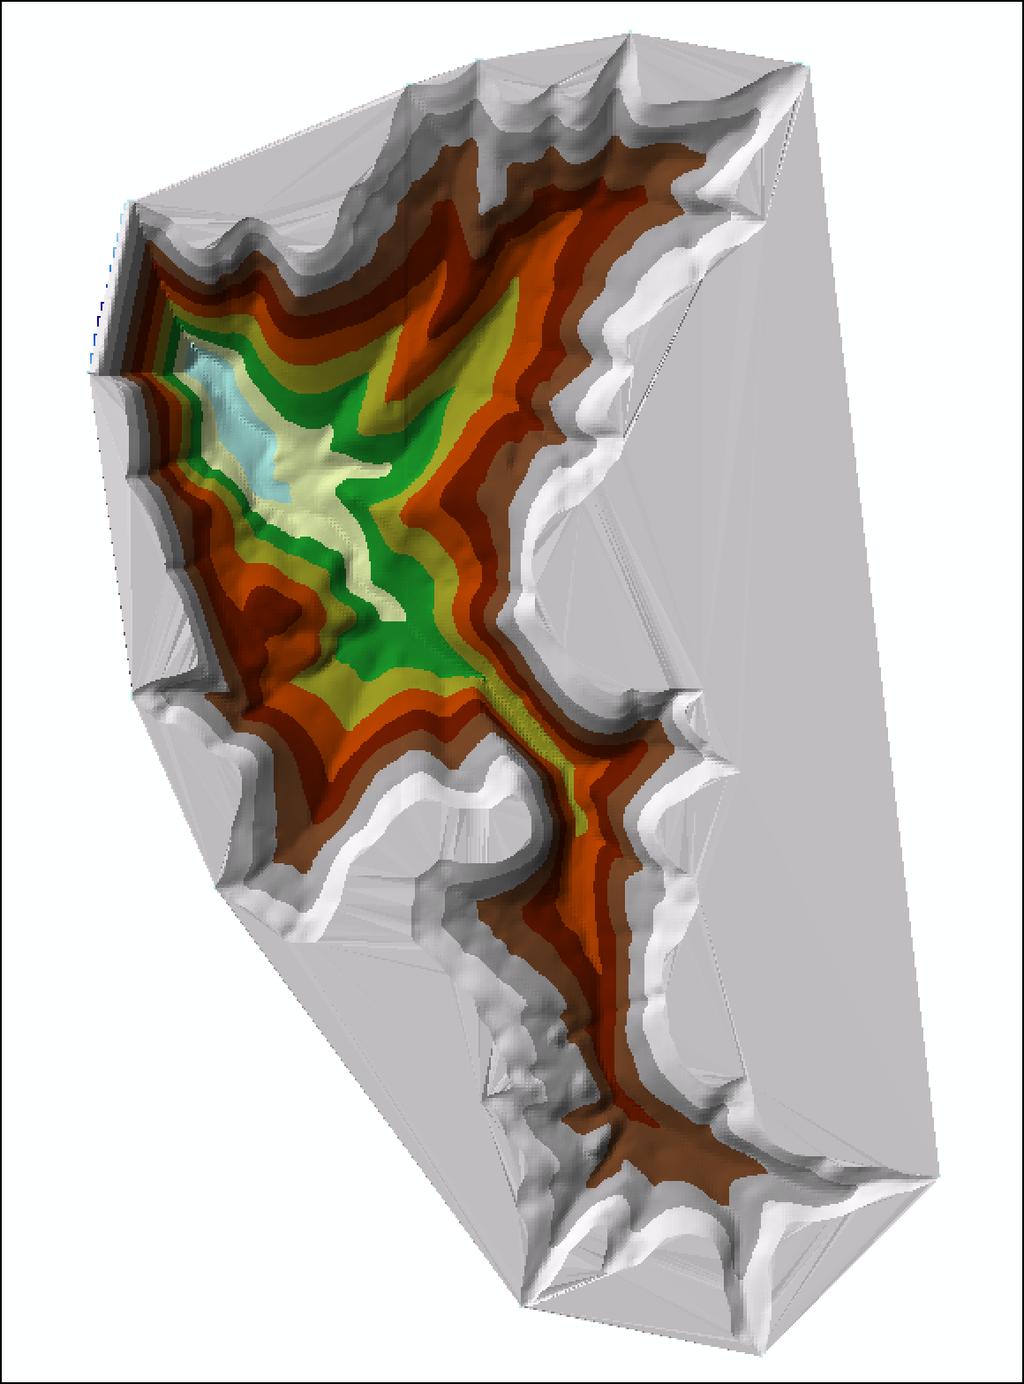
15 the elevations of the damtin surface. This function creates a new feature class (dampointelevations). 10. Now I can finally create a tin surface for the whole reservoir (reservoirtin) from the dampointelevations and the containpointelevationsnodam point feature classes using 3D Analyst Tools à Data Management à TIN à Create Tin. 15
16 16
17 17
GEOGRAPHIC INFORMATION SYSTEMS Lecture 25: 3D Analyst
 GEOGRAPHIC INFORMATION SYSTEMS Lecture 25: 3D Analyst 3D Analyst - 3D Analyst is an ArcGIS extension designed to work with TIN data (triangulated irregular network) - many of the tools in 3D Analyst also
Creating Contours using ArcMap
 Creating Contours with ArcMap and ArcScene Digital elevation models (DEMs) are geospatial datasets that contain elevation values sampled according to a regularly spaced rectangular grid. They can be used
Lab 18c: Spatial Analysis III: Clip a raster file using a Polygon Shapefile
 Environmental GIS Prepared by Dr. Zhi Wang, CSUF EES Department Lab 18c: Spatial Analysis III: Clip a raster file using a Polygon Shapefile These instructions enable you to clip a raster layer in ArcMap
Introduction to GIS 2011
 Introduction to GIS 2011 Digital Elevation Models CREATING A TIN SURFACE FROM CONTOUR LINES 1. Start ArcCatalog from either Desktop or Start Menu. 2. In ArcCatalog, create a new folder dem under your c:\introgis_2011
GY461 GIS 1: Environmental Campus Topography Project with ArcGIS 9.x
 I. Introduction GY461 GIS 1: Environmental In this project you will use data from a topographic survey of the USA campus to generate 2 separate maps: 1. A color-coded 2-dimensional topographic contour
Lidar and GIS: Applications and Examples. Dan Hedges Clayton Crawford
 Lidar and GIS: Applications and Examples Dan Hedges Clayton Crawford Outline Data structures, tools, and workflows Assessing lidar point coverage and sample density Creating raster DEMs and DSMs Data area
UNDERSTAND HOW TO SET UP AND RUN A HYDRAULIC MODEL IN HEC-RAS CREATE A FLOOD INUNDATION MAP IN ARCGIS.
 CE 412/512, Spring 2017 HW9: Introduction to HEC-RAS and Floodplain Mapping Due: end of class, print and hand in. HEC-RAS is a Hydrologic Modeling System that is designed to describe the physical properties
Combine Yield Data From Combine to Contour Map Ag Leader
 Combine Yield Data From Combine to Contour Map Ag Leader Exporting the Yield Data Using SMS Program 1. Data format On Hard Drive. 2. Start program SMS Basic. a. In the File menu choose Open. b. Click on
Creating raster DEMs and DSMs from large lidar point collections. Summary. Coming up with a plan. Using the Point To Raster geoprocessing tool
 Page 1 of 5 Creating raster DEMs and DSMs from large lidar point collections ArcGIS 10 Summary Raster, or gridded, elevation models are one of the most common GIS data types. They can be used in many ways
Lecture 21 - Chapter 8 (Raster Analysis, part2)
") GEOL 452/552 - GIS for Geoscientists I Lecture 21 - Chapter 8 (Raster Analysis, part2) Today: Digital Elevation Models (DEMs), Topographic functions (surface analysis): slope, aspect hillshade, viewshed,
GEOL 452/552 - GIS for Geoscientists I Lecture 21 - Chapter 8 (Raster Analysis, part2) Today: Digital Elevation Models (DEMs), Topographic functions (surface analysis): slope, aspect hillshade, viewshed,
Ex. 4: Locational Editing of The BARC
 Ex. 4: Locational Editing of The BARC Using the BARC for BAER Support Document Updated: April 2010 These exercises are written for ArcGIS 9.x. Some steps may vary slightly if you are working in ArcGIS
Field-Scale Watershed Analysis
 Conservation Applications of LiDAR Field-Scale Watershed Analysis A Supplemental Exercise for the Hydrologic Applications Module Andy Jenks, University of Minnesota Department of Forest Resources 2013
Using GIS to Site Minimal Excavation Helicopter Landings
 Using GIS to Site Minimal Excavation Helicopter Landings The objective of this analysis is to develop a suitability map for aid in locating helicopter landings in mountainous terrain. The tutorial uses
Using LIDAR to Design Embankments in ArcGIS. Written by Scott Ralston U.S. Fish & Wildlife Service Windom Wetland Management District
 Using LIDAR to Design Embankments in ArcGIS Written by Scott Ralston U.S. Fish & Wildlife Service Windom Wetland Management District This tutorial covers the basics of how to design a dike, embankment
Making Yield Contour Maps Using John Deere Data
 Making Yield Contour Maps Using John Deere Data Exporting the Yield Data Using JDOffice 1. Data Format On Hard Drive 2. Start program JD Office. a. From the PC Card menu on the left of the screen choose
Lecture 22 - Chapter 8 (Raster Analysis, part 3)
") GEOL 452/552 - GIS for Geoscientists I Lecture 22 - Chapter 8 (Raster Analysis, part 3) Today: Zonal Analysis (statistics) for polygons, lines, points, interpolation (IDW), Effects Toolbar, analysis masks
GEOL 452/552 - GIS for Geoscientists I Lecture 22 - Chapter 8 (Raster Analysis, part 3) Today: Zonal Analysis (statistics) for polygons, lines, points, interpolation (IDW), Effects Toolbar, analysis masks
Masking Lidar Cliff-Edge Artifacts
 Masking Lidar Cliff-Edge Artifacts Methods 6/12/2014 Authors: Abigail Schaaf is a Remote Sensing Specialist at RedCastle Resources, Inc., working on site at the Remote Sensing Applications Center in Salt
George Mason University Department of Civil, Environmental and Infrastructure Engineering. Dr. Celso Ferreira Prepared by Lora Baumgartner
 George Mason University Department of Civil, Environmental and Infrastructure Engineering Dr. Celso Ferreira Prepared by Lora Baumgartner Exercise Topic: Getting started with HEC GeoRAS Objective: Create
LAB #7 Creating TIN and 3D scenes (ArcScene) GISC, UNIVERSITY OF CALIFORNIA BERKELEY
 GISC, UNIVERSITY OF CALIFORNIA BERKELEY") LAB #7 Creating TIN and 3D scenes (ArcScene) GISC, UNIVERSITY OF CALIFORNIA BERKELEY The purpose of this laboratory is to introduce and explore surface data analysis using a vector data model: TIN. We
LAB #7 Creating TIN and 3D scenes (ArcScene) GISC, UNIVERSITY OF CALIFORNIA BERKELEY The purpose of this laboratory is to introduce and explore surface data analysis using a vector data model: TIN. We
The 3D Analyst extension extends ArcGIS to support surface modeling and 3- dimensional visualization. 3D Shape Files
 NRM 435 Spring 2016 ArcGIS 3D Analyst Page#1 of 9 0B3D Analyst Extension The 3D Analyst extension extends ArcGIS to support surface modeling and 3- dimensional visualization. 3D Shape Files Analogous to
Using GIS To Estimate Changes in Runoff and Urban Surface Cover In Part of the Waller Creek Watershed Austin, Texas
 Using GIS To Estimate Changes in Runoff and Urban Surface Cover In Part of the Waller Creek Watershed Austin, Texas Jordan Thomas 12-6-2009 Introduction The goal of this project is to understand runoff
Module 7 Raster operations
 Introduction Geo-Information Science Practical Manual Module 7 Raster operations 7. INTRODUCTION 7-1 LOCAL OPERATIONS 7-2 Mathematical functions and operators 7-5 Raster overlay 7-7 FOCAL OPERATIONS 7-8
A Second Look at DEM s
 A Second Look at DEM s Overview Detailed topographic data is available for the U.S. from several sources and in several formats. Perhaps the most readily available and easy to use is the National Elevation
The Volume and Extent of the Lake Created by the Bridge of the Gods, Colombia River
 Rachel Markoff 12/1/2011 GEO 327G/386G Term Project The Volume and Extent of the Lake Created by the Bridge of the Gods, Colombia River 1. Introduction The Bonneville Landslide occurred on the Colombia
Watershed Sciences 4930 & 6920 GEOGRAPHIC INFORMATION SYSTEMS
 HOUSEKEEPING Watershed Sciences 4930 & 6920 GEOGRAPHIC INFORMATION SYSTEMS CONTOURS! Self-Paced Lab Due Friday! WEEK SIX Lecture RASTER ANALYSES Joe Wheaton YOUR EXCERCISE Integer Elevations Rounded up
Applied Cartography and Introduction to GIS GEOG 2017 EL. Lecture-7 Chapters 13 and 14
 Applied Cartography and Introduction to GIS GEOG 2017 EL Lecture-7 Chapters 13 and 14 Data for Terrain Mapping and Analysis DEM (digital elevation model) and TIN (triangulated irregular network) are two
Esri International User Conference. July San Diego Convention Center. Lidar Solutions. Clayton Crawford
 Esri International User Conference July 23 27 San Diego Convention Center Lidar Solutions Clayton Crawford Outline Data structures, tools, and workflows Assessing lidar point coverage and sample density
Lab 12: Sampling and Interpolation
 Lab 12: Sampling and Interpolation What You ll Learn: -Systematic and random sampling -Majority filtering -Stratified sampling -A few basic interpolation methods Videos that show how to copy/paste data
Lecture 6: GIS Spatial Analysis. GE 118: INTRODUCTION TO GIS Engr. Meriam M. Santillan Caraga State University
 Lecture 6: GIS Spatial Analysis GE 118: INTRODUCTION TO GIS Engr. Meriam M. Santillan Caraga State University 1 Spatial Data It can be most simply defined as information that describes the distribution
RASTER ANALYSIS S H A W N L. P E N M A N E A R T H D A T A A N A LY S I S C E N T E R U N I V E R S I T Y O F N E W M E X I C O
 RASTER ANALYSIS S H A W N L. P E N M A N E A R T H D A T A A N A LY S I S C E N T E R U N I V E R S I T Y O F N E W M E X I C O TOPICS COVERED Spatial Analyst basics Raster / Vector conversion Raster data
Lab 11: Terrain Analyses
 Lab 11: Terrain Analyses What You ll Learn: Basic terrain analysis functions, including watershed, viewshed, and profile processing. There is a mix of old and new functions used in this lab. We ll explain
Follow-Up on the Nueces River Groundwater Problem Uvalde Co. TX
 Follow-Up on the Nueces River Groundwater Problem Uvalde Co. TX Analysis by Ryan Kraft 12/4/2014 1 Problem Formulation A reduction in discharge was detected at a gauging station along a portion of the
GEOGRAPHIC INFORMATION SYSTEMS Lecture 24: Spatial Analyst Continued
 GEOGRAPHIC INFORMATION SYSTEMS Lecture 24: Spatial Analyst Continued Spatial Analyst - Spatial Analyst is an ArcGIS extension designed to work with raster data - in lecture I went through a series of demonstrations
Image Services for Elevation Data
 Image Services for Elevation Data Peter Becker Need for Elevation Using Image Services for Elevation Data sources Creating Elevation Service Requirement: GIS and Imagery, Integrated and Accessible Field
Lab 11: Terrain Analyses
 Lab 11: Terrain Analyses What You ll Learn: Basic terrain analysis functions, including watershed, viewshed, and profile processing. There is a mix of old and new functions used in this lab. We ll explain
COPYRIGHTED MATERIAL. Introduction to 3D Data: Modeling with ArcGIS 3D Analyst and Google Earth CHAPTER 1
 CHAPTER 1 Introduction to 3D Data: Modeling with ArcGIS 3D Analyst and Google Earth Introduction to 3D Data is a self - study tutorial workbook that teaches you how to create data and maps with ESRI s
Tutorial 18: 3D and Spatial Analyst - Creating a TIN and Visual Analysis
 Tutorial 18: 3D and Spatial Analyst - Creating a TIN and Visual Analysis Module content 18.1. Creating a TIN 18.2. Spatial Analyst Viewsheds, Slopes, Hillshades and Density. 18.1 Creating a TIN Sometimes
I.1. Digitize landslide region and micro-topography using satellite image
 I. Data Preparation At this part, it will be shown the stages of process on preparing all types of data which required in making of landslide potential and banjir bandang hazard map. I.1. Digitize landslide
Surface Analysis with 3D Analyst
 2013 Esri International User Conference July 8 12, 2013 San Diego, California Technical Workshop Surface Analysis with 3D Analyst Khalid H. Duri Esri UC2013. Technical Workshop. Why use 3D GIS? Because
THE HONG KONG POLYTECHNIC UNIVERSITY DEPARTMENT OF LAND SURVEYING & GEO-INFORMATICS LSGI521 PRINCIPLES OF GIS
 THE HONG KONG POLYTECHNIC UNIVERSITY DEPARTMENT OF LAND SURVEYING & GEO-INFORMATICS LSGI521 PRINCIPLES OF GIS Student name: Student ID: Table of Content Working with files, folders, various software and
GEOGRAPHIC INFORMATION SYSTEMS Lecture 02: Feature Types and Data Models
 GEOGRAPHIC INFORMATION SYSTEMS Lecture 02: Feature Types and Data Models Feature Types and Data Models How Does a GIS Work? - a GIS operates on the premise that all of the features in the real world can
START>PROGRAMS>ARCGIS>
 Department of Urban Studies and Planning Spring 2006 Department of Architecture Site and Urban Systems Planning 11.304J / 4.255J GIS EXERCISE 2 Objectives: To generate the following maps using ArcGIS Software:
Stream network delineation and scaling issues with high resolution data
 Stream network delineation and scaling issues with high resolution data Roman DiBiase, Arizona State University, May 1, 2008 Abstract: In this tutorial, we will go through the process of extracting a stream
Potential Applications of the new InfoWorks ICM Mesh level Zones
 Introduction Potential Applications of the new InfoWorks ICM Mesh level Zones Exciting new functionality has been added to InfoWorks ICM version 5.5 to allow improved editing of the 2D mesh. The new functionality
v. 9.1 WMS 9.1 Tutorial Watershed Modeling HEC-1 Interface Learn how to setup a basic HEC-1 model using WMS
 v. 9.1 WMS 9.1 Tutorial Learn how to setup a basic HEC-1 model using WMS Objectives Build a basic HEC-1 model from scratch using a DEM, land use, and soil data. Compute the geometric and hydrologic parameters
ENGRG Introduction to GIS
 ENGRG 59910 Introduction to GIS Michael Piasecki April 3, 2014 Lecture 11: Raster Analysis GIS Related? 4/3/2014 ENGRG 59910 Intro to GIS 2 1 Why we use Raster GIS In our previous discussion of data models,
Lecture 20 - Chapter 8 (Raster Analysis, part1)
") GEOL 452/552 - GIS for Geoscientists I Lecture 20 - Chapter 8 (Raster Analysis, part) 4 lectures on rasters - but won t cover everything (Raster GIS course: Geol 588: GIS II (Spring 20) Today: Raster data,
GEOL 452/552 - GIS for Geoscientists I Lecture 20 - Chapter 8 (Raster Analysis, part) 4 lectures on rasters - but won t cover everything (Raster GIS course: Geol 588: GIS II (Spring 20) Today: Raster data,
Introduction to 3D Analysis. Jinwu Ma Jie Chang Khalid Duri
 Introduction to 3D Analysis Jinwu Ma Jie Chang Khalid Duri Area & Volume 3D Analyst Features Detect Change Determine Cut/Fill Calculate Surface Area & Volume Data Management Data Creation Data Conversion
Tutorial 1: Downloading elevation data
 Tutorial 1: Downloading elevation data Objectives In this exercise you will learn how to acquire elevation data from the website OpenTopography.org, project the dataset into a UTM coordinate system, and
Your Prioritized List. Priority 1 Faulted gridding and contouring. Priority 2 Geoprocessing. Priority 3 Raster format
 Your Prioritized List Priority 1 Faulted gridding and contouring Priority 2 Geoprocessing Priority 3 Raster format Priority 4 Raster Catalogs and SDE Priority 5 Expanded 3D Functionality Priority 1 Faulted
Raster Data. James Frew ESM 263 Winter
 Raster Data 1 Vector Data Review discrete objects geometry = points by themselves connected lines closed polygons attributes linked to feature ID explicit location every point has coordinates 2 Fields
WMS 8.4 Tutorial Hydraulics and Floodplain Modeling Simplified Dam Break Learn how to run a dam break simulation and delineate its floodplain
 v. 8.4 WMS 8.4 Tutorial Hydraulics and Floodplain Modeling Simplified Dam Break Learn how to run a dam break simulation and delineate its floodplain Objectives Setup a conceptual model of stream centerlines
Surface Creation & Analysis with 3D Analyst
 Esri International User Conference July 23 27 San Diego Convention Center Surface Creation & Analysis with 3D Analyst Khalid Duri Surface Basics Defining the surface Representation of any continuous measurement
Lab 7: Bedrock rivers and the relief structure of mountain ranges
 Lab 7: Bedrock rivers and the relief structure of mountain ranges Objectives In this lab, you will analyze the relief structure of the San Gabriel Mountains in southern California and how it relates to
3D Analyst Visualization with ArcGlobe. Brady Hoak, ESRI DC
 3D Analyst Visualization with ArcGlobe Brady Hoak, ESRI DC 3D GIS Viewing geospatial data in 3D leads to new insights 2D 3D Sometimes you need to edit your data in 3D 2D 3D Some problems can only be solved
Learn how to delineate a watershed using the hydrologic modeling wizard
 v. 11.0 WMS 11.0 Tutorial Learn how to delineate a watershed using the hydrologic modeling wizard Objectives Import a digital elevation model, compute flow directions, and delineate a watershed and sub-basins
Digital Elevation Model & Surface Analysis
 Topics: Digital Elevation Model & Surface Analysis 1. Introduction 2. Create raster DEM 3. Examine Lidar DEM 4. Deriving secondary surface products 5. Mapping contours 6. Viewshed Analysis 7. Extract elevation
2) Make sure that the georeferencing extension is on by right-clicking in the task bar area and selecting Georeferencing
 Make sure that the georeferencing extension is on by right-clicking in the task bar area and selecting Georeferencing") HGIS Workshop Module 1 Georeferencing Large Scale Scanned Historical Maps Objective: Learn the Principles of Georeferencing 1) In ArcMap, open the project 01 data\arcdata_10_1\arcdata\toronto\georeference.mxd
HGIS Workshop Module 1 Georeferencing Large Scale Scanned Historical Maps Objective: Learn the Principles of Georeferencing 1) In ArcMap, open the project 01 data\arcdata_10_1\arcdata\toronto\georeference.mxd
Geoprocessing and georeferencing raster data
 Geoprocessing and georeferencing raster data Raster conversion tools Geoprocessing tools ArcCatalog tools ESRI Grid GDB Raster Raster Dataset Raster Catalog Erdas IMAGINE TIFF ArcMap - raster projection
Initial Analysis of Natural and Anthropogenic Adjustments in the Lower Mississippi River since 1880
 Richard Knox CE 394K Fall 2011 Initial Analysis of Natural and Anthropogenic Adjustments in the Lower Mississippi River since 1880 Objective: The objective of this term project is to use ArcGIS to evaluate
GIS Workshop Spring 2016
 1/ 14 GIS Geographic Information System. An integrated collection of computer software and data used to view and manage information about geographic places, analyze spatial relationships, and model spatial
WMS 9.1 Tutorial Hydraulics and Floodplain Modeling Floodplain Delineation Learn how to us the WMS floodplain delineation tools
 v. 9.1 WMS 9.1 Tutorial Hydraulics and Floodplain Modeling Floodplain Delineation Learn how to us the WMS floodplain delineation tools Objectives Experiment with the various floodplain delineation options
An Introduction to Using Lidar with ArcGIS and 3D Analyst
 FedGIS Conference February 24 25, 2016 Washington, DC An Introduction to Using Lidar with ArcGIS and 3D Analyst Jim Michel Outline Lidar Intro Lidar Management Las files Laz, zlas, conversion tools Las
Review of Cartographic Data Types and Data Models
 Review of Cartographic Data Types and Data Models GIS Data Models Raster Versus Vector in GIS Analysis Fundamental element used to represent spatial features: Raster: pixel or grid cell. Vector: x,y coordinate
Spatial Analysis with Raster Datasets
 Spatial Analysis with Raster Datasets Francisco Olivera, Ph.D., P.E. Srikanth Koka Lauren Walker Aishwarya Vijaykumar Keri Clary Department of Civil Engineering April 21, 2014 Contents Brief Overview of
Lab 10: Raster Analyses
 Lab 10: Raster Analyses What You ll Learn: Spatial analysis and modeling with raster data. You will estimate the access costs for all points on a landscape, based on slope and distance to roads. You ll
Part 6b: The effect of scale on raster calculations mean local relief and slope
 Part 6b: The effect of scale on raster calculations mean local relief and slope Due: Be done with this section by class on Monday 10 Oct. Tasks: Calculate slope for three rasters and produce a decent looking
Exercise 5. Height above Nearest Drainage Flood Inundation Analysis
 Exercise 5. Height above Nearest Drainage Flood Inundation Analysis GIS in Water Resources, Fall 2018 Prepared by David G Tarboton Purpose The purpose of this exercise is to learn how to calculation the
WMS 9.1 Tutorial Watershed Modeling DEM Delineation Learn how to delineate a watershed using the hydrologic modeling wizard
 v. 9.1 WMS 9.1 Tutorial Learn how to delineate a watershed using the hydrologic modeling wizard Objectives Read a digital elevation model, compute flow directions, and delineate a watershed and sub-basins
Copyright The McGraw-Hill Companies, Inc. Permission required for reproduction or display.
 Chapter 13. TERRAIN MAPPING AND ANALYSIS 13.1 Data for Terrain Mapping and Analysis 13.1.1 DEM 13.1.2 TIN Box 13.1 Terrain Data Format 13.2 Terrain Mapping 13.2.1 Contouring 13.2.2 Vertical Profiling 13.2.3
Making ArcGIS Work for You. Elizabeth Cook USDA-NRCS GIS Specialist Columbia, MO
 Making ArcGIS Work for You Elizabeth Cook USDA-NRCS GIS Specialist Columbia, MO 1 Topics Using ArcMap beyond the Toolkit buttons GIS data formats Attributes and what you can do with them Calculating Acres
Delineating Watersheds from a Digital Elevation Model (DEM)
") Delineating Watersheds from a Digital Elevation Model (DEM) (Using example from the ESRI virtual campus found at http://training.esri.com/courses/natres/index.cfm?c=153) Download locations for additional
Delineating Watersheds from a Digital Elevation Model (DEM) (Using example from the ESRI virtual campus found at http://training.esri.com/courses/natres/index.cfm?c=153) Download locations for additional
MODULE 1 BASIC LIDAR TECHNIQUES
 MODULE SCENARIO One of the first tasks a geographic information systems (GIS) department using lidar data should perform is to check the quality of the data delivered by the data provider. The department
Working with Elevation Data URPL 969 Applied GIS Workshop: Rethinking New Orleans After Hurricane Katrina Spring 2006
 Working with Elevation Data URPL 969 Applied GIS Workshop: Rethinking New Orleans After Hurricane Katrina Spring 2006 This GIS lab exercise will explore Light Detection And Ranging (LiDAR) data for New
Contents of Lecture. Surface (Terrain) Data Models. Terrain Surface Representation. Sampling in Surface Model DEM
 Data Models. Terrain Surface Representation. Sampling in Surface Model DEM") Lecture 13: Advanced Data Models: Terrain mapping and Analysis Contents of Lecture Surface Data Models DEM GRID Model TIN Model Visibility Analysis Geography 373 Spring, 2006 Changjoo Kim 11/29/2006 1
Lecture 13: Advanced Data Models: Terrain mapping and Analysis Contents of Lecture Surface Data Models DEM GRID Model TIN Model Visibility Analysis Geography 373 Spring, 2006 Changjoo Kim 11/29/2006 1
Lidar Working with LAS Datasets
 2013 Esri International User Conference July 8 12, 2013 San Diego, California Technical Workshop Lidar Working with LAS Datasets Raghav Vemula (3D Team) Esri UC2013. Technical Workshop. Agenda Las Dataset
RASTER ANALYSIS GIS Analysis Winter 2016
 RASTER ANALYSIS GIS Analysis Winter 2016 Raster Data The Basics Raster Data Format Matrix of cells (pixels) organized into rows and columns (grid); each cell contains a value representing information.
WMS 10.1 Tutorial Hydraulics and Floodplain Modeling Simplified Dam Break Learn how to run a dam break simulation and delineate its floodplain
 v. 10.1 WMS 10.1 Tutorial Hydraulics and Floodplain Modeling Simplified Dam Break Learn how to run a dam break simulation and delineate its floodplain Objectives Setup a conceptual model of stream centerlines
Display Layers in Geosoft 3D View
 Use the New 2D/3D Workflow features in Target for ArcGIS In Target for ArcGIS version 3.5, there are three new interconnected features that make integrating 2D and 3D data in plan and section maps easier.
Learn how to delineate a watershed using the hydrologic modeling wizard
 v. 10.1 WMS 10.1 Tutorial Learn how to delineate a watershed using the hydrologic modeling wizard Objectives Import a digital elevation model, compute flow directions, and delineate a watershed and sub-basins
Using VBA and ArcMap to Create and Export 3D Buildings
 Using VBA and ArcMap to Create and Export 3D Buildings Abstract Brian Bradshaw Layers in ArcScene containing polygon features can be extruded to create 3D blocks for display in the current scene. While
Building 3D models with the horizons method
 ARC HYDRO GROUNDWATER TUTORIALS SUBSURFACE ANALYST Building 3D models with the horizons method Arc Hydro Groundwater (AHGW) is a geodatabase design for representing groundwater datasets within ArcGIS.
LECTURE 2 SPATIAL DATA MODELS
 LECTURE 2 SPATIAL DATA MODELS Computers and GIS cannot directly be applied to the real world: a data gathering step comes first. Digital computers operate in numbers and characters held internally as binary
PUG List. Raster Analysis 3D Analysis Geoprocessing. Steve Kopp
 PUG List Raster Analysis 3D Analysis Geoprocessing Steve Kopp Contour Polygons Spatial Analyst - color-filled contours. Similar to thematic classification, where blue = -1000 to zero, and red = 0 to +1000,
INTRODUCTION TO GIS WORKSHOP EXERCISE
 111 Mulford Hall, College of Natural Resources, UC Berkeley (510) 643-4539 INTRODUCTION TO GIS WORKSHOP EXERCISE This exercise is a survey of some GIS and spatial analysis tools for ecological and natural
Class #2. Data Models: maps as models of reality, geographical and attribute measurement & vector and raster (and other) data structures
 data structures") Class #2 Data Models: maps as models of reality, geographical and attribute measurement & vector and raster (and other) data structures Role of a Data Model Levels of Data Model Abstraction GIS as Digital
Class #2 Data Models: maps as models of reality, geographical and attribute measurement & vector and raster (and other) data structures Role of a Data Model Levels of Data Model Abstraction GIS as Digital
Objectives Learn how GMS uses rasters to support all kinds of digital elevation models and how rasters can be used for interpolation in GMS.
 v. 9.1 GMS 9.1 Tutorial Using rasters for interpolation and visualization in GMS Objectives Learn how GMS uses rasters to support all kinds of digital elevation models and how rasters can be used for interpolation
Peter Polito Dr. Helper GIS/GPS Final Project
 Peter Polito Dr. Helper GIS/GPS Final Project Processing LiDAR data to extract hydraulic radii of the Colorado River downstream of Max Starcke Dam, near Marble Falls, TX I. Problem Formulation Part of
Updated on November 10, 2017
 CIVE 7397 Unsteady flows in Rivers and Pipe Networks/Stormwater Management and Modeling / Optimization in Water Resources Engineering Updated on November 10, 2017 Tutorial on using HEC-GeoRAS 10.1 (or
GIS IN ECOLOGY: VISUALIZING IN 3D
 GIS IN ECOLOGY: VISUALIZING IN 3D Contents Introduction... 2 3D Analyst and ArcScene... 2 3D Data... 2 Course Data Sources... 3 Instructions for Copying the Course Dataset... 4 Tasks... 4 Visualizing and
Cell based GIS. Introduction to rasters
 Week 9 Cell based GIS Introduction to rasters topics of the week Spatial Problems Modeling Raster basics Application functions Analysis environment, the mask Application functions Spatial Analyst in ArcGIS
Creating Surfaces. Steve Kopp Steve Lynch
 Steve Kopp Steve Lynch Overview Learn the types of surfaces and the data structures used to store them Emphasis on surface interpolation Learn the interpolation workflow Understand how interpolators work
GIS IN ECOLOGY: VISUALIZING IN 3D
 GIS IN ECOLOGY: VISUALIZING IN 3D Contents Introduction... 2 3D Analyst and ArcScene... 2 3D Data... 3 Course Data Sources... 4 Copying the Course Dataset... 5 Tasks... 5 Creating/Converting 3D Data...
v Prerequisite Tutorials GSSHA Modeling Basics Stream Flow GSSHA WMS Basics Creating Feature Objects and Mapping their Attributes to the 2D Grid
 v. 10.1 WMS 10.1 Tutorial GSSHA Modeling Basics Developing a GSSHA Model Using the Hydrologic Modeling Wizard in WMS Learn how to setup a basic GSSHA model using the hydrologic modeling wizard Objectives
Lab 12: Sampling and Interpolation
 Lab 12: Sampling and Interpolation What You ll Learn: -Systematic and random sampling -Majority filtering -Stratified sampling -A few basic interpolation methods Data for the exercise are in the L12 subdirectory.
An Introduction to Lidar & Forestry May 2013
 An Introduction to Lidar & Forestry May 2013 Introduction to Lidar & Forestry Lidar technology Derivatives from point clouds Applied to forestry Publish & Share Futures Lidar Light Detection And Ranging
George Mason University Department of Civil, Environmental and Infrastructure Engineering. Dr. Celso Ferreira
 George Mason University Department of Civil, Environmental and Infrastructure Engineering Dr. Celso Ferreira Exercise Topic: HEC GeoRAS Post-Processing Objectives: This tutorial is designed to walk you
Lesson 5 overview. Concepts. Interpolators. Assessing accuracy Exercise 5
 Interpolation Tools Lesson 5 overview Concepts Sampling methods Creating continuous surfaces Interpolation Density surfaces in GIS Interpolators IDW, Spline,Trend, Kriging,Natural neighbors TopoToRaster
Understanding Geospatial Data Models
 Understanding Geospatial Data Models 1 A geospatial data model is a formal means of representing spatially referenced information. It is a simplified view of physical entities and a conceptualization of
Georeferencing & Spatial Adjustment
 Georeferencing & Spatial Adjustment Aligning Raster and Vector Data to the Real World Rotation Differential Scaling Distortion Skew Translation 1 The Problem How are geographically unregistered data, either