Esri International User Conference. San Diego, California. Technical Workshops. July Creating Surfaces. Steve Kopp and Steve Lynch
|
|
|
- Dinah Randall
- 5 years ago
- Views:
Transcription
1 Esri International User Conference San Diego, California Technical Workshops July 2011 Creating Surfaces Steve Kopp and Steve Lynch
2 Overview Learn the types of surfaces and the data structures used to store them Emphasis on surface interpolation Understand how interpolators work Learn the interpolation workflow Understand how to choose an appropriate interpolation technique and its parameters Additional useful tips and notes Questions / Answers


3 Types of Surfaces Elevation Soil chemistry Water quality Population Income Disease occurrence
4 What kind of surfaces do you create? What is the source data? - Points, lines, polygons, raster - Is quality a concern What is the phenomena? - Measurements, counts, something else Anything special or odd about it? - Discontinuous - Highs and lows sampled or not What do you want/expect for a result? - Raster, TIN, contour lines or polygons, estimates at points, estimate of surface quality


5 Storing surfaces in ArcGIS Raster TIN / Terrain Points - LAS Isolines / Contours Geostatistical Layer Note: in ArcGIS 10.1 LAS files are supported for direct use in Terrains and Mosaic Datasets
 Soft breaklines (road,")
6 TIN and Terrain Maintain accuracy of measured locations Discontinuities are handled with breaklines Hard breaklines (cliff, fault) Soft breaklines (road, stream)
7 Where do I find these capabilities? Spatial Analyst raster, contour 3D Analyst raster, contour, TIN, terrain Geostatistical Analyst raster, contour line, filled contour polygon, point, geostatistical layer
8 2 common types of surfaces Density surfaces of count per unit area Interpolated surfaces of measured quantities This session is about interpolation
9 Density Density surfaces are maps of magnitude per unit area Count occurrences of a phenomena within an area and distribute it through the area. Simple Density and Kernel Density Use points or lines as input. - Population per Km2 - Road density per Mi2

10 Interpolation Interpolation is the process of taking measurements of a continuous phenomena and transforming it into a continuous surface representation Estimating new values at unsampled locations
11 Types of input for Interpolation Points - Continuous values - LAS Polylines - Contours Polygon - Centriod - Areal Interpolation - Dasymetric mapping Raster - Fill in missing values - Change resolution through Resampling or Interpolation - Modify surface with supplemental data
12 Interpolation Workflow 1) Understand your data 2) Choose an appropriate interpolator and parameters 3) Evaluate the surface Repeat

13 Exploratory Spatial Data Analysis Where is the data located? What are the values of the data points? How does the location of a point relate to its value?


14 Understanding your data Exploratory Spatial Data Analysis (ESDA) Outliers - Incorrect data or the most influential data? Spatial Dependency - If not, why use Geostatistics? Distribution - How close to Gaussian distribution? Stationarity - Data preprocessing if non-stationary?
15 Exploring your Data Demonstration
16 Two parts of all interpolators Neighborhood definition where do I find known points to estimate a new value Estimation function from those points, how do I calculate a new value


17 Searching neighborhood Variable number of points - Specify a maximum search distance and number of points, a smaller number of points may be used. - Can result in NoData cells Fixed number of points - Specify a minimum number of points, and the search distance is increased until that number of points is found. Tobler s first law of geography applies "Everything is related to everything else, but near things are more related than distant things."


18 Multiple sectors - Geostatistical Analyst Multi-sector neighborhoods are very useful for data with an irregular spatial distribution or clustering

19 Choosing an appropriate interpolation tool - Natural Neighbors - Minimum Curvature Spline - Spline with Barriers - Radial Basis Functions - TopoToRaster - Local Polynomial - Global Polynomial - Diffusion Interpolation with Barriers - Kernel Interpolation with Barriers - Inverse Distance Weighted - Kriging - Cokriging - Moving Window Kriging - Geostatistical Simulation


20 Considerations in choosing an interpolator Standard error of prediction Stationarity Normally distributed Exact interpolator Support barriers Speed

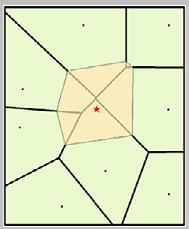
21 The simplest, safest interpolator Natural Neighbor
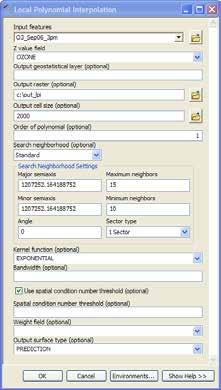
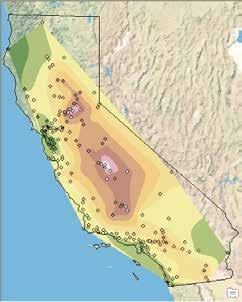
22 Local Polynomial Interpolation (LPI)
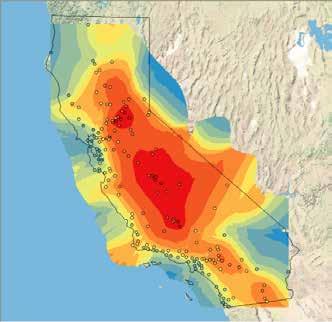
23 Easy Interpolations of Ozone Concentration Demonstration
24 You want a prediction standard error map Choose from: Local Polynomial Interpolation Kernel Interpolation Kriging
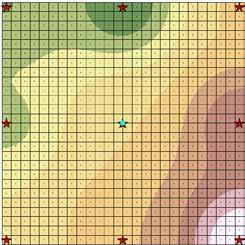
25 You want an exact interpolator that honors the points Choose from: IDW Natural Neighbors Spline Radial Basis Function
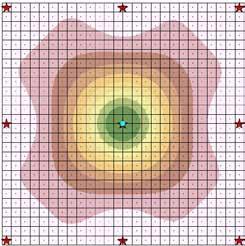
26 The high and low values have not been sampled and are important Do not use Natural Neighbors IDW

27 You want smooth interpolation Unlike smoothing the output, this method modifies the weights Smooth interpolation is an option in the Geostatistical Analyst interpolators


28 When to use Kriging Assumptions: - Spatially correlated - Stationary * - Normally distributed Want prediction and prediction standard error
29 You know the phenomena is correlated with something measured more If you have a sparsely measured variable such as temperature, which is correlated with another variable such as elevation that has much more sampling Use CoKriging


30 Empirical Bayesian Kriging Advantages Requires minimal interactive modeling Allows accurate predictions of non-stationary data More accurate than other kriging methods for small datasets Geoprocessing tool Disadvantages Processing is slower than other kriging methods. Cokriging and anisotropy are unavailable.
31 Kriging Ozone Concentration Demonstration


32 There are cliffs, faults, or barriers in your data IDW Spline with Barriers Kernel Interpolation with Barriers Diffusion Interpolation with Barriers
33 Interpolation with Barriers Line of sight Non Euclidean distance?? IDW Kernel Interpolation with Barriers Diffusion Interpolation with Barriers Spline with Barriers
34 Geologic Interpolation with barriers Demonstration


35 For contour input, and creating hydrologic DEMs Topo To Raster - ANUDEM Inputs - Spot heights - Contours - Streams - Sinks - Lakes Optional drainage enforcement ArcGIS 10.1 updated to ANUDEM 5.3 More diagnostic featureclass outputs Improved lake handling Supports cliffs and coastlines Works with larger output


36 TopoToRaster for DEM Creation Demonstration


37 Your input is polygons Use Areal Interpolation Obesity by school zone Obesity surface and error surface Obesity by census block Statistically robust method for creating surfaces aggregated polygon data And aggregating back to other polygons


38 How good is your surface? Standard Error surface Cross Validation Subset Features


39 Your input is equally spaced points If input points are already equally spaced on a regular grid, you probably don t need to interpolate, just use PointsToRaster


40 You have many input points per output cell If your data is highly oversampled, you probably do not need to interpolate, you can just use the PointsToRaster tool, and select the statistic of interest.
41 Working with VERY large input point data Point To Raster - Most frequent - Sum, mean std. deviation - Minimum, maximum, range, count Smaller input extent Subset Features
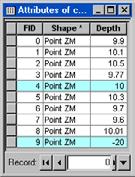
42 Handling Coincident/Duplicate Points
43 Why don t all softwares create the same result? Equidistant points 9.7 Duplicate points Zeros or Nulls


 Option 1: from the home page Option")
44 Analysis and Geoprocessing Resource Center resources.arcgis.com - (This is the home page. From here, navigate to the Analysis community page.) Option 1: from the home page Option 2: click Communities to get a list of all resource centers


45 Important features of the Analysis Resource Center Quick Links: - Education Gallery: you can find User Conference presentations here - About the tool gallery: learn all about the new gallery of geoprocessing tools and analysis hosted on ArcGIS Online Gallery: - A sample of entries in the tool gallery - Click More Gallery posts to see all the entries
46 Steps to evaluate UC sessions My UC Homepage > Evaluate Sessions Choose session from planner OR Search for session
47 Thank you for attending Have fun at UC2012 Open for Questions Please fill out the evaluation: Session ID: xxx
48 ArcGIS Spatial Analyst Technical Sessions An Introduction - Rm 15B Tuesday, July 24, 8:30AM 9:45AM Wed, July 25, 1:30PM 2:45PM Suitability Modeling - Rm 15A Tuesday, July 24, 10:15AM 11:30AM Thursday, July 26, 3:15PM 4:30PM Raster Analysis with Python Ball06 E Tuesday, July 23, 3:15PM 4:30PM Thursday, July 25, 3:15PM 4:30PM Creating Surfaces Rm 15A Wednesday, July 25, 8:30PM 9:45PM

49 Steps to evaluate UC sessions My UC Homepage > Evaluate Sessions Choose session from planner OR Search for session
50 Thank you for attending Have fun at UC2012 Open for Questions Please fill out the evaluation: First Offering ID: XXXX Second Offering ID: XXXX


51
Creating Surfaces. Steve Kopp Steve Lynch
 Steve Kopp Steve Lynch Overview Learn the types of surfaces and the data structures used to store them Emphasis on surface interpolation Learn the interpolation workflow Understand how interpolators work
Getting Started with Spatial Analyst. Steve Kopp Elizabeth Graham
 Getting Started with Spatial Analyst Steve Kopp Elizabeth Graham Spatial Analyst Overview Over 100 geoprocessing tools plus raster functions Raster and vector analysis Construct workflows with ModelBuilder,
Getting Started with Spatial Analyst. Steve Kopp Elizabeth Graham
 Getting Started with Spatial Analyst Steve Kopp Elizabeth Graham Workshop Overview Fundamentals of using Spatial Analyst What analysis capabilities exist and where to find them How to build a simple site
Lesson 5 overview. Concepts. Interpolators. Assessing accuracy Exercise 5
 Interpolation Tools Lesson 5 overview Concepts Sampling methods Creating continuous surfaces Interpolation Density surfaces in GIS Interpolators IDW, Spline,Trend, Kriging,Natural neighbors TopoToRaster
Surface Creation & Analysis with 3D Analyst
 Esri International User Conference July 23 27 San Diego Convention Center Surface Creation & Analysis with 3D Analyst Khalid Duri Surface Basics Defining the surface Representation of any continuous measurement
Surface Analysis with 3D Analyst
 2013 Esri International User Conference July 8 12, 2013 San Diego, California Technical Workshop Surface Analysis with 3D Analyst Khalid H. Duri Esri UC2013. Technical Workshop. Why use 3D GIS? Because
Python - Raster Analysis
 Esri International User Conference San Diego, California Technical Workshops July 2012 Python - Raster Analysis Kevin M. Johnston Ryan DeBruyn The problem that is being addressed You have a complex modeling
Designing and Using Cached Map Services
 Esri International User Conference San Diego, California Technical Workshops July 2012 Designing and Using Cached Map Services Sterling Quinn Eric Rodenberg What we will cover Session Topics - Map cache
Introduction to 3D Analysis. Jinwu Ma Jie Chang Khalid Duri
 Introduction to 3D Analysis Jinwu Ma Jie Chang Khalid Duri Area & Volume 3D Analyst Features Detect Change Determine Cut/Fill Calculate Surface Area & Volume Data Management Data Creation Data Conversion
Esri International User Conference. July San Diego Convention Center. Lidar Solutions. Clayton Crawford
 Esri International User Conference July 23 27 San Diego Convention Center Lidar Solutions Clayton Crawford Outline Data structures, tools, and workflows Assessing lidar point coverage and sample density
Spatial Interpolation & Geostatistics
 (Z i Z j ) 2 / 2 Spatial Interpolation & Geostatistics Lag Lag Mean Distance between pairs of points 1 Tobler s Law All places are related, but nearby places are related more than distant places Corollary:
Spatial Interpolation - Geostatistics 4/3/2018
 Spatial Interpolation - Geostatistics 4/3/201 (Z i Z j ) 2 / 2 Spatial Interpolation & Geostatistics Lag Distance between pairs of points Lag Mean Tobler s Law All places are related, but nearby places
Network Analyst: Performing Network Analysis
 Esri International User Conference San Diego, California Technical Workshops July 24, 2012 Network Analyst: Performing Network Analysis Jay Sandhu Deelesh Mandloi Goals We assume you have some familiarity
Python Raster Analysis
 2013 Esri International User Conference July 8 12, 2013 San Diego, California Technical Workshop Python Raster Analysis Kevin M. Johnston Ryan DeBruyn Nawajish Noman Esri UC2013. Technical Workshop. The
What can we represent as a Surface?
 Geography 38/42:376 GIS II Topic 7: Surface Representation and Analysis (Chang: Chapters 13 & 15) DeMers: Chapter 10 What can we represent as a Surface? Surfaces can be used to represent: Continuously
Watershed Sciences 4930 & 6920 GEOGRAPHIC INFORMATION SYSTEMS
 HOUSEKEEPING Watershed Sciences 4930 & 6920 GEOGRAPHIC INFORMATION SYSTEMS Quizzes Lab 8? WEEK EIGHT Lecture INTERPOLATION & SPATIAL ESTIMATION Joe Wheaton READING FOR TODAY WHAT CAN WE COLLECT AT POINTS?
Statistical surfaces and interpolation. This is lecture ten
 Statistical surfaces and interpolation This is lecture ten Data models for representation of surfaces So far have considered field and object data models (represented by raster and vector data structures).
PUG List. Raster Analysis 3D Analysis Geoprocessing. Steve Kopp
 PUG List Raster Analysis 3D Analysis Geoprocessing Steve Kopp Contour Polygons Spatial Analyst - color-filled contours. Similar to thematic classification, where blue = -1000 to zero, and red = 0 to +1000,
GEOGRAPHIC INFORMATION SYSTEMS Lecture 24: Spatial Analyst Continued
 GEOGRAPHIC INFORMATION SYSTEMS Lecture 24: Spatial Analyst Continued Spatial Analyst - Spatial Analyst is an ArcGIS extension designed to work with raster data - in lecture I went through a series of demonstrations
Spatial Interpolation & Geostatistics
 (Z i Z j ) 2 / 2 Spatial Interpolation & Geostatistics Lag Lag Mean Distance between pairs of points 11/3/2016 GEO327G/386G, UT Austin 1 Tobler s Law All places are related, but nearby places are related
Cell based GIS. Introduction to rasters
 Week 9 Cell based GIS Introduction to rasters topics of the week Spatial Problems Modeling Raster basics Application functions Analysis environment, the mask Application functions Spatial Analyst in ArcGIS
Geol 588. GIS for Geoscientists II. Zonal functions. Feb 22, Zonal statistics. Interpolation. Zonal statistics Sp. Analyst Tools - Zonal.
 Zonal functions Geol 588 GIS for Geoscientists II Feb 22, 2011 Zonal statistics Interpolation Zonal statistics Sp. Analyst Tools - Zonal Choose correct attribute for zones (usually: must be unique ID for
Spatial Analysis (Vector) II
 II") Spatial Analysis (Vector) II GEOG 300, Lecture 9 Dr. Anthony Jjumba 1 A Spatial Network is a set of geographic locations interconnected in a system by a number of routes is a system of linear features
Spatial Analysis (Vector) II GEOG 300, Lecture 9 Dr. Anthony Jjumba 1 A Spatial Network is a set of geographic locations interconnected in a system by a number of routes is a system of linear features
Lecture 9. Raster Data Analysis. Tomislav Sapic GIS Technologist Faculty of Natural Resources Management Lakehead University
 Lecture 9 Raster Data Analysis Tomislav Sapic GIS Technologist Faculty of Natural Resources Management Lakehead University Raster Data Model The GIS raster data model represents datasets in which square
Esri Production Mapping An Introduction
 Esri International User Conference San Diego, California Technical Workshops July 25, 2012 Esri Production Mapping An Introduction Lana Tylka Amber Bethell Workshop Overview Part I - Industry challenges
Creating raster DEMs and DSMs from large lidar point collections. Summary. Coming up with a plan. Using the Point To Raster geoprocessing tool
 Page 1 of 5 Creating raster DEMs and DSMs from large lidar point collections ArcGIS 10 Summary Raster, or gridded, elevation models are one of the most common GIS data types. They can be used in many ways
GIS Tools - Geometry. A GIS stores data as different layers of information Different feature types are stored in individual files.
 A Definition of GIS GIS is a system of hardware, software, and procedures designed to support the capture, management, manipulation, analysis, modeling and display of spatially referenced data for solving
ArcMap: Tips and Tricks
 Esri International User Conference San Diego, California Technical Workshops July 23 27, 2012 ArcMap: Tips and Tricks Miriam Schmidts Jorge Ruiz-Valdepena Agenda Navigating ArcMap Repairing data links
Geographic Information Systems (GIS) Spatial Analyst [10] Dr. Mohammad N. Almasri. [10] Spring 2018 GIS Dr. Mohammad N. Almasri Spatial Analyst
![Geographic Information Systems (GIS) Spatial Analyst [10] Dr. Mohammad N. Almasri. [10] Spring 2018 GIS Dr. Mohammad N. Almasri Spatial Analyst](/thumbs/80/81171101.jpg "Geographic Information Systems (GIS) Spatial Analyst [10] Dr. Mohammad N. Almasri. [10] Spring 2018 GIS Dr. Mohammad N. Almasri Spatial Analyst") Geographic Information Systems (GIS) Spatial Analyst [10] Dr. Mohammad N. Almasri 1 Preface POINTS, LINES, and POLYGONS are good at representing geographic objects with distinct shapes They are less good
Geographic Information Systems (GIS) Spatial Analyst [10] Dr. Mohammad N. Almasri 1 Preface POINTS, LINES, and POLYGONS are good at representing geographic objects with distinct shapes They are less good
Contents of Lecture. Surface (Terrain) Data Models. Terrain Surface Representation. Sampling in Surface Model DEM
 Data Models. Terrain Surface Representation. Sampling in Surface Model DEM") Lecture 13: Advanced Data Models: Terrain mapping and Analysis Contents of Lecture Surface Data Models DEM GRID Model TIN Model Visibility Analysis Geography 373 Spring, 2006 Changjoo Kim 11/29/2006 1
Lecture 13: Advanced Data Models: Terrain mapping and Analysis Contents of Lecture Surface Data Models DEM GRID Model TIN Model Visibility Analysis Geography 373 Spring, 2006 Changjoo Kim 11/29/2006 1
Lidar Working with LAS Datasets
 2013 Esri International User Conference July 8 12, 2013 San Diego, California Technical Workshop Lidar Working with LAS Datasets Raghav Vemula (3D Team) Esri UC2013. Technical Workshop. Agenda Las Dataset
Spatial Analysis and Modeling (GIST 4302/5302) Guofeng Cao Department of Geosciences Texas Tech University
 Guofeng Cao Department of Geosciences Texas Tech University") Spatial Analysis and Modeling (GIST 4302/5302) Guofeng Cao Department of Geosciences Texas Tech University 1 Outline of This Week Last topic, we learned: Spatial autocorrelation of areal data Spatial regression
Spatial Analysis and Modeling (GIST 4302/5302) Guofeng Cao Department of Geosciences Texas Tech University 1 Outline of This Week Last topic, we learned: Spatial autocorrelation of areal data Spatial regression
ArcMap Tips and Tricks
 2013 Esri International User Conference July 8 12, 2013 San Diego, California Technical Workshop ArcMap Tips and Tricks Jack Horton Jorge Ruiz-Valdepeña Esri UC2013. Technical Workshop. Jorge s Agenda
Accuracy, Support, and Interoperability. Michael F. Goodchild University of California Santa Barbara
 Accuracy, Support, and Interoperability Michael F. Goodchild University of California Santa Barbara The traditional view Every object has a true position and set of attributes with enough time and resources
ArcGIS Spatial Analyst Suitability Modeling
 2013 Esri International User Conference July 8 12, 2013 San Diego, California Technical Workshop ArcGIS Spatial Analyst Suitability Modeling Kevin M. Johnston Elizabeth Graham Esri UC2013. Technical Workshop.
What s New in Desktop 10.1
 What s New in Desktop 10.1 Damian Spangrud Esri Redlands Trip Down Memory Lane ArcGIS A Complete System for Geographic Information Cloud Web Online Mobile Enterprise Desktop Sharing Information sharing
Geographic Surfaces. David Tenenbaum EEOS 383 UMass Boston
 Geographic Surfaces Up to this point, we have talked about spatial data models that operate in two dimensions How about the rd dimension? Surface the continuous variation in space of a third dimension
Delineating Watersheds from a Digital Elevation Model (DEM)
") Delineating Watersheds from a Digital Elevation Model (DEM) (Using example from the ESRI virtual campus found at http://training.esri.com/courses/natres/index.cfm?c=153) Download locations for additional
Delineating Watersheds from a Digital Elevation Model (DEM) (Using example from the ESRI virtual campus found at http://training.esri.com/courses/natres/index.cfm?c=153) Download locations for additional
Working with Metadata in ArcGIS
 Esri International User Conference San Diego, California Technical Workshops July 26, 2012 Working with Metadata in ArcGIS Aleta Vienneau Metadata in ArcGIS ArcGIS metadata goals Editing metadata Setting
Lecture 6: GIS Spatial Analysis. GE 118: INTRODUCTION TO GIS Engr. Meriam M. Santillan Caraga State University
 Lecture 6: GIS Spatial Analysis GE 118: INTRODUCTION TO GIS Engr. Meriam M. Santillan Caraga State University 1 Spatial Data It can be most simply defined as information that describes the distribution
Report: Comparison of Methods to Produce Digital Terrain Models
 Report: Comparison of Methods to Produce Digital Terrain Models Evan J Fedorko West Virginia GIS Technical Center 27 April 2005 Introduction This report compares Digital Terrain Models (DTM) created through
ArcGIS Enterprise Building Raster Analytics Workflows. Mike Muller, Jie Zhang
 ArcGIS Enterprise Building Raster Analytics Workflows Mike Muller, Jie Zhang Introduction and Context Raster Analytics What is Raster Analytics? The ArcGIS way to create and execute spatial analysis models
Your Prioritized List. Priority 1 Faulted gridding and contouring. Priority 2 Geoprocessing. Priority 3 Raster format
 Your Prioritized List Priority 1 Faulted gridding and contouring Priority 2 Geoprocessing Priority 3 Raster format Priority 4 Raster Catalogs and SDE Priority 5 Expanded 3D Functionality Priority 1 Faulted
An Introduction to Using Lidar with ArcGIS and 3D Analyst
 FedGIS Conference February 24 25, 2016 Washington, DC An Introduction to Using Lidar with ArcGIS and 3D Analyst Jim Michel Outline Lidar Intro Lidar Management Las files Laz, zlas, conversion tools Las
Image Services for Elevation Data
 Image Services for Elevation Data Peter Becker Need for Elevation Using Image Services for Elevation Data sources Creating Elevation Service Requirement: GIS and Imagery, Integrated and Accessible Field
Raster Data. James Frew ESM 263 Winter
 Raster Data 1 Vector Data Review discrete objects geometry = points by themselves connected lines closed polygons attributes linked to feature ID explicit location every point has coordinates 2 Fields
Lidar and GIS: Applications and Examples. Dan Hedges Clayton Crawford
 Lidar and GIS: Applications and Examples Dan Hedges Clayton Crawford Outline Data structures, tools, and workflows Assessing lidar point coverage and sample density Creating raster DEMs and DSMs Data area
Gridding and Contouring in Geochemistry for ArcGIS
 Gridding and Contouring in Geochemistry for ArcGIS The Geochemsitry for ArcGIS extension includes three gridding options: Minimum Curvature Gridding, Kriging and a new Inverse Distance Weighting algorithm.
Lab 12: Sampling and Interpolation
 Lab 12: Sampling and Interpolation What You ll Learn: -Systematic and random sampling -Majority filtering -Stratified sampling -A few basic interpolation methods Data for the exercise are found in the
INTRODUCTION TO GIS WORKSHOP EXERCISE
 111 Mulford Hall, College of Natural Resources, UC Berkeley (510) 643-4539 INTRODUCTION TO GIS WORKSHOP EXERCISE This exercise is a survey of some GIS and spatial analysis tools for ecological and natural
An Introduction to Data Interoperability
 Esri International User Conference San Diego, California 2012 Technical Workshops July 24/25 An Introduction to Data Interoperability Bruce Harold - Esri Dale Lutz Safe Software Background Why Data Interoperability?
ArcGIS 10.1 for Desktop Artie Robinson
 ArcGIS 10.1 for Desktop Artie Robinson ArcGIS A Complete System for Geographic Information Cloud Web Online Mobile Enterprise Desktop Name Change Name Prior to 10.1 ArcGIS Desktop ArcInfo ArcEditor ArcView
Introduction to the Image Analyst Extension. Mike Muller, Vinay Viswambharan
 Introduction to the Image Analyst Extension Mike Muller, Vinay Viswambharan What is the Image Analyst Extension? The Image Analyst Extension (IA) is an application extension which extends ArcGIS Pro with
IMPROVING THE ACCURACY OF DIGITAL TERRAIN MODELS
 STUDIA UNIV. BABEŞ BOLYAI, INFORMATICA, Volume XLV, Number 1, 2000 IMPROVING THE ACCURACY OF DIGITAL TERRAIN MODELS GABRIELA DROJ Abstract. The change from paper maps to GIS, in various kinds of geographical
University of West Hungary, Faculty of Geoinformatics. Béla Márkus. Spatial Analysis 5. module SAN5. 3D analysis
 University of West Hungary, Faculty of Geoinformatics Béla Márkus Spatial Analysis 5. module SAN5 3D analysis SZÉKESFEHÉRVÁR 2010 The right to this intellectual property is protected by the 1999/LXXVI
Esri Maps for SharePoint
 Esri International User Conference San Diego, California Technical Workshops July, 2012 Esri Maps for SharePoint Art Haddad Nathan Bennett Agenda Location Analytics - Esri Maps for SharePoint - Overview
Using Imagery for Intelligence Analysis
 2013 Esri International User Conference July 8 12, 2013 San Diego, California Technical Workshop Using Imagery for Intelligence Analysis Renee Bernstein Natalie Campos Esri UC2013. Technical Workshop.
hereby recognizes that Timotej Verbovsek has successfully completed the web course 3D Analysis of Surfaces and Features Using ArcGIS 10
 3D Analysis of Surfaces and Features Using ArcGIS 10 Completed on September 5, 2012 3D Visualization Techniques Using ArcGIS 10 Completed on November 19, 2011 Basics of Map Projections (for ArcGIS 10)
Network Analyst: An Introduction
 2013 Esri International User Conference July 8 12, 2013 San Diego, California Technical Workshop Network Analyst: An Introduction Patrick Stevens Robert Garrity Esri UC2013. Technical Workshop. Introduction
Copyright The McGraw-Hill Companies, Inc. Permission required for reproduction or display.
 Chapter 13. TERRAIN MAPPING AND ANALYSIS 13.1 Data for Terrain Mapping and Analysis 13.1.1 DEM 13.1.2 TIN Box 13.1 Terrain Data Format 13.2 Terrain Mapping 13.2.1 Contouring 13.2.2 Vertical Profiling 13.2.3
Surface Analysis. Data for Surface Analysis. What are Surfaces 4/22/2010
 Surface Analysis Cornell University Data for Surface Analysis Vector Triangulated Irregular Networks (TIN) a surface layer where space is partitioned into a set of non-overlapping triangles Attribute and
Steps for Modeling a Proposed New Reservoir in GIS
 Steps for Modeling a Proposed New Reservoir in GIS Requirements: ArcGIS ArcMap, ArcScene, Spatial Analyst, and 3D Analyst There s a new reservoir proposed for Right Hand Fork in Logan Canyon. I wanted
Geoprocessing and georeferencing raster data
 Geoprocessing and georeferencing raster data Raster conversion tools Geoprocessing tools ArcCatalog tools ESRI Grid GDB Raster Raster Dataset Raster Catalog Erdas IMAGINE TIFF ArcMap - raster projection
GEOGRAPHIC INFORMATION SYSTEMS Lecture 18: Spatial Modeling
 Spatial Analysis in GIS (cont d) GEOGRAPHIC INFORMATION SYSTEMS Lecture 18: Spatial Modeling - the basic types of analysis that can be accomplished with a GIS are outlined in The Esri Guide to GIS Analysis
Python Raster Analysis. Kevin M. Johnston Nawajish Noman
 Python Raster Analysis Kevin M. Johnston Nawajish Noman Outline Managing rasters and performing analysis with Map Algebra How to access the analysis capability - Demonstration Complex expressions and optimization
Lab 12: Sampling and Interpolation
 Lab 12: Sampling and Interpolation What You ll Learn: -Systematic and random sampling -Majority filtering -Stratified sampling -A few basic interpolation methods Videos that show how to copy/paste data
Masking Lidar Cliff-Edge Artifacts
 Masking Lidar Cliff-Edge Artifacts Methods 6/12/2014 Authors: Abigail Schaaf is a Remote Sensing Specialist at RedCastle Resources, Inc., working on site at the Remote Sensing Applications Center in Salt
Topology in the Geodatabase an Introduction. Erik Hoel Doug Morgenthaler
 Topology in the Geodatabase an Introduction Erik Hoel Doug Morgenthaler ESRI Super Secret Topology Laboratory, May 2012 Agenda ArcGIS Topology defined Validating a topology Editing a topology Geoprocessing
Representing Geography
 Data models and axioms Chapters 3 and 7 Representing Geography Road map Representing the real world Conceptual models: objects vs fields Implementation models: vector vs raster Vector topological model
GEOGRAPHIC INFORMATION SYSTEMS Lecture 25: 3D Analyst
 GEOGRAPHIC INFORMATION SYSTEMS Lecture 25: 3D Analyst 3D Analyst - 3D Analyst is an ArcGIS extension designed to work with TIN data (triangulated irregular network) - many of the tools in 3D Analyst also
Creating Geoprocessing Services and Web Tools. Darren Baird, PE, Esri
 Creating Geoprocessing Services and Web Tools Darren Baird, PE, Esri Introduction Both ArcMap and ArcGIS Pro are covered Terms Geoprocessing Services and Web Tools are the same - ArcMap publishes geoprocessing
Geographical Information System (Dam and Watershed Analysis)
") Geographical Information System (Dam and Watershed Analysis) Kumar Digvijay Singh 02D05012 Under Guidance of Prof. Milind Sohoni Outline o Watershed delineation o Sinks, flat areas, flow direction, delineation
Geographical Information System (Dam and Watershed Analysis) Kumar Digvijay Singh 02D05012 Under Guidance of Prof. Milind Sohoni Outline o Watershed delineation o Sinks, flat areas, flow direction, delineation
GEOGRAPHIC INFORMATION SYSTEMS Lecture 02: Feature Types and Data Models
 GEOGRAPHIC INFORMATION SYSTEMS Lecture 02: Feature Types and Data Models Feature Types and Data Models How Does a GIS Work? - a GIS operates on the premise that all of the features in the real world can
Practical II ArcGIS (10.0) for IWCM
 for IWCM") Author: A.Priki Practical II ArcGIS (10.0) for IWCM AIM: In this workshop we will introduce some of the most commonly used ArcGIS functionalities for Integrated Water Cycle Management. You will get a chance
Author: A.Priki Practical II ArcGIS (10.0) for IWCM AIM: In this workshop we will introduce some of the most commonly used ArcGIS functionalities for Integrated Water Cycle Management. You will get a chance
Thoughts on Representing Spatial Objects. William A. Huber Quantitative Decisions Rosemont, PA
 Thoughts on Representing Spatial Objects William A. Huber Quantitative Decisions Rosemont, PA Overview 1. Some Ways to Structure Space 2. What to Put into a Grid 3. Objects and Fields 4. Hybrid Structures
Python Raster Analysis. Kevin M. Johnston Nawajish Noman
 Python Raster Analysis Kevin M. Johnston Nawajish Noman Outline Managing rasters and performing analysis with Map Algebra How to access the analysis capability - Demonstration Complex expressions and optimization
L7 Raster Algorithms
 L7 Raster Algorithms NGEN6(TEK23) Algorithms in Geographical Information Systems by: Abdulghani Hasan, updated Nov 216 by Per-Ola Olsson Background Store and analyze the geographic information: Raster
Exercise 5. Height above Nearest Drainage Flood Inundation Analysis
 Exercise 5. Height above Nearest Drainage Flood Inundation Analysis GIS in Water Resources, Fall 2018 Prepared by David G Tarboton Purpose The purpose of this exercise is to learn how to calculation the
ArcGIS Viewer for Flex Advanced Topics
 Esri International User Conference San Diego, California Technical Workshops July 27, 2012 ArcGIS Viewer for Flex Advanced Topics Lloyd Heberlie Björn Svensson Before we begin Who are we? - Bjorn Svensson
Network Analysis with ArcGIS Online and On-premise Services
 2013 Esri International User Conference July 8 12, 2013 San Diego, California Technical Workshop Network Analysis with ArcGIS Online and On-premise Services Deelesh Mandloi Dmitry Kudinov Esri UC2013.
The 3D Analyst extension extends ArcGIS to support surface modeling and 3- dimensional visualization. 3D Shape Files
 NRM 435 Spring 2016 ArcGIS 3D Analyst Page#1 of 9 0B3D Analyst Extension The 3D Analyst extension extends ArcGIS to support surface modeling and 3- dimensional visualization. 3D Shape Files Analogous to
Building Applications with the ArcGIS Runtime SDK for WPF
 Esri International User Conference San Diego, California Technical Workshops 24 th July 2012 Building Applications with the ArcGIS Runtime SDK for WPF Euan Cameron & Paul Pilkington Agenda Introduction
Lab 12: Sampling and Interpolation
 Lab 12: Sampling and Interpolation What You ll Learn: -Systematic and random sampling -Majority filtering -Stratified sampling -A few basic interpolation methods Data for the exercise are in the L12 subdirectory.
Managing Imagery and Raster Data Using Mosaic Datasets
 2013 Esri International User Conference July 8 12, 2013 San Diego, California Technical Workshop Managing Imagery and Raster Data Using Mosaic Datasets Hong Xu, Prashant Mangtani Esri UC2013. Technical
Publishing image services in ArcGIS
 Esri International User Conference San Diego, California Technical Workshops July 26, 2012 Publishing image services in ArcGIS Wenxue Ju & Melanie Harlow What is an image service? A way to make image and
Tips for a Good Meshing Experience
 Tips for a Good Meshing Experience Meshes are very powerful and flexible for modeling 2D overland flows in a complex urban environment. However, complex geometries can be frustrating for many modelers
Geostatistics Predictions with Deterministic Procedures
 Instituto Superior de Estatística e Gestão de Informação Universidade Nova de Lisboa Master of Science in Geospatial Technologies Geostatistics Predictions with Deterministic Procedures Carlos Alberto
GIS Tools for Hydrology and Hydraulics
 1 OUTLINE GIS Tools for Hydrology and Hydraulics INTRODUCTION Good afternoon! Welcome and thanks for coming. I once heard GIS described as a high-end Swiss Army knife: lots of tools in one little package
Network Analyst Creating Network Datasets
 2013 Esri International User Conference July 8 12, 2013 San Diego, California Technical Workshop Network Analyst Creating Network Datasets Colin Childs Alan Hatakeyama Esri UC2013. Technical Workshop.
Caching Imagery Using ArcGIS
 2013 Esri International User Conference July 8 12, 2013 San Diego, California Technical Workshop Caching Imagery Using ArcGIS Hong Xu, Hua Wei Esri UC2013. Technical Workshop. Presentation Goals Publish
An Introduction to Dynamic Simulation Modeling
 Esri International User Conference San Diego, CA Technical Workshops ****************** An Introduction to Dynamic Simulation Modeling Kevin M. Johnston Shitij Mehta Outline Model types - Descriptive versus
Working With Raster Data Using Python. Nawajish Noman Ryan DeBruyn
 Working With Raster Data Using Python Nawajish Noman Ryan DeBruyn Outline Managing rasters with tools and performing analysis with Map Algebra How to access the analysis capability - Demonstration Complex
ArcGIS Viewer for Silverlight Advanced Topics
 Esri International User Conference San Diego, California Technical Workshops July 26, 2012 ArcGIS Viewer for Silverlight Advanced Topics Rich Zwaap Agenda Add-ins overview Tools Behaviors Controls Layouts
Python: Working with Raster Data
 Esri Developer Summit March 8 11, 2016 Palm Springs, CA Python: Working with Raster Data Nawajish Noman Elizabeth Graham Outline Managing rasters with tools and performing analysis with Map Algebra How
Lab 11: Terrain Analyses
 Lab 11: Terrain Analyses What You ll Learn: Basic terrain analysis functions, including watershed, viewshed, and profile processing. There is a mix of old and new functions used in this lab. We ll explain
ArcGIS Pro Editing: An Introduction. Jennifer Cadkin & Phil Sanchez
 ArcGIS Pro Editing: An Introduction Jennifer Cadkin & Phil Sanchez See Us Here WORKSHOP ArcGIS Pro Editing: An Introduction LOCATION SDCC - Ballroom 20 D TIME FRAME Thursday 10:00 11:00 ArcGIS Pro: 3D
Dijkstra's Algorithm
 Shortest Path Algorithm Dijkstra's Algorithm To find the shortest path from the origin node to the destination node No matrix calculation Floyd s Algorithm To find all the shortest paths from the nodes
Esri UC2013. Technical Workshop. Type Presentation Name Here
 Type Presentation Name Here 2013 Esri International User Conference July 8 12, 2013 San Diego, California Technical Workshop 3D Analyst An Introduction Deepinder Deol Michael Contreras Why use 3D GIS?
Tools, Tips, and Workflows Exporting Final Product LP360
 LP360 Support Revision 1.0 l Final products can be exported from LIDAR data using either LP360 command line executables or the LP360 Export Wizard. Some export functions and resulting products include,
Geostatistics 2D GMS 7.0 TUTORIALS. 1 Introduction. 1.1 Contents
 GMS 7.0 TUTORIALS 1 Introduction Two-dimensional geostatistics (interpolation) can be performed in GMS using the 2D Scatter Point module. The module is used to interpolate from sets of 2D scatter points