Impact Evaluation of the 2012 Rooftop Unit Tune-up Initiative
|
|
|
- Augustine Collins
- 6 years ago
- Views:
Transcription

1 Impact Evaluation of the 2012 Rooftop Unit Tune-up Initiative October 21, 2014 Energy Trust of Oregon 421 SW Oak Street, Suite 300 Portland, OR 97204
2 This page left blank.
3 Prepared by: John Walczyk Cadmus
4 This page left blank.
5 MEMO Date: April 9, 2015 To: Board of Directors From: Spencer Moersfelder, Business Sector Senior Program Manager Dan Rubado, Evaluation Project Manager Subject: Staff Response to Impact Evaluation of the 2012 Rooftop Unit Tune-up Initiative This impact evaluation documents the results of Energy Trust s rooftop unit (RTU) tune-up initiative, which was run by Energy Trust s Existing Buildings program from 2010 through The evaluation was commissioned in response to a billing analysis that showed much lower than expected savings. This evaluation report establishes that 2012 RTU tune-up savings were very low and documents many of the reasons for those low savings. An initial study in 2009 and a pilot period in 2010 demonstrated that the first tier of participating service providers were capable of following the tune-up protocol. However, the initiative was expanded to include more service providers and the number of QC touch points was reduced in order to manage the delivery budget. The evaluation results demonstrated that the expanded base of service providers did not adequately follow the tune-up protocol. Furthermore, the evaluation demonstrated that planning analysis that was used to design the initiative overestimated the savings that could be achieved from rooftop unit tune-ups even if the service providers were able to tune-up the units effectively each time. A convergence of less savings potential than was originally assumed and subpar execution of the tune-up protocol in the market resulted in low realization rates. RTUs still represent an extremely important opportunity for the program because they condition over half of the commercial floor space in the Northwest and are often poorly maintained or not well controlled. Even though this initiative was not ultimately successful, Energy Trust continues to look for solutions to address the inefficient stock of RTUs in some manner. This evaluation provides many lessons and recommendations about what the program could do differently to implement a tune-up initiative more effectively. Any new initiative must directly address the past implementation problems documented in this report. However, the nature of the service provider market presents significant barriers to design and implement a service protocol that can reliably achieve savings in this space. The Existing Buildings program is currently using the findings in this report to consider new capital and operations-based measures that can achieve the energy savings potential from existing RTUs.
6 Table of Contents Executive Summary... 2 Introduction... 5 Evaluation Methodology... 7 Program Tracking Database Review and Sampling... 7 Review of Project Documents Contractor Interviews RTU Metering and Savings Analysis Methodology Findings Findings: Document Review Findings: Contractor Interviews Firmographics Perspectives about the Program Suggestions for Program Improvement Tune-Up Measures RTUs in the Region Findings: Qualitative Field Observations Routine Maintenance Practices Observed Tune-Up Measures and Economizer Control Findings: Meter Data Analysis Heating Savings Cooling Savings Conclusions and Recommendations Appendix A. RTU Results by Unit Appendix B. RTU Meters Installed
7 Executive Summary In February 2014, Energy Trust of Oregon contracted with Cadmus to conduct a detailed impact evaluation and research study of its 2012 Rooftop Unit (RTU) Tune-Up Initiative. Between March and November 2014, Cadmus worked to complete this study. The main research objectives of the impact evaluation were to update the gross savings estimates, determine why actual savings were different from estimated savings, and to recommend strategies for a new tune-up initiative. This report describes the tune-up initiative (the program), methods, results, and the evaluation team s recommendations for future tune-up initiatives. To evaluate results, Cadmus (the evaluation team) used post-tune-up submeter data from 41 randomly sampled RTUs. The team also relied on secondary research from the Northwest to develop three typical baseline scenarios to estimate savings. Table 1 provides a summary of the cooling and heating savings and realization rates determined by Cadmus. Table 1. Heating and Cooling Savings Summary Savings Reported Evaluated Realization Rate Relative 90% Confidence Cooling (kwh) 4,889,403 1,249, % 41.0% Heating (therms) 659, , % 27.1% The evaluation team found tune-up savings were lower than expected because for some RTUs: Tune-up measures were not correctly installed; Economizers were not functional; Tune-up measures may have been disabled; Heating and cooling demand was low so energy savings potential was low; and The fan ran in auto mode rather than continuous mode The evaluation team offers several key conclusions and recommendations. We developed many of these conclusions and recommendations with the understanding that Energy Trust may fund a new RTU tuneup initiative. Key Conclusion 1: The quality and skill of contractors installing measures is critical to success. Existing economizer controls are relatively straightforward on some HVAC systems and very complex on some HVAC systems. Several contractors explained that they witnessed a number of inexperienced HVAC technicians performing measures for the tune-up initiative. The evaluation found some significant 2
8 differences in savings of the RTUs metered. Through analysis of meter data, field observations, conversations with contractors, and our knowledge of similar tune-up programs, we conclude that experienced contractors are necessary for this type of program to succeed. Key Recommendation 1: Provide or require economizer/rtu controls training. Many HVAC manufacturers (e.g. Carrier, Trane) offer training courses for RTUs, with specific courses focusing on economizer training. If the program requires each individual technician to provide proof of training, or if the program mandates training as an initial program entry requirement, the implementation team will ensure contractors have access to the skills needed for successful measure implementation. Key Conclusion 2: A change to the program QC requirements could improve contractor performance and could serve as an opportunity to provide baseline information. The evaluation team has evaluated various types of tune-up programs in many different regions of the country. We consistently find that if unchecked, a large portion of contractors will fail to perform the work intended by the design of the program. If technicians understand that the QC process will include actual fault diagnosis and if they expect consequences (e.g. loss of part of incentive, withholding payment) when the measurement and verification (M&V) contractor discovers an issue, then they will either choose not to participate or will perform work that aligns with the expectations of the program. Key Recommendation 2: Randomly verify the work of the individual technician. In our experience the most successful tune-up programs first qualify each individual HVAC technician performing the work with a high level of rigor. This is the qualifying step, usually conducted by a program implementer or M&V contractor. Once qualified, the implementation team randomly inspects their work through standard M&V random sampling (e.g. 3-5% of all installations). Key Conclusion 3: Many RTUs had tune-up measure installation issues, including some RTUs receiving field QC from the implementation contractor. Some RTUs are relatively simple and a visual inspection by a field verification contractor to confirm proper installation may prove sufficient. Conversely, some RTU economizer controllers are very complicated and field verification through visual inspection proves challenging or impossible. Even though some RTUs received field verification, we found evidence to suggest that economizers were never functioning correctly. Through detailed meter data analysis we discovered various issues that were difficult to detect through visual inspection or even through basic economizer functional testing. Key Recommendation 3a: Modify the QC protocol to physically test the economizer operation. The industry has provided various initiatives and guidelines specific to economizer fault diagnostics and economizer improvement but none of these initiatives provide detailed guidance for functional testing from single point-in-time field M&V. There are several techniques one might employ to functionally test an economizer and the measures performed through a tune-up program. We provide examples and details in the conclusions and recommendations section. 3
9 Recommendation 3b: Consider alternate economizer controller technologies. Some RTU controller retrofit devices can reduce or eliminate the need for field verification but these measures might be more than three times the cost of the 2012 tune-up initiative measures. Before attempting to implement a new tune-up product, Energy Trust should investigate the cost-effectiveness of the measures and the probable reduction in participation caused by the more complex, relatively expensive alternatives. Key Conclusion 4: Older RTUs have significant savings potential and if targeted correctly, successful tune-up of these systems using best practice techniques could provide significant savings. According to several contractors, many of the RTUs in the Northwest receive limited maintenance because the tenants, not equipment owners, pay the utility bills. Equipment owners have little incentive to pay for routine maintenance that might help reduce energy cost for tenants. Tenants may either neglect their responsibilities or choose a minimal RTU maintenance plan. Consequently, many RTUs are wasting energy, will not receive adequate service, and will not soon be replaced. Though the program targeted RTUs receiving routine maintenance to ensure predictable savings, our evaluation indicated many of the RTUs receiving tune-up measures probably do not receive regular maintenance. Key Recommendation 4a: Perform targeted marketing to decision-makers who consider RTU maintenance a low priority. To better understand how best to reach out to decision-makers who might consider RTU maintenance a low priority (e.g. shopping malls), we recommend additional research through contractor interviews or focus groups. Recommendation 4b: Ensure contractors follow quality tune-up practices. The evaluation team was unable to diagnose refrigerant charge because conditions were too cold during site visits and meter installations. None of the 41 RTUs we inspected received refrigerant charge adjustment (according to contractor s documentation records) but contractors often performed tune-ups when refrigerant charge diagnosis isn t possible because outdoor conditions are too cold. Contractors even mentioned the program was great for the slow season meaning conditions are likely too cold to test refrigerant charge. Future program design should hold contractors to a higher standard of refrigerant charge diagnostic testing or should require M&V on all tune-ups performed during cold conditions. 4
10 Introduction Packaged rooftop HVAC units (RTUs) are ubiquitous in the Pacific Northwest on small to medium size commercial buildings. They are often poorly maintained, have mechanical issues, and do not properly regulate the intake of outside air. Through its Existing Buildings (EB) program, Energy Trust of Oregon began testing in 2009 to identify maintenance and upgrade activities that could achieve significant electrical and therm savings with RTUs. Through a pilot initiative in 2010, the maintenance and upgrade activities (measures) identified were implemented, savings were verified, mechanical contractors were trained, and QC procedures were established. Energy Trust s EB program implementer, Lockheed Martin, brought this tune-up initiative to scale in 2011 by substantially increasing the pool of qualified contractors. The program was designed to have qualified HVAC contractors drive participation. An incentive designed to cover the full cost of tune-up activities was paid directly to the contractor for each unit that was tuned-up. A requirement of the program was that all RTUs receiving measures have correct refrigerant charge and airflow and all RTUs required natural gas heat packs. Any participant site with four or more RTU tune-ups required a visual inspection (Quality Control) site visit by the implementation team. For RTUs 7 years or newer and 3-4 tons of mechanical cooling capacity, the program incented the installation of a new economizer, outside air drybulb sensor, demand-controlled ventilation (DCV) functionality, and programmable thermostat. For RTUs 5-20 tons and 10 years or newer with an existing economizer, the program incented measures to add DCV, repair the economizer if necessary, adjust economizer changeover temperature, and install a programmable thermostat when necessary. Table 2 provides a summary of tune-up measures from the pilot year to the 2012 program year. In 2012 the minimum RTU size was increased to 5 tons. The most common measure (94%) in 2012 was economizer repair or adjustment with installation of DCV and new thermostat not needed. Table 2. RTU Tune-up Activity by Year Claimed kwh Year Measures Sites Savings Claimed Therm Savings ,010, , , ,315, , , ,889, ,856 By 2012, RTU tune-ups accounted for 5% of the Existing Buildings claimed annual electric savings and 29% of its gas savings. Billing analysis of RTU tune-ups conducted in 2010 and 2011 showed much lowerthan-expected savings and consequently the tune-up initiative was discontinued in The billing analysis also showed that savings varied significantly by contractor, which necessitated a more in-depth investigation to substantiate the low savings results and determine the factors responsible. A complicating factor was that the program implementer changed from Lockheed Martin to ICF at the beginning of
11 Energy Trust of Oregon contracted with Cadmus to conduct a detailed impact evaluation and research study of its 2012 RTU Tune-Up Initiative. The main research objectives of the impact evaluation were to update the gross savings estimates, determine why actual savings were different from estimated savings, and to recommend strategies for a new tune-up initiative. To satisfy these objectives, Cadmus performed the following key activities: Reviewed program documentation and tracking information Installed meters on 41 RTUs at 30 different facilities from early April to mid-october 2014 and analyzed data Interviewed nine participating HVAC companies after completing a technical review of their reporting documents Conducted secondary research to understand the most probable baseline scenarios This report describes the evaluation methods, findings, and Cadmus recommendations for future implementation and evaluation of RTU tune-up programs. 6
12 Evaluation Methodology In this section we describe our evaluation activities and methodology used to estimate savings and to develop conclusions and recommendations for future implementation and evaluation of RTU tune-up programs. To evaluate the 2012 RTU Tune-Up Initiative, Cadmus conducted the following research activities: Review of program tracking database and sampling Review of project documents Contractor interviews Literature review and qualitative analysis to determine baseline 1 On-site inspections and installation of long-term metering equipment RTU meter data review and analysis Below we provide the details of each of these activities. Program Tracking Database Review and Sampling Cadmus reviewed the program tracking database which contained information we expected to either evaluate or verify in the field. The main goal of the review was to understand the parameters tracked and available for evaluation so that we could select a subset of sites and RTUs for the evaluation that reasonably represent the census of participants in We ultimately apply the savings realization rate of RTUs evaluated to the census of measures. Some of the key data in the tracking database are: Specific project and measure IDs and project document reference number RTU model number information and system size Building type (e.g. office, retail, etc) Location information Brief measure description Reported savings Contractor performing the measure installation Measure installation date After review of the tracking database which contains data on tune-ups performed on 1,971 RTUs located at 588 unique sites, Cadmus selected and reviewed a random sample of 56 sites. We reported the 1 Cadmus assessed all available information gathered from the tasks listed and then collaborated with Energy Trust because of concerns with the baseline information reported. Consequently, we added this additional activity. 7
13 sample to Energy Trust, which in turn gave the sample to ICF. ICF reviewed the list of sites and, where possible, provided site-specific feedback to help us recruit sites for this study. We designed this sample to produce savings estimates at a 90% confidence level with -10% precision at the program level (one-tailed) or at 80% confidence level with 20% precision (two-tailed) and having better than 20% precision at the same confidence level within each measure category and building stratum. Because incentives were paid directly to the contractors, we had some concern that the site decisionmaker might not have enough vested interest to agree to participate. In our experience recruiting participants for any energy-efficiency study, there is always concern that self-selection bias might occur. This bias occurs when the people who agree to participate in a study are different than those who refuse to participate in a way that is correlated with the study findings. Given both the difficulty of recruiting participants for this type of study and the typically low response rate from a random selection of customers, our study was likely to encounter this type of bias. To help reduce this bias, ICF sent a letter explaining the study to each of the selected 56 participants. Cadmus engineers then made phone calls to attempt to recruit participants and successfully recruited 30 sites from the original sample of 56. This success rate indicates self-selection bias is not a major concern. Figure 1 shows the geographic distribution of the sample of recruited participants. 8

14 Figure 1. Randomly Sampled Sites The evaluation team planned to meter 41 RTUs at the 30 sites by monitoring two RTUs at 11 sites and one RTU at the other 19 sites. We assigned random numbers to all RTU measures reported at the 30 sites and selected 11 RTUs randomly to determine the sites we would meter two RTUs. We planned to use a random selection process on-site by assigning a number to each RTU from the project file. Finally, a random number generator selected one or two numbers and these RTUs are selected for the study. We confirmed the sample had similar weather conditions to the average population by comparing the average CDD and HDD of each group averages differed by less than 5%. Billing analysis showed that savings varied significantly by contractor so we confirmed the sample had good coverage of contractors, including those with tune-up measures that saved much less than anticipated. Table 3 shows different contractors who performed the tune-ups in our sample of site visits. They are listed anonymously, ordered by their level of participation in These HVAC contractors were responsible for performing more than 80% of the tune-up measures in This table also shows the percentage of RTUs selected for metering, by contractor. 9
15 Table 3. Contractors in Sample and # of Tune-Up Measures in 2012 # Measures % in Participating % of Total in Performed by Evaluation Contractor 2012 Contractor (2012) Sample A % 34.1% B % 24.4% C % 4.9% D % 2.4% E % 2.4% F % 4.9% G % 4.9% H % 9.8% I % 2.4% J % 2.4% K % 4.9% L 1 0.1% 2.4% Total 1, % 100% Table 4 shows the building type in the sample and compares the representative percentage of the population for each building type to the census of measures reported in Table 4. Comparison of Sample to 2012 Tune-Up Site Population Percentage of Sites in the Percentage of Sites in the Building Type Sample Population* Theatre 6.7% 5.3% Office 30.0% 19.2% Restaurant 16.7% 16.3% Retail 40.0% 41.6% Athletic 6.7% 3.6% Grand Total 100.0% 86.1% *Remaining 14% includes educational, assembly, lodging, religious, retirement, auto service, and undefined (other) facility types. Considering the relatively high recruiting success rate, the representative sample of contractors that serviced RTUs in the sample, and the similar building type percentages, we believe the sample provides a reasonable representation of the overall program in
16 Review of Project Documents Cadmus and Energy Trust determined that the most effective way to perform the on-site inspections and meter installations was to review the project documents from the selected sample before beginning site visits. This helped us to: Understand as much as possible about the RTUs we planned to meter before going into the field. Collect baseline information from project documents as reported by the contractors. Prepare the necessary metering equipment based on unit type and size and test the accuracy of the meters in our lab before going into the field. Figure 2 is an example of some of the information contained in the project documents. In this particular example, we found that the contractors reported: Adjustments made to the economizer (see top blue circle) Adjustments made to the thermostat set points (see middle red circles) DCV settings (see lower green circle) For this example unit, according to the contractor: The RTU economizer was functional prior to the tune-up. The economizer had a minimum setting prior to the tune-up that let in a minimum of 10% outside air at all times. As part of the tune-up, the unoccupied temperature set points were changed in a way that could result in energy savings. A new DCV sensor and controls were installed to prevent intake of outside air if CO 2 levels fall below 700 parts per million (ppm). 11

17 Figure 2. Example Project Technical Document Energy Trust successfully provided project documents for all randomly sampled sites so Cadmus engineers were able to bring the project documents on-site to investigate details of each RTU selected for the study. Note that we found one unit (not sampled for the study) during our site visits that should not have been incented because it was a heat pump (did not have gas heat). We observed this unit while performing our on-site random sampling procedures. This observation did not affect the evaluated savings because we are unable to assess the frequency of this type of occurrence. We observed over 150 RTUs during site visits and found only one RTU that was a heat pump. We matched the nameplate model number 12
18 with the model number in the tracking database and confirmed it was a heat pump. It is possible to manually look up RTU model numbers in the tracking database to determine whether the RTU qualifies but this task was outside the scope of the study. Contractor Interviews Cadmus completed interviews with nine HVAC companies and talked to more than one key person at four of the companies for a total of 13 interviews. We delayed the contractor interviews until after completion of initial site visits, so our field observations could guide discussion topics with the contractors. We typically spoke with company owners, field work managers, and service technicians (particularly those who did the work). In the interviews, we focused on the following topics: Firmographics, including: Size of company Focus of business (e.g., residential or commercial, service work, installations) Perspectives about the program, including: How the company became involved in the program Program marketing to customers Opinions about the program overall Suggestions for program improvement, including: Program challenges Recommendations for improving RTU efficiency Technical details about the measures, including: Selection process for tune-up measures performed Discussion about each specific measure (CO 2 sensor installation, dry bulb sensor, etc.) Fault diagnosis procedures Opinion about regional RTUs, including: Cleanliness and maintenance (coils, filters, blowers) Percentage of RTUs with advanced controls Percentage of RTUs with maintenance agreements Quality of maintenance work in the region RTU Metering and Savings Analysis Methodology After completing the document review, we finalized our metering plan and analysis methodology. We developed a metering and analysis plan to analyze heating, cooling, economizer, and DCV performance. 13
19 Metering Methodology Our metering plan uses sensors that record data we use to calculate the volume and energy of the air provided by an economizer. Our sensors also record total system power, fan power, gas valve runtime and outdoor conditions. The points metered on every RTU are shown in Figure 3 with descriptions listed below. Note that points A and B (true power of RTU and gas valve position, respectively) are not shown in Figure 3. Detailed pictures and descriptions of each metered point are provided in the section: Appendix B. RTU Meters Installed. Figure 3. Typical RTU Schematic F-1 F-2 F-3 C G D E H Source: A. True power of the unit B. Gas valve position C. Fan current D. Supply air temperature and relative humidity E. Return air temperature and relative humidity F. Mixed air temperature and relative humidity (several locations) G. Outside air temperature and relative humidity H. CO 2 level (voltage signal output from sensor) 14
20 On-Site Inspections and Installation of Meters This section provides the details of Cadmus site visits to 30 randomly selected sites to inspect and meter 41 RTUs. Cadmus conducted visits to each site in the sample to inspect, test, and install meters on each RTU selected for the evaluation. RTU Inspection and Testing We began work on-site by assessing the general condition of the RTU by visually inspecting: Proper lubrication of bearings or other moving parts Cleanliness of air filters Proper belt tension Cleanliness of evaporator and condenser coil Cleanliness of the blower assembly Condensate drain system Electrical connections, transformer, and general wiring CO2 sensor placement, and setpoints, wiring, and accuracy Economizer setpoint and wiring We then performed several tests on each RTU: Airflow measurement. Airflow rate was the only parameter used for analysis that was not metered. We used TrueFlow calibrated flow grids to measure total airflow of the RTU at the filter bank. We typically employ multiple flow grids for large units. The analysis of free cooling relies directly on the airflow measurement, so we carefully conducted airflow measurement tests using the best known method. Airflow can change for various reasons (e.g. zone damper adjustments, different fan speed settings in heating/cooling mode, changes in static pressure) so we adjusted the airflow rate if necessary using the appropriate correlation of fan power with airflow. Economizer function. Where possible we tested the economizer function to ensure it was capable of moving through its full range of motion. Six RTUs had economizer controllers that we were unable to manipulate to test economizer function but in all cases we were able to use meter data to verify economizer operation. Meter data quality control measurements. To confirm our meters recorded accurate data we took spot measurements of all metered points described below. Cadmus took pictures, notes, and narrated videos of each RTU sampled for the study. Examples and description of the summary of these observations are provided in the section Findings: Meter Data Analysis. 15
21 Meter Data and RTU Operations To better illustrate the data collected, consider the example of meter data for one day in Figure 4. This graph shows the data recorded by the meters and the calculated free cooling. This particular example occurs during a day when free cooling is available during some time periods. Figure 4. Example of Meter Data We use the meter data to interpret what is occurring at different periods throughout the day: From midnight to 5 a.m. Economizer is closed. The only capacity comes from fan heat (negative cooling capacity) and any air leaks in the economizer (positive cooling capacity). According to these data, it is likely that the economizer is letting in a small amount of outside air. Notice that even though cooling capacity is provided (total capacity 2 provided is positive), our analysis does not consider this amount significant (free cooling, dark blue line is zero), and most importantly the analysis recognizes that there is no call for cooling during this period. From 5 a.m. to 12 p.m. There is a call for cooling (stage 1) so the economizer opens. Note the fan power (green line [not to scale]) goes up because of the pressure drop in the system. 2 RTU total capacity estimated from airflow rate and the difference between supply and return conditions 16
22 From 12 p.m. to 1:30 p.m. The outside air is still below 68 degrees Fahrenheit but the cooling load increases beyond the available free cooling. The compressor turns on and energy consumption profile (solid purple line) increases. The free cooling during this period decreases because outdoor conditions increase and the economizer begins to slowly close (this was a modulating economizer). From 1:30 p.m. to 6 p.m. Changeover temperature is reached so economizer fully closes and the system provides only mechanical cooling. Free cooling (dark blue line) goes to zero. From 6 p.m. to 7:30 p.m. Both free cooling and mechanical cooling are provided. From 7:30 p.m. to 11 p.m. The economizer continues to modulate open and mechanical cooling is no longer required. After 11 p.m. Economizer closes because there is no call for cooling and CO 2 levels are below the limit of the DCV set point. Savings Analysis Methodology The intention of the tune-up program was to save energy through installation of programmable thermostats, by enforcing coil cleaning, by ensuring proper refrigerant charge adjustment, and by improving economizer control with DCV installation and a temperature reset. The metering and analysis focuses only on estimating savings from the tune-up that improves economizer control (DCV installation and changeover temperature reset) because: Savings are impossible to quantify from cleaning, airflow adjustment, and refrigerant charge adjustment without detailed diagnostic pre and post test data. In the documents, contractors almost always reported systems were clean and did not require cleaning and no indication of the initial condition was provided. Program documents indicated HVAC systems did not require refrigerant adjustment. Programmable thermostats were only installed in 5% of RTUs in 2012 none of the sample had programmable thermostats installed. Savings from resetting a programmable thermostat are difficult to quantify. The tune-up measures save energy by controlling the amount of outside air drawn in through the economizer in both heating and cooling mode. The following scenarios represent the main savings opportunities: During the heating season when there is no call for heat but the fan is running. The economizer is able to close completely whenever CO 2 levels are below the maximum threshold. Heating savings are realized when the fan is running and the economizer is closed and the outside temperature is below the building heating balance point 3. 3 The temperature outside at which the heat lost from a building equals the heat gained from the occupants and equipment inside below the balance point, heating is required. 17
23 When cooling is required, the fan is running and outside air is cooler than return air. Savings are realized when the economizer opens to bring in outside air, termed free cooling. When cooling is required, the fan is running, and outside temperature is above return air temperature. The economizer is able to close completely whenever CO 2 levels are below the maximum threshold. Savings are realized when the fan is running and the economizer is closed and the outside temperature is above the return air temperature. We designed a metering and analysis plan to determine when these scenarios occur and to estimate the savings attributable to the tune-up measures performed. Savings for each RTU metered depend on the initial condition or baseline of that RTU. Contractors recorded the baseline information in the program documentation (see Figure 2) however we remained open to the idea that calculating savings with multiple baseline scenarios might provide a more realistic estimate of savings attributable to the tuneup initiative. We performed a literature review and found several Northwest studies that claim: Economizers tested failed in 64 percent of the units. Of these units, 24 percent would not move at all, 29 percent did not respond to the cold spray test, and 10 percent displayed poor operation during short-term monitoring. 4 Although the review of program documentation might indicate an economizer was functional, an HVAC contractor would not fully diagnose an economizer to confirm proper control with the temperature or enthalpy sensor; this diagnosis is unnecessary because the program requires installation of a new temperature sensor. In the section below (Findings: Qualitative Field Observations), we describe the general condition of the RTUs we studied. Based on our review of the literature describing the economizer failure rate in the Northwest, our on-site observations, and interviews with contractors (described in Findings: Contractor Interviews), we concluded that the RTUs in the 2012 program were similar to the general market. According to the Northwest research, 64% of economizers have some issue and 36% are functioning correctly. We developed three baseline scenarios, described below. The first is for the 36% functioning correctly, the second and third represent economizers that are failed or have issues. Baseline Scenarios: 1. The economizer is functioning correctly. For 36% of RTUs, we assumed the baseline reported in program documentation is accurate. The documentation typically indicates the RTU had a fixed minimum position (reported either 10% or 20%), no DCV, and had an economizer changeover temperature of 62 degrees (or different as specified). 2. The economizer is stuck. We assumed 24% of RTUs have economizers stuck in the closed position. Although the research does not specify the position of the stuck economizer, we discussed failure types with contractors and also considered the 3rd baseline scenario (wherein 4 Review of Recent Commercial Roof Top Unit Field Studies in the Pacific Northwest and California, New Buildings Institute, October 8, Source: 18
24 economizer is open but in incorrect position) and determined 24% stuck closed is a reasonable assumption. 3. The economizer is often in the wrong position, continuously letting in 20% outside air. The research in the Northwest indicates 29% of economizers did not respond correctly to the temperature test and another 10% of economizers displayed poor operation during metering. Therefore, we assumed for 40% of RTUs that the economizer was open but usually in the wrong position. The average % open cannot be determined. We believe 20% open is a reasonable estimate because this scenario estimates that none of the economizers can close by more than the minimum position of 10% open, it includes some that are moving but moving incorrectly and perhaps open 50% on average, and also includes many economizers that by design, cannot bring in 100% outside air. Savings Assumptions and Equations The savings analysis focuses exclusively on savings attributable to improved economizer control 5 through DCV and changeover temperature reset. Some general assumptions are: Three different baseline scenarios are most likely. When the economizer operated as expected, we calculated savings separately for each scenario. If an economizer did not operate, savings are zero 6. Changeover temperature (the program specified 68 F) is the condition at which the economizer remains closed when the fan is running and CO 2 level is below the maximum threshold. We used this to assess whether the economizer was responding properly. There are no savings attributable to standard tune-up maintenance (refrigerant charge, filter change, coil cleaning, thermostat re-program) because these activities are difficult to evaluate). At one-minute intervals, the meters installed determine the volume of outside air drawn into the conditioned space through the economizer. We use the temperature and humidity recordings to calculate the percentage of outside air with the following equation: (1) % Outside air = h mixed h return h outside h return This equation uses enthalpy (h) values of mixed air, return air, and outside air (points F, E, and G respectively). We reviewed data and used limits when necessary to ensure erroneous calculations do not impact results (e.g. when return air approaches outside air, equation is no longer valid). With the percentage of outside air, we calculate the total volume of outside airflow in cubic feet per minute (cfm) by multiplying the total measured airflow of the RTU (described below in On-Site Inspection ). (2) outside air (cfm) = % outside air x total measured airflow (cfm) 5 The tune-up initiative assumed RTUs received regular maintenance, were clean, and were correctly charged. 6 Negative savings are possible so assumption this may over-estimate savings (See: Negative Heating Savings) 19
25 For each metered interval economizing is occurring, we calculate the rate of free cooling (BTUs) provided: where: (3) h t = 4.5 q Δh h t = total heat transfer (Btu/hour) 4.5 = factor to convert cfm to pounds per hour q = outside air flowrate (cfm) Δh = enthalpy difference between Return and Outside air (Btu/lb) Since we did not plan to meter for an entire year, we sum the free cooling capacity values (or for heating, the outside cold air capacity avoided) into one-degree temperature bins which allows us to extrapolate metered free cooling values to annual averages under typical weather conditions (TMY3 weather data). Above we described three savings scenarios: one during the heating season and two during the cooling season. For each of these, here we explain how we analyze the data to estimate savings. Heating season savings The team originally planned 7 to use meter data to estimate heating savings for each RTU metered. We began installing meters on RTUs at the end of March 2014 and completed the installations in mid-april We reviewed the weather during the period metered and found that on average we metered only 4% of the total heating hours below 50 degrees in a typical heating season. We also confirmed we did not meter during the extreme part of the heating season. For these reasons we chose to evaluate heating savings through RTU verification and engineering analysis by: Determining the specific balance point temperature for each RTU (the outdoor temperature at which the RTU no longer requires heat) Calculating the fan cycle time during the heating season (fans that only run when there is a call for heat have low potential savings opportunity) Identifying which RTU economizers functioned properly, showing response to temperature and CO 2 level, by reviewing the heating season meter data Estimating heating savings with bin temperature analysis We summarized meter data into the hourly level and compared heating runtime to outdoor conditions. We reviewed data from each RTU to determine the balance point the outdoor temperature at which the RTU requires no longer requires heat. We then performed calculations to determine the maximum 7 We could extrapolate the meter data to a TMY-3 year but extrapolation from a small subset of data may not produce reliable results. 20
26 potential savings of an RTU with continuous fan operation and the economizer open at a fixed minimum position. We used the following algorithm to estimate savings for each one-degree temperature bin below the building balance point: (4) maximum potential therm savings = 1.08 (360 CFM ton 15%) (T balance T bin ) 100,000 BTU 80% AFUE Therm hours per bin temp where: 1.08 = factor to convert cfm at standard conditions to BTU per degree per hour We calculated heating savings of 33.5 therms/ton with this algorithm using the following set of assumptions: Observed average building/rtu balance point of 55 degrees Average measured airflow rate of 360 CFM/ton Continuous fan operation Economizer minimum position set to 15% Typical meteorological year 3 (TMY3) bin temperature weather for Portland, Oregon Heating coincidence factor average of 75% at coldest 40 hours of the year (see Table 16) Table 16 in the appendix shows the results of the engineering calculations used which compare savings with different sets of assumptions. After completing the review of the metered period we developed the following guidelines to calculate heating savings for each RTU metered: If the fan does not run continuously, savings are adjusted by the percentage of fan runtime determined through estimated heating cycle times and observed fan runtime when the RTU is not heating or cooling (see Table 16). Three different baseline scenarios are used to provide a weighted savings estimate (described in section RTU Metering and Savings Analysis Methodology ). Savings were zero if the CO 2 sensor was failed or missing. Savings were zero if the economizer did not show evidence 8 of response to CO 2 (see below). In a typical RTU, we would see CO 2 levels rising throughout the day when the economizer closes and as occupancy increases. We reviewed the meter data to find occurrences of CO 2 level limits and reviewed the data to confirm the economizer opens in response to high CO 2 concentration. We also reviewed the meter data to determine the percentage of fan run time. The example in Figure 5 shows an RTU with a 8 There were two sites with CO2 levels that never increased to the ppm limit. Upon retrieval of the metering equipment, we tested to confirm proper operation of each sensor and assumed savings for these sites. 21
27 mechanically functional economizer but a 62-degree (Fahrenheit) changeover temperature (some free cooling around 8 am and again after 9 pm). The data indicate that this RTU had no CO 2 control. When the economizer opens, bringing in outside air during the economizing period, the CO 2 levels are consequently affected (pointed out in the graph). But as CO 2 rises throughout the day, we are able to confirm the economizer does not respond through review of the free-cooling estimate (dark blue line), which is 0 even as temperatures remain below 68 degrees 9. We also see that CO 2 levels rise well beyond the acceptable threshold. Figure 5. No CO 2 Control Unlike cooling savings estimates which vary significantly for each baseline scenario, heating savings do not, thus simplifying the savings calculation. Savings are 0 when the baseline assumption is that the economizer is failed closed (24% of RTUs) because this baseline condition would not bring in any cold outside air that requires re-heating 10. Savings are identical for the other two baseline scenarios: operational (36% of economizers) and failed at 20% open (40% of economizers). If the economizer is operational the economizer acts as though it is stuck because it would not move when outdoor conditions are below the changeover temperature. Therefore for any RTU with functional DCV, we calculated savings from the value determined through engineering analysis with the equation: 9 The review also looks at % outside air drawn through the economizer from the enthalpy data, which is omitted from this graph for simplicity. 10 This assumption may over-estimate heating savings. (See next section: Negative Heating Savings) 22
28 (5) therms saved = % fan runtime 33.5 therms saved/ton RTU tons (36% + 40%) Negative Heating Savings Negative heating savings (therms) are possible if an economizer was failed closed before the tune-up. If the DCV measure is installed correctly, the economizer opens to the control CO 2 when necessary. This improves air quality but does not save energy. The analysis methodology does not account for negative savings in this scenario because we were unable to determine the amount of fresh air necessary to control CO 2 during the heating season. We would expect negative savings in this scenario are relatively small. Negative savings are again possible in another scenario. Significant negative savings may occur if an economizer is stuck in a closed position and an HVAC contractor attempts a repair but the repair unsuccessfully results in the economizer stuck in an open position. In this case, the negative savings potential is of the same order of magnitude as the positive savings potential. The analysis methodology does not account for negative savings in this scenario because we have no basis to determine the number of RTUs that were first failed closed and then failed open. For all RTUs we assume a minimum of 0 heating savings for the failed closed baseline scenario. Consequently, heating savings estimates may be overstated if the program changes economizer position from failed closed to failed open. Cooling Season Outside Air Temperature is Below Return Air Temperature The analysis used to estimate cooling savings is somewhat less definitive than heating savings because buildings have internal heat gains, not heat sinks. The heating savings analysis determines the heating balance point and then below this point, savings are possible. Cooling savings occur below the building cooling balance point but are also possible when outside temperatures are above the cooling balance point. Cooling savings are possible whenever the economizer is open and the outside air temperature (or enthalpy) is lower than the return air conditions. If the baseline assumption is that the fan is running and economizer is stuck open at some position, that RTU brings in outside air before cooling is required (in the morning) thus providing some pre-cooling. An RTU operating correctly with CO 2 control is closed before cooling is required and will not provide any pre-cooling. To correctly calculate savings, we preclude days with no obvious need for cooling by identifying the days that require at least some amount of mechanical cooling. We flag time periods when total system power exceeds fan power this indicates the compressor(s) ran. If no mechanical cooling is required, no savings are realized for that day. It is worth noting this is only a common occurrence for a small portion of RTUs. When cooling need is conclusive, the analysis uses equations 1-3 to estimate free-cooling provided to the conditioned space at each metered one-minute interval, summed in each 1-degree temperature bin. Free cooling (BTUs) are converted to electrical energy saved (kwh) with the following equation: (6) total kwh saved = Free Cooling BTUH 1 bin SEER We use the nameplate SEER rating, which represents the average seasonal operational efficiency. We expect RTUs have some efficiency degradation as they age but also understand that the operating efficiency when economizing occurs (below 68 degrees) is higher than the seasonal average efficiency. T high T low 23
29 Therefore we assume the nameplate ratings provides a reasonable proxy for operating efficiency during the conditions at which the RTU is economizing. Here we describe the cooling savings for each baseline scenario when the outside air temperature is below the return air temperature and the fan is running: 1) The economizer is functioning correctly: We assume the economizer changeover temperature was 62 degrees (as indicated on almost all program documents). The new economizer changeover temperature is 68 degrees. Savings occur only at temperature bins from T low to T high of degrees whenever CO 2 levels are below the maximum threshold. 2) The economizer is stuck closed: All free cooling drawn in through the economizer becomes realized savings. 3) The economizer is stuck at 20% open: Savings occur whenever the functional economizer is open more than 20%. Additional savings occur when the outdoor conditions are above the return air temperature (see next section). Cooling Season Outside Air Temperature is Above Return Air Temperature The economizer is able to close completely whenever CO 2 levels are below the maximum threshold. Savings are realized when the fan is running and the economizer is closed and the outside temperature is above the return air temperature. Here we describe the cooling savings for each baseline scenario when the outside air temperature is above the return air temperature and the fan is running: 1) The economizer is functioning correctly: We assume the minimum position of the baseline scenario was 10% and then use equations (2) and (3) to estimate savings for each one-minute interval. 2) The economizer is stuck closed: There are no savings for this scenario. 3) The economizer is stuck at 20% open: We assume the minimum position of the baseline scenario was 20% and then use equations (2) and (3) to estimate savings for each one-minute interval. 24
30 Findings: Document Review Findings Cadmus found the program documents were complete and well maintained. We successfully verified model and serial numbers for all 41 RTUs in our metering study. The documents include information which describes the baseline condition for each unit so completeness was important. We do however, question the accuracy of the baseline information reported for reasons provided in the subsequent sections. Briefly stated, the main reasons are: We found HVAC systems with CO 2 sensors that were never installed, calling into question the reliability of all reported information Many sets of program documents (e.g. 10+ HVAC systems at the same building) reported economizers were functioning correctly and had the same minimum position which is highly unlikely according to numerous HVAC contractors and research conducted in the Northwest HVAC contractors mentioned they believed a number of technicians were too inexperienced to perform the program tune-ups It is not possible to functionally test most economizers without extended metering unless the outdoor conditions are favorable for testing or the contractor uses time-consuming diagnostic testing and contractors all agreed they would not typically diagnose an economizer they planned to service anyway The document review did find some instances of missing data that we initially considered necessary for analysis. Instances of missing data were: Initial economizer changeover control type and set point information Minimum economizer position percentage Our continued research indicated that these data are not reliable estimates anyway and therefore they did not affect the evaluation. Findings: Contractor Interviews Cadmus completed one or two interviews with nine different HVAC companies. At four of the HVAC companies we completed two interviews for 13 total interviews. We typically interviewed company owners, field work managers, and service technicians (particularly those who did the work). We asked questions about firmographics, perspectives about the program and suggestions for improvement, details about the tune-up measures, and the perspective about regional RTUs. When one person was not the most knowledgeable about a certain topic, we followed up with another person the company recommended. Below we summarize the results and the key findings. 25
31 Firmographics The companies employed an average of about 10 HVAC technicians. The largest company had more than 25 technicians, and the smallest had two. All company representatives said the technicians had the standard licenses necessary to work on HVAC systems in Oregon: U.S. Environmental Protection Agency (EPA) 608 certification LHR License (Electrical Contractor, Limited Maintenance Specialty HVAC) Construction Contractors Board (CCB) license Only one contractor explained that they take additional training specific to economizers such as the 186 Economizer Certificate Course series which is complies with Title 24 requirements and adheres to the ACCA/ASHRAE Standard 180 Quality Maintenance protocols. When asked to compare their business in the residential and commercial sectors, only two HVAC companies reported they conducted a larger proportion of residential work than commercial. Most companies focused on maintenance and repair work, from which they generated more than 60% of their revenue. Perspectives about the Program Most (6) HVAC company representatives heard about the tune-up initiative from the program implementer. Another contractor heard about it from a customer with a maintenance contract. This contractor said a direct competitor attempted to sell the tune-up measures so the customer notified the contractor who then pursued the program. Another HVAC company heard about the program from one of its vendors and contacted the program implementer. When asked why they decided to participate in the program, two contractors did not recall their specific motivation. Other contractors offered these reasons: Some said they believed the program would save energy Most said they made money on the installations, especially on the big projects Two said they had a good relationship with the program implementer and established trust and confidence When asked how contractors sold or explained the tune-up initiative to their customers, the responses varied. They said they: Showed a 30-minute PowerPoint presentation they developed discussing energy efficiency and then the program Discussed the measures over the phone and then provided additional information (from the implementer upon request) Sent s to all of their customers and worked with those who showed interest Strictly followed the advice of, and used materials from, the program implementer 26
32 Used analytical tools (spreadsheets) to show customers potential savings for their units During the conversation about how they sold the program, one contractor said he had several customers who did not want to participate even though they would incur no costs. The contractor said one customer chose not to participate because if something is working properly he or she preferred not to introduce additional complexity and sensors. Several other contractors noted that energy savings are not particularly important to many of the decision-makers because they own the equipment but do not pay the energy bills. One contractor said that its biggest client refused to participate for this reason. Contractors all confirmed they performed nearly every project at no cost to the customer. One contractor said an HVAC company told one of their existing customers they could receive the tune-up measures for free and that they would give them money for participating. The HVAC contractor we interviewed speculated a cash offering was possible if they cut corners and use cheap labor to keep costs down. We heard of only one instance of a cash offering. It is possible, but unlikely, that a contractor performing tune-up measures would have offered cash at a small loss to gain new business. As noted above, contractors said they made money on installations, but not in all cases. Some contractors cited examples of situations where they lost money on a project because of unexpected necessary repairs and they did not want to charge a customer for a repair when they sold a project at no cost. The contractors who said they lost money agreed these losses were not a deterrent from continuing to participate. The most common tune-up incentive was $1,050 per RTU. According to project invoices, the equipment needed to perform the most common tune-up measure (temperature and CO 2 sensor) cost about $450. Therefore if a contractor performs the tune-up in less than six hours he can profit from the incentive. Collectively, contractors believed the tune-ups typically take less than four hours per RTU. When asked for their opinion about the program, the most common response was that it was a good program and they would participate again. The following describe some other common statements: Our biggest issue was when the program implementer changed 11 The paperwork was challenging but not unexpected The program was perfect for the slow season The incentive was appropriate One contractor said that the application protocol was difficult to follow and often precluded participation. If a technician was on a site and could perform the tune-up measure(s), he first required approval from the program implementer. 11 The program implementer changed after completion of the 2012 program year and thus does not affect this evaluation 27
33 When asked if they continue to sell these measures to customers, the majority of contractors said they do not because they did not think customers were willing to pay for it. They sell DCV when it is part of a specification but do not attempt to sell this as a retrofit. One contractor did say he continued to attempt to sell improved economizer control to some customers. Suggestions for Program Improvement Contractors offered some suggestions for program improvement. These suggestions were motivated by various perspectives and the discussion focused on the program in general as well as specific measures and RTU technology. The following summarize the suggestions contractors offered about general program improvement: There should be an electronic data form for application data, thus eliminating most paperwork. Consider a method to enable the reliable contractors to skip the application approval process so they can efficiently perform the tune-up measures. The sales process was not as easy as the program implementer indicated. Many customers thought it was too good to be true or had no vested interest in improving energy savings when they do not pay the utility bill. If another entity engages decision-makers, educating them on the public purpose charge, there could be improvement in participation. RTUs that are too small to qualify are precluded because the potential savings are relatively small. Consider a reduced incentive for smaller RTUs because there are some sites with enough RTUs to justify tune-up measure installation, even with a reduced incentive. Several contractors mentioned they witnessed contractors who were too inexperienced to perform tune-up measures. The program should require HVAC contractor qualification to ensure measures are correctly installed. The program should consider installation of modulating economizers, which provide much better control. There should be a stipulation on selling the tune-up measures to each participating HVAC company s customers - there was competition amongst different HVAC companies. Tune-Up Measures We discussed contractor s perspectives about RTUs in the region and asked for their opinion of the program measures. The following summarizes their comments. 28
34 Most contractors said they will repair economizers but only if their customers have a service agreement that includes sufficient time/funds to test the economizer. For example a maintenance agreement might designate only 15 minutes per RTU, which does not provide enough time to perform a thorough diagnostic assessment of unit operation. Only one contractor reported always repairing failed economizers specifically because this is part of every service agreement. Another reported repairing economizers about 30% of the time outside of any tune-up program, and sometimes it depended on how busy he or she was. One contractor explained: There are few HVAC companies who include economizer repair in their service agreements. For those who do, all RTUs, regardless of age, should be eligible for the tune-up retrofits because the economizers work fine if they receive regular service. All contractors agreed the economizer adjustment or installation measures were reasonable and made sense. Minor exceptions were: One instance of a customer near the Coast that had some humidity issues with the 68-degree changeover temperature, especially during thunderstorms. This customer could benefit from enthalpy control. This technician went on to agree that the vast majority of economizers should use dry bulb changeover control. A preference for differential dry bulb temperature control because this method has higher savings potential. All HVAC technicians we spoke with agreed that the majority of economizers are not operating properly. We asked them to generally describe the failures. Some gave explanations of these failures, which we summarize here: For economizers that are stuck in a fixed position, several technicians estimated that 30% are stuck closed, 20% are stuck wide open, and the rest are stuck partially open. Economizers that are not mechanically stuck are often controlled incorrectly mainly because of failed sensors or because they are incorrectly wired. One HVAC technician said the failure rate depends on the type of economizer and RTU. The better, more expensive RTUs tend to have more reliable economizer control. Similarly, it is likely that someone is willing to spend more money to maintain these units. This contractor thought more than 75% of the economizers have some issue. All contractors agreed that the addition of DCV will help save heating energy. Several said that proper installation of DCV was challenging for some system types and that technicians who are inexperienced were unlikely to set it up correctly. We discussed the programmable thermostat measure with each HVAC technician. They agreed the measure makes sense but said there was low participation because so many programmable thermostats already exist. In the section Findings: Qualitative Field Observations we discuss accessibility of thermostats at some sites. 29
35 We also discussed general maintenance items for RTUs in the region outside of any tune-up program such as airflow, refrigerant charge, filter replacement, and coil cleaning. We did not attempt to discuss these measures in detail; rather we asked contractors to give an opinion of the units they service and the market in general. Because the contractors we spoke with said a large portion of their business was maintenance contracts and that their practices were rigorous, we did not expect particularly insightful comments. Consequently, we do not believe a qualitative assessment of their comments accurately describe the general condition of RTUs in the region. Some of the contractors comments were: Airflow is an issue because filters are not changed frequently enough and because of restrictions in the ductwork. Some condensers should be cleaned more than once a year because of local dust/debris in the air. On the other hand, some condensers may not really need cleaning for several years. Contractors had differing opinions about whether refrigerant charge is often an issue or not. Most contractors do not clean the evaporator coil unless it appears quite obviously dirty thus restricting airflow. RTUs in the Region We discussed RTUs in the region from the customer (decision-maker) perspective. Nearly all contractors said most of their customers would rather repair an RTU than replace it. One contractor said he frequently works on units that are more than 30 years old. The obstacle is that even with reasonable payback periods, tenants often pay the bills so a capital investment in new HVAC systems takes low priority. Several contractors said that from their perspective, strip malls have the worst maintenance practices because the tenants are usually responsible for maintenance and they may or may not pay the utility bills. Therefore, according to one contractor, RTUs at strip malls have the highest savings potential for any type of tune-up measure. Findings: Qualitative Field Observations Cadmus has summarized some of the main qualitative findings and observations from on-site inspections. Below we provide some brief examples of our on-site observations to provide context and to support several of our conclusions and recommendations. We found varying quality in maintenance of the RTUs (some very clean appearing well-maintained, some very dirty and presumably never maintained). We also observed various issues with the sensors installed through the program. Routine Maintenance Practices Observed We observed varying levels of RTU maintenance and care. Though the program targeted RTUs with maintenance agreements serviced by participating contractors, our observations indicate some RTUs do not receive routine maintenance. Our assessment is limited to recent observations (about two years after a contractor performed the tune-up measures) but we found evidence that many RTUs in the 30


36 program were not maintained by the HVAC firms performing tune-up measures (See Findings: Contractor Interviews 12 ). Figure 6 shows two examples of dirty evaporator coils. Both are evidence that filters had not been changed and neither of these systems had been cleaned for some time, possibly since implementation of the tune-up measures. Figure 6. Example of Dirty Evaporator Coil and Airflow Restriction Figure 7 shows an example of an air filter dated February 2012 indicated it had not been changed since the day the tune-up was performed. Figure 7. Dirty Air Filter We noticed several sites with poor general maintenance. One site had an RTU with several broken belts near the unit (Figure 8). The belt recently installed on the fan was very loose and was slipping. It was already worn and ready to break. A simple adjustment to the tensioner was necessary and would 12 Contractors said some HVAC firms successfully used tune-up incentives to target new customers. Contractors said retail (leased space) is often poorly maintained because the landlord is responsible for maintenance but the tenant pays the bill). 31

37 alleviate this problem. This type of problem causes airflow issues, not just maintenance problems. Further investigation of the other five RTUs at this site revealed two units with broken belts and evidence of little or no maintenance. Figure 8. Poor Maintenance Practices Based on site visit observations and discussion with contractors, the evaluation team uses the following generalizations to characterize the RTUs observed in this study: 50% appear to have good maintenance practice and are well maintained. 25% receive limited maintenance, most is likely from staff on-site (not HVAC technician). 25% do not receive maintenance (with exception of air filter change). We also attempted to verify thermostat programs and setpoints. Cadmus was unable to or chose not to access thermostats located in conditioned space at about half of the RTUs we metered. In some cases (e.g. retail shopping mall) the thermostat would have been nearly impossible to locate without significant time and effort. In other cases (office buildings) our field staff would have been disruptive to the occupants so we chose not to attempt to locate the thermostat. Contractors can perform all the RTU tune-up work on the rooftop of a building and they typically do not need to access the thermostat. If the RTU was controlled by a programmable thermostat, the program required contractors to inspect and verify the thermostat setpoints and schedule a program when necessary. We speculate this did not always occur, especially when the thermostat was difficult or too time-consuming to locate At one of the sites we visited (shopping mall) the thermostat was a 20 minute walk from the RTU. 32

38 Tune-Up Measures and Economizer Control The primary sensors installed through the program included an outdoor drybulb sensor and a CO 2 sensor. Though the meter data indicate issues with sensors that result in poor or no economizer control, the team visually inspected the quality of the sensor installation and confirmed proper function. The team also tested economizer function. The main issues observed were CO 2 sensor connectivity, CO 2 sensor placement, and failed economizers. Figure 9 shows an example of a CO 2 sensor that was incorrectly placed. In this example, the sensor is in the mixed air chamber (see sensor circled in red in Figure 9). When CO 2 level in the conditioned space reaches the upper limit, causing the economizer to open, outside air would then instantly dilute the CO 2 concentration in the air near the sensor and then the economizer would close. Controlled ventilation is still possible with this scenario, but the economizer would cycle much more than necessary. The sensor should have been placed in the return air duct (refer to Figure 3). Cadmus observed incorrect sensor placement in three of 41 RTUs. Figure 9. Incorrect CO 2 Sensor Placement Figure 10 shows the terminal block for the typical CO 2 sensor installed through the program. In this example, the sensor is merely powered it does not actually send a signal to control the economizer. Cadmus found eight CO 2 sensors that were not correctly wired and two more that were not functional (failed). The meter data analysis found additional instances of failed demand control ventilation because the economizer was not responsive. In total, 17 of 41 RTUs did not have properly functioning DCV. 33

39 Figure 10. Incorrect CO 2 Setup Findings: Meter Data Analysis Cadmus performed detailed reviews of each meter data set. After downloading the meter data, we compiled the data and removed any erroneous measurements. Next, we analyzed the key variables using our internal spreadsheet tools to understand how each unit operated and to estimate savings. Since the evaluation found the baseline information was unreliable we analyzed how each metered RTU was operated to determine the savings for the three probable baseline scenarios. We first discuss heating savings and then cooling savings results. One important find that affects both heating and cooling savings is fan runtime. If the fan isn t running, there are no savings, thus RTUs with low or sporadic fan use had low energy savings potential. Figure 11 shows a summary of fan operation for the RTUs metered. 34
40 Figure 11. Variable Fan Operation Heating Savings Because the metering duration during the heating season was limited, we chose to verify DCV and economizer function and to use engineering calculations and observed fan operation to estimate savings. We reviewed each meter data set and found some RTUs had functional DCV and some did not for various reasons. Table 5 provides a summary of our findings from both meter data analysis and field observations of the economizer and CO 2 value metered. Observation Category Table 5. Summary of Economizer Function Heating Savings Number of RTUs from Metered Sample of 41 Description of Observation Considered Functional? 1 17 CO2 control functioning normally Yes CO2 maximum level never reached but values are correct and economizer is functional Issue with economizer/wiring/operation resulting in lack of CO2 demand control 4 5 CO2 sensor was either disconnected or never hooked up No 5 2 The CO2 sensor is missing No 6 1 CO2 level is continuously high No Yes No The heating savings estimate for all RTUs resulted in a therm realization rate of 19.8% with 27% relative precision at the 90% confidence interval. Savings were less than expected because only 23 of 41 RTUs had functional CO 2 control and because the fan ran less than 100% of the time (See Figure 11). Results by RTU with each RTU s observation category (from Table 5) are provided in Table 18 in the appendix. 35
41 Table 6. Average Heating Savings (therms) and Fan Run Time Per RTU (n=41) Value Relative Precision Average Reported Estimate Realization Rate Fan Runtime Percentage 17.7% 51.7% Unknown N/A Savings 27.1% % Table 7 shows savings estimates for only the RTUs with functional DCV, an estimate of the potential savings if all RTUs operated as expected. For these RTUs we found a realization rate of 38.4% with 13.7% relative precision at the 90% confidence interval. Table 7. Average Heating Savings (therms) and Fan Run Time per RTU: Functional DCV Control (n=23) Value Relative Precision Average Reported Estimate Realization Rate Fan Runtime Percentage 15.1% 56.1% Unknown N/A Savings 13.7% % Cooling Savings We grouped all functional economizers together (resulting in savings) to understand the potential savings from functioning economizers. We considered an economizer functional if the meter data indicated the economizer responded to temperature changes and operated in a way that saved energy. There were several instances of economizers that seemed functional but were not operating correctly. For example, one economizer was wired backwards. It responded (opened) above the changeover temperature of 68 degrees and closed below the changeover temperature. We could calculate negative savings in this scenario but instead we chose to calculate zero savings because we assume the baseline condition is the same as the condition observed. Table 8 provides a summary of our findings from both meter data analysis and field observations for the economizers metered relative to reported electric savings. For additional information including savings per RTU, see Table 15 in the appendix. Observation Category Table 8. Summary of Economizer Function Cooling Savings Number of RTUs from Metered Sample of Description of Observation Economizer is functioning properly and saving energy as expected, the fan runs continuously or almost continuously Considered Functional? RR Yes 45.9% 36
42 Observation Category Number of RTUs from Metered Sample of Description of Observation Economizer is functioning properly and saving some energy but less than expected because the fan only runs when there is a call for cooling and/or the cooling load is low when it s cool outside Economizer is functioning properly and saving some energy but less than expected because the changeover temperature is well below 68 degrees Savings potential is low because the system had low or no call for cooling Economizer does not move, it is stuck in one position The CO2 level is continuously high and therefore the economizer does not close Considered Functional? RR Yes 11.9% Yes 16.7% Yes 7.5% No 0% No 0% 7 2 Economizer is wired incorrectly No 0% For each RTU we estimated three savings values one for each baseline scenario (see Table 15 in the appendix). We then calculated a weighted average savings value for each RTU based on the estimated percentage of each baseline scenario. Table 9 provides a summary of electric analysis savings results for all RTUs metered. Table 9. Average Cooling Savings Estimates (kwh) per RTU (n=41) Baseline Scenario Relative Precision Lower Bound Savings Estimate Upper Bound Savings Estimate Average Savings Savings w/ Baseline of Operational Economizer (36%) 36.4% Savings w/ Baseline of Economizer Failed Closed (24%) 43.4% 394 1, Savings w/ Baseline of Economizer Failed 20% Open (40%) 60.3% 768 1,786 1,277 Weighted Average Savings Estimates 41.0% 453 1, Table 10 shows the relative precision, average, and upper and lower bound savings estimates for each baseline scenario for all 41 RTUs metered. 11 RTUs had economizers that were non-functional and therefore had 0 savings so we separated these RTUs from the 30 RTUs with functional economizers. Table 10 shows the difference in savings for only the 30 RTUs with functional economizers. 37
43 Table 10. Average Cooling Savings Estimates (kwh) for RTUs with Functional Economizers (n=30) Baseline Scenario Relative Precision Average Savings Savings w/ Baseline of Operational Economizer (36%) 39.6% 298 Savings w/ Baseline of Economizer Failed Closed (24%) 42.6% 978 Savings w/ Baseline of Economizer Failed 20% Open (40%) 42.6% 1,745 Weighted Average Savings Estimates 39.3% 1,232 Savings are relatively variable for the entire sample of 41 RTUs and also for the sub-set of RTUs with functional economizers. We also calculated relative precision of the realization rate for each unit which effectively normalizes differences in system size and found little improvement in relative precision. These RTUs had savings estimates resulting in relative precision of over 40% mainly because of the differences in operational strategies. Table 11 shows the average electrical energy (kwh) savings evaluated for all RTUs metered as well as the sub-set of these RTUs with functional economizers. Table 11 also provides an electric energy savings realization rate for the program (25.6%) calculated from the average reported savings of each of the RTUs. Table 11. Average Cooling Savings (kwh): All RTUs and Only RTUs with Functioning Economizers RTU Analysis Group kwh Evaluated kwh Reported Realization Rate All 41 RTUs Metered 767 2, % 30 RTUs with Functioning Economizers 1,232 3, % Program Savings Estimates Table 12 provides a summary of cooling (kwh) and heating (therm) realization rates determined through evaluation. We applied the realization rates from the all metered RTUs to the reported savings for the program to determine evaluated savings for all 1,971 RTUs tuned up at 588 unique participant sites in Table 12. RTU Tune-Up Savings Savings Reported Evaluated Realization Rate Relative 90% Confidence kwh 4,889,403 1,249, % 41.0% 38
44 Savings Reported Evaluated Realization Rate Relative 90% Confidence Therms 659, , % 27.1% Additional Insights Individual HVAC Company Performance The evaluation team estimated heating and cooling savings for each RTU and also summarized issues, if any, for each RTU. We found that the RTUs serviced by the largest participation contractor in 2012 (contractor A) had significantly lower realization rates than the second highest participating contractor (see Table 13). This table also shows the percentage of CO 2 sensors that were incorrectly installed. This information is qualitative because the sample size is low resulting in high relative precision but there do appear to be some significant differences in savings of RTUs serviced by some of the largest participating contractors. RTUs Table 13. Savings Review Biggest Participating Contractors Therm Realization Rates kwh Realization Rates % RTUs with Major Heating Savings Issues % RTUs with Major Cooling Savings Issues CO2 Sensor Installation Error All 41 19% 26% 44% 22% 41% Contractor A (n=14) Contractor B (n=10) All Other RTUs (n=17) 9% 12% 57% 50% 57% 38% 51% 20% 10% 20% 25% 29% 41% 29% 41% 39
45 Conclusions and Recommendations Cadmus offers the following conclusions and recommendations. We developed many of these conclusions and recommendations with the understanding that Energy Trust may fund a new RTU tuneup initiative. We provide considerations for changes in program design based on our findings through field observations, knowledge of tune-up programs, and interviews with contractors. Conclusion 1: Program savings were less than expected because in some cases: Tune-up measures were not correctly installed Economizers were not functional Measures may have been disabled The RTU was seldom used and therefore had little or no opportunity to save energy The fan ran in auto mode rather than continuous mode Cadmus found evidence to suggest sensors had either been installed and were eventually disabled or were never correctly installed. We found that more than one in four of the units observed had issues with measure installation or persistence, resulting in low or zero verified savings. The evaluated gross kwh and therm savings from the detailed evaluation of 41 RTUs provides a more accurate assessment of savings. Recommendation 1: Adopt the evaluated gross kwh and therm savings estimated through this evaluation for true-up. Although the baseline assumptions are uncertain, we believe our analysis results in the most accurate and reasonable savings estimate for RTU tune-ups done through this program. We found a realization rate of 25.6% for cooling savings (kwh) and 19.8% for heating savings (therms). Conclusion 2: The program documents reported baseline information that is unreliable in some cases. The setpoints reported in the program documents may not provide an accurate assessment of the actual operation and setpoints of the economizer before the program. Although contractors noted the changeover temperature, the economizer minimum position, and also noted the economizer was functional, they are usually unable to confirm the validity of these claims without detailed testing. Contractors are unlikely to perform detailed diagnostic testing because they are upgrading the RTU with new sensors anyway. The most probable baseline from which to estimate savings is a combination of various scenarios determined through secondary research in the Northwest which agrees with our field observations and findings from contractor interviews. We calculated savings from these scenarios for each RTU studied. Recommendation 2: If QC requirements of a future tune-up initiative enable an EM&V contractor to inspect an RTU prior to the tune-up, this could serve as an opportunity to assess the baseline operation of a sample of RTUs and would provide the evaluation with more definitive baseline assumptions. 40
46 Conclusion 3: The quality and skill of contractors installing measures is critical to success in this tuneup initiative or any unitary HVAC tune-up program. Economizer controls can be relatively straightforward on some HVAC systems and very complex on other HVAC systems. Several contractors explained that they witnessed a number of inexperienced HVAC technicians performing measures for the tune-up initiative. The evaluation found some significant differences in savings and RTUs with issues between the two biggest participating contractors (see Table 13). Through analysis of meter data, field observations, conversations with contractors, and our knowledge of similar tune-up programs, we conclude that experienced contractors are necessary for this type of program to succeed. Recommendation 3: Provide or require economizer/rtu controls training. Many HVAC manufacturers (e.g. Carrier, Trane) offer training courses for RTUs, with specific courses focusing on economizer training. If each technician performing measures in the program is asked to provide proof of training, or training is provided as an initial program entry requirement, the implementation team will ensure contractors have access to the skills needed for successful measure implementation. Conclusion 4: A change to the program QC requirements could improve contractor performance and could serve as an opportunity to provide baseline information. Cadmus has evaluated various types of tune-up programs in many different regions of the country. We consistently find that if unchecked, a large portion of contractors will fail to perform the work intended by the design of the program. If contractors understand that the QC process will include actual fault diagnosis and that there are consequences (e.g. loss of part of incentive, withholding payment) if any issue discovered is not remedied, then contractors will either choose not to participate or will perform work that aligns with the expectations of the program. The appropriate process of contractor verification could improve the quality and consistency of measure installation. An on-site verification process of an RTU prior to the measure implementation offers and opportunity for an EM&V contractor to collect baseline information (see conclusion 2). Recommendation 4: Randomly verify the work of the individual contractor. In our experience the most successful tune-up programs first qualify each individual HVAC technician performing the work with a high level of rigor. This is the qualifying step, usually conducted by a program implementer or EM&V contractor. Once qualified, the implementation team randomly inspects their work through standard M&V random sampling (e.g. 3-5% of all installations). Conclusion 5: Even some RTUs receiving field verification had tune-up measure installation issues. Some RTUs are relatively simple and a visual inspection by a field verification contractor to confirm proper installation may prove sufficient. Conversely, some RTU economizer controllers are very complicated and field verification through visual inspection proves challenging or impossible. Even though some RTUs received field verification, we found evidence to suggest that economizers were never functioning correctly. Through detailed meter data analysis we discovered various issues that were difficult to detect through visual inspection or even through basic economizer functional testing. 41
47 Recommendation 5a: Modify the QC protocol to physically test the economizer operation. The industry has provided various initiatives and guidelines specific to economizer fault diagnostics and economizer improvement (e.g. CEC FDD, source: but none of these initiatives provide detailed guidance for functional testing from single pointin-time field M&V. There are several techniques one might employ to functionally test an economizer and the measures performed through a tune-up program. When there is a call for first-stage cooling and the dry-bulb sensor is below the changeover temperature, the economizer should open. One could physically decrease the dry bulb temperature sensor to initiate economizing. Similarly, one could breathe on the CO 2 sensor to increase CO 2 above the maximum threshold to determine whether the economizer responds as expected. Field verification can be challenging; the verifier requires a unique and in-depth understanding of all of the typical RTU and economizer models. Recommendation 5b: Consider alternate economizer controller technologies. The California Energy Commission provides a list of more than 50 different economizer controllers that conform with the requirements of Title 24, Part 6 Sections 100.0(h) and 120.2(i) 14. Many of these are retrofit controllers that provide visual diagnostics and RTU and economizer fault detection. Some of the most intriguing retrofits provide controls to change constant volume RTUs to variable volume. These types of controllers are much easier to verify than more simple analog alternatives (similar to many of those in the 2012 tune-up initiative). An advanced RTU controller ranges from $2,500 to $4500 per unit but this system would not include monitoring and commissioning, which ensure measure persistence. Assuming 5 RTUs per building, the cost to install an advanced RTU controller with real-time access to diagnostic data may cost $4,500 to $6,500. The program design should weigh the increased cost of technology which may provide better control, reliability, and successful M&V against more simple alternatives and the challenges in implementing and verifying them. We might expect much lower participation than in the 2012 initiative because participants would incur significant costs. Successful implementation of an advanced RTU control program requires marketing or selling to the customer. Payback period depends primarily on the RTU size and fan operation. Large (7.5+ ton) RTUs with continuous fan operation have the highest savings potential with payback periods ranging from 1-3 years. Conclusion 6: Older RTUs have significant savings potential and if targeted correctly, tune-up of these systems using industry standard best practice could provide significant savings. According to several contractors, many of the RTUs in the Northwest receive limited maintenance because the tenants, not equipment owners, pay the utility bills. Equipment owners have little incentive to pay for routine maintenance that might help reduce energy cost for tenants. Tenants may either neglect their responsibilities or choose a minimal RTU maintenance plan. Consequently, many RTUs are wasting
48 energy, will not receive adequate service, and will not soon be replaced. Though the program targeted RTUs receiving routine maintenance to ensure predictable savings, our evaluation indicated many of the RTUs receiving tune-up measures probably do not receive regular maintenance. Our field observations and discussions with HVAC contractors lead us to believe that the program included many RTUs with higher potential savings than expected (e.g. refrigerant not charged correctly, airflow low or incorrectly measured, evaporator and condenser coils dirty). Still, savings were much lower than expected because of poor installation practices and low measure persistence. Given the low realization rate of the program which attempted to target reliable RTUs, future programs should consider including any RTU and should emphasize measure persistence and quality standard tune-up practices. Recommendation 6a: Perform targeted marketing to decision-makers who consider RTU maintenance a low priority. When discussing maintenance practices in the region, one contractor mentioned shopping malls are the worst. To better understand how best to reach out to decision-makers who might consider RTU maintenance a low priority, we recommend additional research through contractor interviews or focus groups. Recommendation 6b: Consider an incentive based on system size. Larger RTUs have higher savings potential. If incentives vary by RTU size, contractors will target larger RTUs with high savings potential. Contractors would also target rooftops with large quantities of RTUs. Recommendation 6c: Ensure contractors follow quality tune-up practices. The evaluation team was unable to diagnose refrigerant charge because conditions were too cold when we performed meter installation. Analysis of meter data can indicate issues with refrigerant charge but this review has limitations. None of the 41 RTUs we inspected received refrigerant charge adjustment (according to contractor s documentation records) but tune-ups were often performed when refrigerant charge diagnosis isn t possible because outdoor conditions are too cold. Contractors even mentioned the program was great for the slow season meaning too cold to test refrigerant charge. Future program design should hold contractors to a higher standard of refrigerant charge diagnostic testing or should require M&V on all tune-ups performed during cold conditions. 43
49 Appendix A. RTU Results by Unit Table 14 provides a summary of the main issues we found when assessing economizer performance for each RTU. Observation Category Table 14. Summary of Economizer Function Cooling Savings Number of RTUs from Metered Sample of Description of Observation Economizer is functioning properly and saving energy as expected, the fan runs continuously or almost continuously Economizer is functioning properly and saving some energy but less than expected because the fan only runs when there is a call for cooling and/or the cooling load is low when it s cool outside Economizer is functioning properly and saving some energy but less than expected because the changeover temperature is well below 68 degrees Savings potential is low because the system had low or no call for cooling Considered Functional? 5 6 Economizer does not move, it is stuck in one position No 6 1 The CO2 level is continuously high and therefore the economizer does not close 7 2 Economizer is wired incorrectly No Yes Yes Yes Yes No Table 15 shows the economizer savings for each RTU for each of the three baseline scenarios and also provides the observation category from Table 14 explaining the issue, if any, with each RTU. Site#/ RTU# Observation Category System Size (Tons) Table 15. Cooling Savings (kwh) by RTU Fan % On kwh Savings: Operational Economizer kwh Savings: Economizer Failed Closed kwh Savings: Economizer Stuck at 20% Open Weighted kwh Savings Reported kwh 1/ % ,948 1/ % 181 3,314 5,002 2,862 6,948 2/ % 510 1, ,737 3/ % ,737 4/ % ,432 5/ % , ,342 6/ % ,474 7/ % 6 6 1, ,474 7/ % , ,474 8/ % ,605 9/ % ,084 44
50 Site#/ RTU# Observation Category System Size (Tons) Fan % On kwh Savings: Operational Economizer kwh Savings: Economizer Failed Closed kwh Savings: Economizer Stuck at 20% Open Weighted kwh Savings Reported kwh 9/ % 865 1,785 5,946 3,118 2,432 10/ % ,474 10/ % ,474 11/ % 142 4,814 2,174 2,076 6,948 11/ % ,687 1,594 6,948 12/ % ,737 13/ % ,605 14/ % / % 195 2,169 1,289 1,106 1,737 16/ % ,084 17/ % 996 2,713 6,395 3,568 1,737 17/ % 293 1,119 1, ,737 18/ % ,474 19/ % ,737 20/ % , ,085 21/ % ,084 22/ % ,516 23/ % 24 1, ,432 23/ % ,084 24/ % ,474 24/ % 3,037 5,571 8,661 5,895 3,474 25/ % ,605 25/ % ,605 26/ % ,084 27/ % ,474 27/ % ,258 28/ % , ,474 29/ % 631 1,646 1,320 1,150 3,474 30/ % ,737 30/ % , ,737 Table 16 provides therm savings estimates for each temperature bin. The analysis shows savings from continuous fan usage (right-most column) as well as therm savings from RTUs with average continuous fan use of 25%. Fan runtime estimates for heating mode assume heating is required 75% of the time at the design temperature (below 30 degrees) and the heating runtime is linearly adjusted to 0% at the 45
51 building balance point (see third column, Table 16). We used these calculations to estimate potential heating savings (therms) for a typical RTU in Portland, OR. Table 16. Engineering Calculations of Heating Savings (therms) Therms Saved with 25% fan runtime, 10% Minimum Position Therms Saved with 100% fan runtime, 15% Minimum Position Economizer Outside Air Bin Temp Bin Temp Hours Estimated fan runtime: Heat Mode Total Estimated fan runtime Economizer % 100% % 100% % 97% % 94% % 91% % 88% % 85% % 82% % 79% % 76% % 73% % 70% % 67% % 64% % 61% % 58% % 55% % 52% % 49% % 46% % 43% % 40% % 37% % 34% % 31% % 28% Total: Table 17 provides a summary of the main issues we found when assessing economizer performance with CO 2 control function for each RTU. 46
52 Observation Category Table 17. Summary of Economizer Function Heating Savings Number of RTUs from Metered Sample of 41 Description of Observation Considered Functional? 1 17 CO2 control functioning normally Yes CO2 maximum level never reached but values are correct and economizer is functional Issue with economizer/wiring/operation resulting in lack of CO2 demand control 4 5 CO2 sensor was either disconnected or never hooked up No 5 2 The CO2 sensor is missing No 6 1 CO2 level is continuously high No Yes No Table 18 shows gas savings for each RTU. The verified gas savings value for each RTU represents the weighted average of the three baseline scenarios and also provides the observation category from Table 17 explaining the issue, if any, with each RTU. Table 18. Heating Savings by RTU (therms) Site#/ RTU# System Size (Tons) Fan % On Reported Therms Verified Therms (Weighted average) Observation Category 1/ % / % / % / % / % / % / % / % / % / % / % / % / % / % / % / % / % / % / %
53 15/ % / % / % / % / % / % / % / % / % / % / % / % / % / % / % / % / % / % / % / % / % / % Average:
54 Appendix B. RTU Meters Installed The following section describes each sensor installed by the team on a typical RTU. Figure 12. Typical RTU Schematic F-1 F-2 F-3 C G D E H Source: A. True power of the unit B. Gas valve position C. Fan current D. Supply air temperature and relative humidity E. Return air temperature and relative humidity F. Mixed air temperature and relative humidity (several locations) G. Outside air temperature and relative humidity H. CO 2 level (voltage signal output from sensor) Point A (not shown in RTU schematic): True Power of RTU We used a WattNode, voltage leads, and current transformers (CTs) to log true power of the RTU (see WattNode circled in red and CTs circled in yellow in Figure 13. The WattNode outputs a pulse count representing energy consumption (kwh) for every metered interval. 49
: Therm Consumption")
 around a gas-valve control wire.")

55 Figure 13. RTU True Power Sensor Point B (not shown in RTU schematic): Therm Consumption (from gas valve position) Figure 14 shows a CT installed (circled in red, left image) around a gas-valve control wire. In the right image is an example of gas-valve control wires for a dual-stage gas valve. In most cases, we were able to meter the valve position for single- and dual-stage gas valves. Figure 14. CT Around Gas Valve Wires (Right) of Dual-Stage Gas Valve (Left) 50
.")
56 Point C: Fan Power (from fan current) Although not part of the original evaluation plan, we installed a CT to meter current on leg 1 of the indoor fan. Figure 15 shows an example of the fan current measurement (CT circled in yellow). When only the fan was running, we were able to determine power factor and true power of the fan from the WattNode (Point A, which measures total system power) and use these values to estimate fan power when the compressor(s) were running. If fan power varied due to changes in duct pressure, we were able to adjust the airflow measurement using manufacturers fan curves. Figure 15. Fan Current Measurement Points D & E: Supply and Return Air Temperature and Relative Humidity Supply and return air sensors record relative humidity and dry bulb temperature. Figure 16 shows a sensor wire leading to a sensor in the return duct of an RTU (left image). Return temperature sensor placement is critical we placed the sensor at least two feet into the return duct to avoid any mixing effect from economizer inlet air. We placed the supply air sensor in the supply duct (right image), downstream of the cooling coil and furnace heat exchanger. We place both supply and return air sensors directly in the airstream and in a way that ensures the sensor does not contact the sides of the duct. 51


57 Figure 16. Return Air Temperature Sensor Point F: Mixed Air Temperature and Relative Humidity Mixed air temperature and humidity sensor locations vary depending on unit type. Cadmus engineers looked at each mixing chamber and economizer location and used best judgment to select the sensor location so that the average of all sensors would provide an accurate mixed air temperature. In total we installed three mixed air sensors. Sensor placement varied from unit to unit but we typically installed one temperature/relative humidity sensor in the middle of the filter bank and two additional dry-bulb sensors in the upper and lower corners (diagonally). Figure 17 and Figure 18 show typical placement of mixed air sensors. We also placed sensors in a way that ensured filter replacement (from regular maintenance) would not disturb the sensor. 52

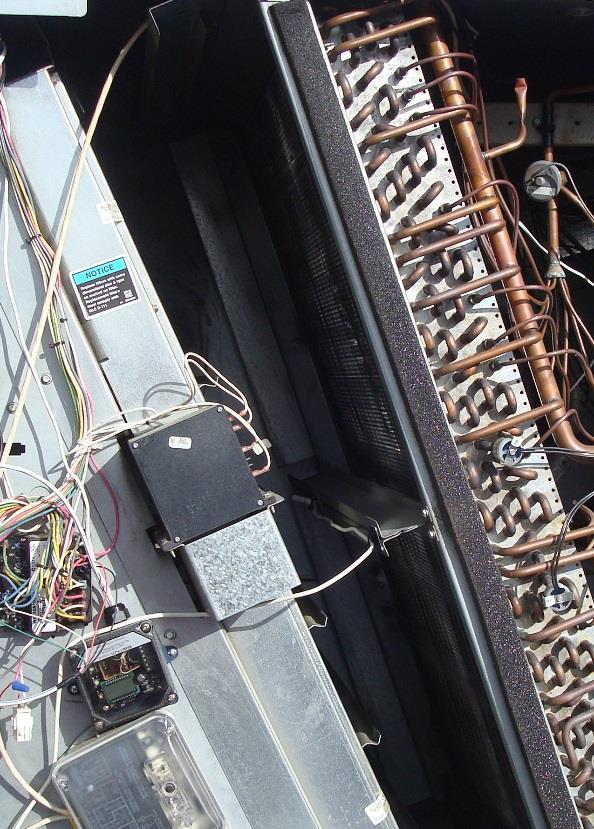
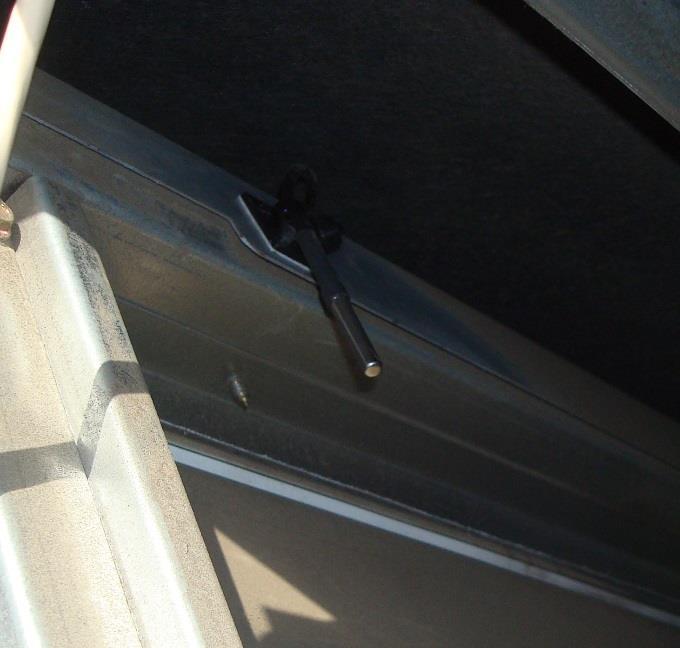
58 Figure 17. Mixed Air Chamber Temperature/Relative Humidity Sensors Installed Figure 18. Mixed Air Sensor Placement 53
")
59 Point G: Outside Air Temperature and Relative Humidity We installed an outside air temperature and humidity sensor near the economizer inlet. A solar shield (circled in red in Figure 19) prevents erroneous measurements due to solar gain on the surface of the sensor. Figure 19. Outside Air Temperature and Relative Humidity Sensor Point H: CO 2 Level (ppm) To verify the accuracy of the CO 2 sensor installed in each unit, we placed the sensor in the outside air (approximately 400 ppm) to confirm that the sensor produced accurate readings. We metered the voltage signal output from the sensor (generally 0 Vdc to 10 Vdc) to meter the CO 2 level in ppm. All CO 2 sensors monitored had 0 Vdc to 10 Vdc output so we successfully recorded CO 2 levels for all units with existing CO 2 sensors. Figure 20 shows examples of the typical physical jumper setting of a common CO 2 sensor configured for current output (left) and voltage output (right). The image on the right shows both the existing control wire and the signal wire for CO 2 monitoring. 54

.")
60 Figure 20. Typical CO2 Sensor Configuration Accounting for and Adjusting Sensor Error All measurements are subject to sensor inaccuracy. Sensor placement may also affect analysis results. The estimate of free cooling has the highest uncertainty because it is based on nine different measurements. 15 Free cooling capacity is calculated from measured airflow and the estimated percentage of outside air. The percentage of outside air is calculated from five different sensors (three mixed air sensors, outside air, and return air). It is difficult to achieve a representative mixed air condition with three temperature sensors so we attempted to correct for measurement errors whenever possible. We set limits on the calculation of free cooling capacity to ensure savings estimates were reasonable. The limits were within the uncertainty of the sensor measurement. For example: Stack up of sensor error results in a calculated capacity variance of 5,000 Btus. We adjusted the capacity that appeared incorrect by 5,000 Btus. If the three mixed air sensors varied significantly in temperature, a simple average of these sensors might incorrectly estimate mixed air conditions. We checked if there was sensor error by reviewing data when the economizer was closed and only return air passed over the three sensors. If all sensors aligned then we considered adjusting the average by weighting the sensor measurements differently. We used engineering judgment, reviewing the resulting difference these adjustments made in the calculated outside air percentage through the economizer and the resulting total free cooling capacity calculation Three temperature and humidity measurements, two additional temperature measurements and airflow measurement. 16 This adjustment was necessary for only two RTUs. 55
Commercial Retro-Commissioning Program Manual for 2016 SECTION 1
 Commercial Retro-Commissioning Program Manual for 2016 SECTION 1 Introduction The Commercial Retro-Commissioning Program (RCx) is designed to achieve demand and energy savings in commercial facilities.
A New Paradigm for Retrocommissioning: Moving Building Science to Green Collar Trades
 A New Paradigm for Retrocommissioning: Moving Building Science to Green Collar Trades Presented by: Keith Forsman,PE Pacific Gas & Electric Company August 17, 2010 .From Building Science to Green Collar
Experiences Commercializing FDD in the Northwest. Danny Miller, President Transformative Wave
 Experiences Commercializing FDD in the Northwest Danny Miller, President Transformative Wave Our Background Transformative Wave is the manufacturer of the leading HVAC retrofit solution for constant volume
Nonresidential HVAC Stakeholder Meeting #3
 1 Nonresidential HVAC Stakeholder Meeting #3 California Statewide Utility Codes and Standards Program PECI April 8, 2011 HVAC Controls & Economizing Summary of Code Change Proposals 2 1. Revise the prescriptive
Retro-Commissioning Report
 10 Retro-Commissioning Report Retro-Commissioning Retro-Commissioning is the process for identifying intrinsic operational and energy related issues in the facilities DDC system and providing a mechanism
WHAT IS THE DIGI-RTU South 59 th Street Omaha, NE bes-tech.net
 Digi-RTU WHAT IS THE DIGI-RTU The Digi-RTU is a Heating, Ventilation, and Air Conditioning (HVAC) rooftop unit control kit that is both a demand management and energy usage device. It is designed to improve
Pay for Performance. Emerging Technologies. ET Emerging Technologies Showcase. Emily Levin Vermont Energy Investment Corporation
 Emerging Technologies Pay for Performance ET Emerging Technologies Showcase Emily Levin Vermont Energy Investment Corporation Kathleen Belkayat Energy Trust of Oregon March 28, 2017 Sponsored by BPA s
Transformative Wave Technologies Kent, Washington
 Transformative Wave Technologies Kent, Washington www.transformativewave.com manufacturers of the North America s Leading Energy Efficiency Solution for Constant Volume HVAC Systems The CATALYST converts
Utility Incentives for RTU FDD in California. Mel Johnson Southern California Edison
 Utility Incentives for RTU FDD in California Mel Johnson Southern California Edison 1 Agenda Strategic Direction Action Plan Industry Involvement Business Case Research Programs Field FDD Onboard FDD Challenges
Rooftop Unit Optimization Offering Frequently Asked Questions and Updates Released April 1, 2013
 1 South Pinckney, Suite 340 Madison, WI 53703 phone: 800.762.7077 fax: 608.230.7035 focusinfo@focusonenergy.com www.focusonenergy.com Rooftop Unit Optimization Offering Frequently Asked Questions and Updates
Advanced Rooftop Controller
 Advanced Rooftop Controller Preliminary Seventh Power Plan Energy Efficiency Estimates Conservation Resources Advisory Committee Meeting December 17, 2014 Presentation Outline Advanced Rooftop Controller
ecoenergy Innovation Initiative Research and Development Component Public Report
 ecoenergy Innovation Initiative Research and Development Component Public Report Project: Integrated Approach to Development of a High Efficiency Energy Recovery and Intelligent Ventilation System Contents
Building Re-Tuning (BRT) Lesson 4: SOI Air-Handling Unit Part II
 Lesson 4: SOI Air-Handling Unit Part II") Building Re-Tuning (BRT) Lesson 4: SOI Air-Handling Unit Part II Lesson 4: Sections Review of last class (0:20) Section 1: AHU: Discharge air temperature control (0:45) Break (0:10) Section 2: AHU: Heating
Building Re-Tuning (BRT) Lesson 4: SOI Air-Handling Unit Part II Lesson 4: Sections Review of last class (0:20) Section 1: AHU: Discharge air temperature control (0:45) Break (0:10) Section 2: AHU: Heating
Continuous Commissioning at Sandia National Laboratories
 Session: Why On going Commissioning Can Lead to Better Performing Buildings Continuous Commissioning at Sandia National Laboratories Jack Mizner Sandia National Laboratories August 10, 2016 Sandia National
James Donahue Control Consultants, Inc.
 James Donahue Control Consultants, Inc. Founded 1989 NE s premier distributor of Building Automation products Customer Base: Controls Contractors and Systems Integrators In-House Engineering Department
Driving Proactive Facility Operations with Automated HVAC Diagnostics
 Driving Proactive Facility Operations with Automated HVAC Diagnostics Turn HVAC Data into Actionable Information AKA Monitoring Based Commissioning Ongoing Commissioning Automated Fault Detection & Diagnostics
Initial Review of ASHRAE/ANSI/ACCA Standard 180 (2010)
") Summary This 2010 document is the first in a series of documents by Western HVAC Performance Alliance (WHPA) industry volunteers of ASHRAE/ANSI/ACCA Standard 180. More recent WHPA documents provide detailed
Summary This 2010 document is the first in a series of documents by Western HVAC Performance Alliance (WHPA) industry volunteers of ASHRAE/ANSI/ACCA Standard 180. More recent WHPA documents provide detailed
ComEd Retro-Commissioning and Monitoring-Based Commissioning
 ComEd Retro-Commissioning and Monitoring-Based Commissioning Rick Tonielli Sr. Program Manager C O N F I D E N T I A L Territory profile ComEd is an electric delivery company providing service to 3.8 million
Fair City Plaza. Task: Diagnose problems, recommend improvements for small municipal district cooling system
 Fair City Plaza Task: Diagnose problems, recommend improvements for small municipal district cooling system The Fair City Plaza district cooling system provides chilled water to five buildings in a downtown
How Big Data Analytics Helps Hotels Improve Maintenance and Comfort, and Save Energy
 How Big Data Analytics Helps Hotels Improve Maintenance and Comfort, and Save Energy Critical facility management drivers are impacting all industries Sustainability Big Data/Cloud Open Building Systems
Commercial HVAC and Other Measures for 7P. Outline
 Commercial HVAC and Other Measures for 7P Conservation Resource Advisory Committee January 28, 2014 Outline Commercial HVAC data from CBSA Overview of Commercial HVAC Measures A few other Commercial Measures
DUKE UNIVERSITY DESIGN & CONSTRUCTION STANDARDS
 1 25 95 00 Integrated Automation Control Sequences for HVAC GENERAL The HVAC operational sequences in this guideline are commonly used by Duke University. They are being provided as a preferred design
SE7600E Series Application Guide
 SE7600E Series Application Guide Schneider Electric SE7600E Series RTU Controller with IAQ Control Application Guide CONTENTS Solution Overview 2 Product Overview 3 Features & Benefits 3 System Overview
May Hands-on Guidance. Measurable Results. SUPPLIER EFFICIENCY PROGRAM
 May 2015 Hands-on Guidance. Measurable Results. SUPPLIER EFFICIENCY PROGRAM REACHING OUTSIDE OUR WALLS WHAT A scalable education and training platform that helps suppliers reduce their energy use and costs
Advanced RTU Campaign Webinar June 17, 2013
 Advanced RTU Campaign Webinar June 17, 2013 Agenda Introductions Overview of the Advanced RTU Campaign Michael Deru Walgreens RTU Replacement Program Jason Robbins and Nirmal Sekhri Advanced Packaged Rooftop
Optimizing Cooling Performance Of a Data Center
 ASHRAE www.ashrae.org. Used with permission from ASHRAE Journal. This article may not be copied nor distributed in either paper or digital form without ASHRAE s permission. For more information about ASHRAE,
Trane mytest Water-cooled Chiller Performance Validation What you spec is what you get *
 Trane mytest Water-cooled Chiller Performance Validation What you spec is what you get * Trane CenTraVac chillers: Designed and built to be the best; tested to prove it Ongoing innovation. Unmatched capabilities.
Energy Action Plan 2015
 Energy Action Plan 2015 Purpose: In support of the Texas A&M University Vision 2020: Creating a Culture of Excellence and Action 2015: Education First Strategic Plan, the Energy Action Plan (EAP) 2015
Airside Economizer Comparing Different Control Strategies and Common Misconceptions
 ESL-IC-8-1-54 Airside Economizer Comparing Different Control Strategies and Common Misconceptions Jijun Zhou, PE Guanghua Wei, PE W. Dan Turner, PhD, PE David E. Claridge, PhD, PE Texas A&M University
SMART VENTILATION MANAGEMENT: CHANGING THE WAY WE THINK ABOUT VENTILATION
 SMART VENTILATION MANAGEMENT: CHANGING THE WAY WE THINK ABOUT VENTILATION VENTILATION: THE KEY TO HEALTHY & EFFICIENT BUILDINGS At Ventacity Systems we believe that ventilation deserves more attention
CT AEE 2018 Energy Trends Fair
 CT AEE 2018 Energy Trends Fair Bringing Fault Detection and Diagnosis (FDD) Tools into the Mainstream: Retro Commissioning & Continuous Commissioning of HVAC and Refrigeration Systems Dr. Amy Thompson
Is Data Center Free Cooling Feasible in the Middle East? By Noriel Ong, ASEAN Eng., PMP, ATD, PQP
 Is Data Center Free Cooling Feasible in the Middle East? By Noriel Ong, ASEAN Eng., PMP, ATD, PQP This case study will evaluate the feasibility of data center free cooling in the Middle East using indirect
A NEW RECIPE FOR HVAC SYSTEM PERFORMANCE & EFFICIENCY COOKING UP SAVINGS BY IMPROVING HVAC SYSTEM EFFICIENCY
 A NEW RECIPE FOR HVAC SYSTEM PERFORMANCE & EFFICIENCY COOKING UP SAVINGS BY IMPROVING HVAC SYSTEM EFFICIENCY 1 THE PANEL -John Lolmaugh -Director Brand Facilities -Jack in the Box & Qdoba -Jeremy Reefe
Silicon Valley Power Data Center Program Rebate Application
 Contact Information Tax Status (check one) Sole Proprietor Contact Name Phone Corporation Partnership Company Email address Government Not-For-Profit Customer/Facility Information Company Name SVP Account
Technology overview of THE CATALYST. march 16, 2016
 Technology overview of THE CATALYST march 16, 2016 L US Patent # 8,515,584 North America s Leading Efficiency Solution for Rooftop Packaged HVAC Systems Proven to reduce overall HVAC energy use by 25%-50%.
Advanced RTU Campaign Taking Action Toward Efficient RTUs Michael Deru February 25, 2014
 Advanced RTU Campaign Taking Action Toward Efficient RTUs Michael Deru February 25, 2014 RTUs cool over 60% of U.S. commercial building floor area Lots of 10 to 20 year old RTUs installed Why RTU s Are
WHAT IS THE DIGI-RTU South 59 th Street Omaha, NE bes-tech.net
 WHAT IS THE DIGI-RTU The Digi-RTU is a Heating, Ventilation, and Air Conditioning (HVAC) rooftop unit control kit that is both a demand management and energy usage device. It is designed to improve the
Airside Economizer Comparing Different Control Strategies and Common Misconceptions
 Airside Economizer Comparing Different Control Strategies and Common Misconceptions Jijun Zhou, PE Guanghua Wei, PE W. Dan Turner, PhD, PE David E. Claridge, PhD, PE Texas A&M University College Station,
Evaporative free air cooling technology Providing evaporative free air cooling solutions.
 Evaporative free air cooling technology Providing evaporative free air cooling solutions. Creating an effective workspace environment data centre free air cooling technology FreeCool - Evaporative Free
E e n rgy g y St S ud u y y Pr P og o r g ams December 2011
 Energy Study Programs December 2011 1 Agenda Energy Study Programs Overview Recommissioning Engineering Studies Data Center Studies Custom Rebates What makes a good energy study? 2 Energy Study Program
The Premium Economizer: An Idea Whose Time Has Come
 The Premium Economizer: An Idea Whose Time Has Come Reid Hart, Dan Morehouse, and Will Price, Eugene Water & Electric Board ABSTRACT Several field studies have found that more than half of outside air
Saving Energy and Reducing Costs Through Better Use of Building Automation Systems
 Session: Low/No Cost Solutions Through BAS Saving Energy and Reducing Costs Through Better Use of Building Automation Systems Mark M. Duszynski Johnson Controls Federal Systems August 9, 2016 Rhode Island
BAS Chillers 8/15/2016. Achieving Energy Savings with BAS and Data Analytics Guanjing Lin Lawrence Berkeley National Laboratory August 10, 2016
 Session 7: Building Automation and Operation Tools Outline Analytics Tools to Supplement BAS Achieving Energy Savings with BAS and Data Analytics Guanjing Lin Lawrence Berkeley National Laboratory August
EER Optimizer for DX Air Conditioners
 EER Optimizer for DX Air Conditioners Mike West, PhD, PE Advantek Consulting Engineering August 16, 2017 Tampa Convention Center Tampa, Florida EER Optimizer for DX Air Conditioners TOPICS Problems addressed
Expanding Efficiency Services and Advancing Utility Program Strategies with M&V 2.0
 Expanding Efficiency Services and Advancing Utility Program Strategies with M&V 2.0 Ellen Franconi, Rocky Mountain Institute 2018 ACEEE Efficiency as a Resource November 1, 2017 Measurement & Verification
Economizer Control 2-1
 HVAC Economizers 101 Section #2 Economizer Control Methods 2-1 Section #2 Economizer Control Methods Most Commonly Used Control Strategy Dry-bulb changeover Enthalpy changeover Differential dry bulb Differential
TRACE 700. Slide 1. Today, we will be talking about Airside Economizers in TRACE 700. Slide 2
 Slide 1 TRACE 700 Today, we will be talking about Airside Economizers in TRACE 700. Airside Economizers Slide 2 Learning Objectives Define airside economizing Discuss different airside economizer types
A NEW RECIPE FOR HVAC SYSTEM
 A NEW RECIPE FOR HVAC SYSTEM PERFORMANCE & EFFICIENCY COOKING UP SAVINGS BY IMPROVING HVAC SYSTEM EFFICIENCY THE PANEL John Lolmaugh Director Brand Facilities Jack in the Box & Qdoba Jeremy Reefe Program
Validation and Uncertainty Characterization for Energy Simulation
 Validation and Uncertainty Characterization for Energy Simulation Multi-Zone HVAC System using ORNL s Flexible Research Platform (FRP) For: ASHRAE SSPC140 June 26, 2016 PM: Joshua New PIs Piljae Im and
New Techniques for Energy-Efficient Data Center Cooling
 New Techniques for Energy-Efficient Data Center Cooling Applications for Large and Small Data Centers By Wally Phelps Director of Engineering AdaptivCOOL www.adaptivcool.com Copyright Degree Controls,
Running Your Data Center Under Ideal Temperature Conditions
 TECHNICAL BRIEF Mastering Data Center Environmental Controls to Help Drive Your Bottom Line Running Your Data Center Under Ideal Temperature Conditions Challenge Many data centers waste energy using inefficient
Data Centers. Powerful Solutions That Put You in Control. Energy Management Solutions. Where your energy dollars are used. 1
 Energy for What s Ahead SM Energy Management Solutions Data Centers Powerful Solutions That Put You in Control Ready to take a byte out of your data center energy use and become more cost-effcient? Data
What Could Possibly Go Wrong? A Laboratory Investigation of In-Field and Onboard FDD on a 5 Ton RTU
 What Could Possibly Go Wrong? A Laboratory Investigation of In-Field and Onboard FDD on a 5 Ton RTU 2014 ET Summit New Packaged HVAC System Sensors, Logic and Communications Tons of Potential October 21,
Annual Report for the Utility Savings Initiative
 Report to the North Carolina General Assembly Annual Report for the Utility Savings Initiative July 1, 2016 June 30, 2017 NORTH CAROLINA DEPARTMENT OF ENVIRONMENTAL QUALITY http://portal.ncdenr.org Page
Advanced RTU Campaign Technical Resources: Evaluating Performance December 10, 2013
 Advanced RTU Campaign Technical Resources: Evaluating Performance December 10, 2013 Agenda Overview of the Advanced RTU Campaign Resources for RTU Evaluation RTU Evaluation Application RTU Upgrade Case
The challenge is that BAS are often very complex with 1000s of data points to review. EMS Optimization Software
 EMS Optimization Software Often immediate energy savings can be achieved with proper set points, sequencing, scheduling and fault detection of the Building Automation System (BAS). The challenge is that
Efficiency Works Business: 2017 Rebates & Goals. January 17, 2017
 Efficiency Works Business: 2017 Rebates & Goals January 17, 2017 Platte River Power Authority provides electricity to Estes Park, Fort Collins, Longmont, and Loveland Substation Generation Coal / Natural
Xcel Energy s Small Building Tune-Up. Michelle Beaudoin, Product Manager
 Xcel Energy s Small Building Tune-Up Michelle Beaudoin, Product Manager Product Background Result of 2012 New Mexico Settlement Regulatory Approval CO May 2014 NM August 2014 Third Party Implemented 2
DR and EE Standards for SCE Buildings
 Design & Engineering Services DR and EE Standards for SCE Buildings Prepared by: Design & Engineering Services Customer Service Business Unit Southern California Edison December 2011 Acknowledgements Southern
Installation Service. 1.0 Executive Summary. Factory Trained Technician Train Customer Support Staff On Basic Operation Of The Equipment
 Installation Service Statement of Work Start-up Service for Cooling Start-up - 1 - Service for Cooling Service 1.0 Executive Summary Table of Contents 1.0 Executive Summary 2.0 Features & Benefits 3.0
Quarterly Report to the Pennsylvania Public Utility Commission
 Quarterly Report to the Pennsylvania Public Utility Commission For the Period September 1, 2012 through November 30, 2012 Program Year 4, Quarter 2 For Pennsylvania Act 129 of 2008 Energy Efficiency and
CARRIER edesign SUITE NEWS
 Welcome Welcome to the premier issue of EXchange, offering timely, informative and interesting news on the Carrier edesign Suite of Software. Delivered quarterly, each issue will provide a wealth of information
Committed to Energy Efficiency
 RESOLUTE Resolute Helps PNC Arena Reduce Energy Consumption and Costs While Improving Fan Comfort Lacking the visibility, real-time data and analytics needed to optimize facility performance and reduce
Developing an Action Plan: Building Energy Metering and Beyond
 Developing an Action Plan: Building Energy Metering and Beyond Angela Lewis, PE, PhD, LEED AP, FMP Project Manager Facility Engineering Associates (FEA) MANAGING CEUs AND CFM MAINTENANCE POINTS You are
Reducing Data Center Cooling Costs through Airflow Containment
 FEATURE Reducing Data Center Cooling Costs through Airflow Containment Implementing a containment solution in the data center costs much less than the alternatives of adding air handlers or other supplemental
Presentation. Guaranteed Energy Savings Performance Project
 Presentation Guaranteed Energy Savings Performance Project Greg Spiro, PE, CEM, LEED-AP Georgia Institute of Technology Senior Mechanical Engineer Facilities Design & Construction 470-351-9867151 6th Street
DATA CENTER AIR HANDLING COOLING SOLUTIONS
 DATA CENTER AIR HANDLING COOLING SOLUTIONS World-class performance and reliability from YORK As data storage and protection needs grow, so can costs and complexity. That s why having the right partner
Google s Green Data Centers: Network POP Case Study
 Google s Green Data Centers: Network POP Case Study Table of Contents Introduction... 2 Best practices: Measuring. performance, optimizing air flow,. and turning up the thermostat... 2...Best Practice
How to Get the Most out of Your Rooftop AC
 How to Get the Most out of Your Rooftop AC E360 Annual Conference Atlanta, Ga. April 11 Danny Miller President Transformative Wave RTUs serve 70% of the cooled commercial floor space in North America (~
Monitoring-Based Commissioning (MBCx) Early Results from a Portfolio of University Campus Projects
 Early Results from a Portfolio of University Campus Projects") 2006 National Conference on Building Commissioning Early Results from a Portfolio of University Campus Projects Karl Brown Deputy Director, California Institute for Energy and Environment University of
2006 National Conference on Building Commissioning Early Results from a Portfolio of University Campus Projects Karl Brown Deputy Director, California Institute for Energy and Environment University of
Our Local Affiliate Partner. Chillersplus.com
 Our Local Affiliate Partner Chillersplus.com Danny Miller, President Transformative Wave Technologies Kent, Washington www.transformativewave.com North America s Leading Energy Efficiency Solution for
Remote Monitoring. for Building HVAC Systems. A unique combination of human expertise and technology helps ensure optimum operation.
 Remote Monitoring SM for Building HVAC Systems A unique combination of human expertise and technology helps ensure optimum operation. For peace of mind: ProTech SM monitors HVAC systems 24 hours a day
Optimizing the Existing Building Cx Process:
 Optimizing the Existing Building Cx Process: Integrating EBCx into ESPCs Lia Webster, P.E. Senior Engineer Portland Energy Conservation, Inc. AIA Quality Assurance Learning Objectives 1. Identify ways
CASE STUDIES. Brevard Community College: Florida Power & Light. Cape Canaveral Air Force Station: NORESCO
 6 CASE STUDIES Brevard Community College: Florida Power & Light City of Miami Beach: Johnson Controls, Inc. Cape Canaveral Air Force Station: NORESCO Arbor Shoreline Office Park: Progress Energy Solutions
SPRING 2017 TRAINING PLYMOUTH, MN
 SPRING 2017 TRAINING PLYMOUTH, MN Auer Steel & Heating Supply Co. 865 Xenium Lane, 55441 Registration: http://www.auersteel.com/training/scheduled-classes/ NATE/EPA608 Certification Testing Multiple dates.
DATA CENTER EFFICIENCY: Data Center Temperature Set-point Impact on Cooling Efficiency
 DATA CENTER EFFICIENCY: Data Center Temperature Set-point Impact on Cooling Efficiency September 27 th, 2013 Tejas Desai, PE CEM CEA LEED AP Sameer Behere, PE CEM LEED AP Agenda Problem: Quick fixes can
CHAPTER/REGIONAL TECHNOLOGY AWARD - SHORT FORM
 CHAPTER/REGIONAL TECHNOLOGY AWARD - SHORT FORM 1. Category (Check one and indicate New or Existing, if applicable) Commercial Buildings New or Existing Institutional Buildings: Educational Facilities New
Daikin Blueprint: Five New Strategies to Reduce Operational Expenses for Air-cooled Chillers
 Daikin Blueprint: Five New Strategies to Reduce Operational Expenses for Air-cooled Chillers Explore financial impacts that can save your budget Commissioning cash-on-cash returns of 91% for existing buildings
Critical Facilities Existing Building Commissioning (EBCx)
") Critical Facilities Existing Building Commissioning (EBCx) Tony DiLeonardo LEED AP, CxA President Wick Fisher White Tracey Jumper CCP President Jump Start Building Commissioning, LLC AIA Quality Assurance
Critical Facilities Existing Building Commissioning (EBCx) Tony DiLeonardo LEED AP, CxA President Wick Fisher White Tracey Jumper CCP President Jump Start Building Commissioning, LLC AIA Quality Assurance
National Service Center
 UNITED TECHNOLOGIES CARRIER CORPORATION National Service Center MAXIMIZING PERFORMANCE AND LONGEVITY OF INDUSTRIAL CHILLERS Protection, Performance and Peace of Mind Because industrial chillers serve large
Introduction. To use Carrier wireless sensors, you must have: A i-vu v6.5 or later system v6-00 or later drivers
 Wireless Sensor CARRIER CORPORATION 2017 A member of the United Technologies Corporation family Stock symbol UTX Catalog No. 11-808-583-01 6/2/2017 Verify that you have the most current version of this
ENCLOSURE HEAT DISSIPATION
 ENCLOSURE HEAT DISSIPATION DATA CENTER SOLUTIONS A White Paper by Great Lakes Case & Cabinet Company www.werackyourworld.com 814.734.7303 Page 2 Introduction Dangerous heat levels inside an enclosure threaten
White Paper: Data Center Capacity Management Provides New Business Opportunities & Efficiency at State-of-the-Art One Wilshire June 8, 2017
 White Paper: Data Center Capacity Management Provides New Business Opportunities & Efficiency at State-of-the-Art One Wilshire June 8, 2017 As operators have demanded increasing levels of power density
Increased Cooling Demand Means More Energy Saving Opportunities. Wednesday, May 25 th, 2016
 Increased Cooling Demand Means More Energy Saving Opportunities Wednesday, May 25 th, 2016 AIA Provider: Colorado Green Building Guild Provider Number: 50111120 Increased Cooling Demand Means More Energy
FIELD SURVEY OF RTU FAN EFFICIENCY AND OPERATION PATTERNS
 Design & Engineering Services FIELD SURVEY OF RTU FAN EFFICIENCY AND OPERATION PATTERNS Report Prepared by: Design & Engineering Services Customer Service Business Unit Southern California Edison December
M E M O R A N D U M. Summary
 M E M O R A N D U M EUGENE WATER & ELECTRIC BOARD TO: FROM: Commissioners Helgeson, Brown, Mital, Simpson and Carlson Rod Price, Chief Engineering & Operations Officer Rene González, Customer Solutions
Evaluation of Energy Conservation Measures by Model Simulation
 Evaluation of Energy Conservation Measures by Model Simulation Tim Giebler. Mingsheng Liu, and David Claridge Energy Systems Laboratory Texas A&M University Abstract Numerous energy conservation measures
Retrofit Suppliers Workshop: Making the Effective Pitch December 4, :30am 12:00pm
 Retrofit Suppliers Workshop: Making the Effective Pitch December 4, 2013 8:30am 12:00pm DVIRC Overview DVIRC is a Non-Profit, Economic Development Organization focused on the manufacturing sector of Southeastern
Economizer Fault Detection and Diagnostics (FDD) for Built-Up Air Handlers Draft Report
 for Built-Up Air Handlers Draft Report") Economizer Fault Detection and Diagnostics (FDD) for Built-Up Air Handlers Draft Report Draft Code Language Last Updated: March 2017 1. INTRODUCTION The California Statewide Utility Codes and Standards
Economizer Fault Detection and Diagnostics (FDD) for Built-Up Air Handlers Draft Report Draft Code Language Last Updated: March 2017 1. INTRODUCTION The California Statewide Utility Codes and Standards
Current and Future Opportunities for Advanced C&I HVAC Systems. High Efficiency Heating RTUs National Symposium on Market Transformation
 Current and Future Opportunities for Advanced C&I HVAC Systems High Efficiency Heating RTUs 2017 National Symposium on Market Transformation Ryan Kerr, Emerging Technologies Manager Gas Technology Institute
ECONOMIZERS. Z1ECON30B-1 ECONOMIZER (Cat No. 10Z29) INSTALLATION INSTRUCTIONS FOR ECONOMIZERS USED WITH ZC,ZG,ZH UNITS CAUTION WARNING
 INSTALLATION INSTRUCTIONS FOR ECONOMIZERS USED WITH ZC,ZG,ZH UNITS CAUTION WARNING") Litho U.S.A. 2014 ECONOMIZERS 3/2014 Supersedes: New Z1ECON30B-1 ECONOMIZER (Cat No. 10Z29) INSTALLATION INSTRUCTIONS FOR ECONOMIZERS USED WITH ZC,ZG,ZH 092-150 UNITS Application The Z1ECON30B-1 economizer
Litho U.S.A. 2014 ECONOMIZERS 3/2014 Supersedes: New Z1ECON30B-1 ECONOMIZER (Cat No. 10Z29) INSTALLATION INSTRUCTIONS FOR ECONOMIZERS USED WITH ZC,ZG,ZH 092-150 UNITS Application The Z1ECON30B-1 economizer
Dip Switch settings.
 Smart Temp Australia P/L EC 02 Multifunction Module Instruction Manual Ver 1.0 Preface The EC 02 module is a dedicated companion module for exclusive use with the Smart Temp SMT 770 thermostat (firmware
Demand Impact Model User Manual
 Final Demand Impact Model User Manual Part of the Massachusetts Residential Retrofit and Low Income Program Area Evaluation June 2012 Prepared by: The Cadmus Group, Inc. Energy Services Division 720 SW
Specification and Design Catalog. Waterside Economizer
 Specification and Design Catalog Waterside Economizer Table of Contents Waterside Economizer Applications.................................................... 4 Application Notes..................................................................
Drives and motors. A guide to using variable speed drives and motors in data centres Meeting your Carbon Reduction Commitment (CRC)
") Drives and motors A guide to using variable speed drives and motors in data centres Meeting your Carbon Reduction Commitment (CRC) The power behind the data Private and public businesses, from banks to
Drives and motors A guide to using variable speed drives and motors in data centres Meeting your Carbon Reduction Commitment (CRC) The power behind the data Private and public businesses, from banks to
Energy Efficiency Retrofit Technologies for RTUs
 Energy Efficiency Retrofit Technologies for RTUs POTENTIAL RTU RETROFITS Retrofits proven to increase the energy efficiency and reduce operating costs Stated Goals of RTU Retrofit development (DOE): Optimize
The Future. Today. YZ MAGNETIC BEARING CENTRIFUGAL CHILLER
 The Future. Today. YZ MAGNETIC BEARING CENTRIFUGAL CHILLER YZ MAGNETIC BEARING CENTRIFUGAL CHILLER YORK YZ Magnetic Bearing Centrifugal Chiller The YORK YZ Magnetic Bearing Centrifugal Chiller is a revolutionary
SRP Energy Efficiency Program Update SWEEP Regional Energy Efficiency Workshop
 SRP Energy Efficiency Program Update SWEEP Regional Energy Efficiency Workshop November 13, 2008 1 Objectives of SRP Energy Efficiency (EE) Programs Reduce/defer generation resource needs Meet SRP s Sustainable
MEASURE MONITOR UNDERSTAND
 MEASURE MONITOR UNDERSTAND Presented by Alistair Hunt Energy Monitoring, Measurement metrics Where and What 1 History & Background Company Timeline 18 Years Comrac & Sinetica founded 15 Years Raritan Integration
Table of Contents. Executive Summary Site and Unit Background Chiller Chiller Appendix... 11
 Table of Contents Executive Summary... 3 Site and Unit Background... 5 Chiller 1... 6 Chiller 2... 9 Appendix... 11 A Vidaris Company 2 Executive Summary New York Blood Center s facility in Long Island