Colorado State University Bioinformatics Algorithms Assignment 6: Analysis of High- Throughput Biological Data Hamidreza Chitsaz, Ali Sharifi- Zarchi
|
|
|
- Kelley Phelps
- 6 years ago
- Views:
Transcription


1 Colorado State University Bioinformatics Algorithms Assignment 6: Analysis of High- Throughput Biological Data Hamidreza Chitsaz, Ali Sharifi- Zarchi Although a little- bit long, this is an easy exercise you need to perform some the analysis step- by- step as instructed. You do not require developing algorithms or writing programs; but at each step think about: What are we doing at this step? Why is it required? Be careful about the timing. For each mission you need to submit a series of steps in a batch, that takes a few minutes. But it takes a few hours or a few days to all of the jobs being processed. The exercise comes in two phases. In Warm- Up phase you learn the basic procedures on a toy dataset. For this phase, prepare a one page report describing the logic of the major steps, what did you learn, and what challenges or questions did you experience. During the Challenge phase you will experience the analysis of real RNAseq data. Our goal is to compare the gene expression profiles of breast cancer to the normal tissue, find differentially expressed genes, and see which biological processes are altered in breast cancer. As the results of this phase, prepare a report of one or two pages text + several figures and tables, in the same way you are writing your results for a scientific manuscript. Focus on most important findings, and try to discuss them scientifically. Provide any hypotheses if you have found any, and describe challenges in analysis of the data. Please don t hesitate to ask any questions via . Thank you! 1

2 Phase 1: Warming- up 1. Open Mission 1: Importing data 2. From the upper menu, select User, Register, and then register for a new account. 3. An will be sent to your account, click the activation link in the 4. Login to Galaxy from User menu, then Login (Just after registration you are automatically logged in, so you need this step in future usages). 5. Now we need to import a small RNA- seq data for the analysis. Open this url in a separate browser tab (of the same internet browser you are viewing Galaxy): rna- seq- analysis- exercise 6. Press the green (+) buttons of the first 4 datasets one by one, in the same order. This will import 4 RNA- seq datasets, two from human adrenal and two from brain into the Galaxy. After pressing each (+) button, you should wait for a new page, and then press return to the previous page. 2


, to see the fastq contents, including the")
3 7. Go back to the Galaxy tab in your web browser, and press the refresh button above the right panel (History), now you should view the 4 imported datasets in the history. 8. Press the View Data button of every dataset (with eye shape), to see the fastq contents, including the reads sequences and quality values. 3
, click the NGS: QC and manipulation, then")
, and then press Execute. 10.")
.")


4 9. Time to check the quality of data! From the left panel (Tools), click the NGS: QC and manipulation, then FastQC:Read QC, select the 1 st dataset (1: imported: adrenal_1.fastq), and then press Execute. 10. Do the same for the other datasets 2, 3, and 4, in the same order. 11. You should have 4 new records in the right panel (History). Wait for a while until their process is finished, so their color would be green. 12. Click on the view data buttons of each FastQC result to view the quality check results. For each, you will have a long report that shows different aspects of the quality of your data. Scroll your web page or click on each item in the summary to view the detailed report. 4

5 13. Try to understand a little bit about the items in the quality reports by searching web, or any other means! 5
6 Mission 2: Alignment & Visualization Now it s time to: align the read sequences to the reference genome, measure expression values of the genes and visualize it. 1. Login to the Galaxy. 2. From the Tools menu select NGS: RNA- seq, then select Tophat2. This tools aligns the short reads of RNA- seq to the reference genome, and finds to which location they belong. (For alignment of DNA short reads to the reference genome we use different tools like Bowtie2 or BWA). 3. The data we are using is paired- end (two reads of the two ends of every RNA fragment which is then converted to cdna). Hence select Paired- end as the first argument to Tophat2. Then select two fastq files belonging to the same tissue (i.e. brain). Tophat2 needs to have an idea about the average size of the reads when the data type is paired- end. For this purpose, we set 110 (bp) as the Mean Inner Distance between Mate Pairs, this information comes from the experiment performed for RNA- seq library preparation. We also require to indicate to which organism the reads belong, hence we set Human hg19 Canonical Female, since the RNA- seq belongs to a woman and most of the human works currently use hg19 as the reference assembly. Finally press Execute and do the same for the fastq files of the other tissue (i.e. adrenal). 6
 that are shown as different outputs in the history panel.")

7 4. Wait until tophat results are ready (you can see this from the History panel). 5. Each run of Tophat2 provides several results including a summary, insertions, deletions, splice junctions, and accepted hits (aligned reads) that are shown as different outputs in the history panel. See the results one by one using View data buttons. Try to understand a little bit about them. 6. When pressing View data button on accepted hits, it downloads the aligned reads as a file with extension.bam. Save it in a suitable folder, we need it later. This file is compressed and cannot be viewed. So we need to convert it to an uncompressed format called.sam file. 7. For this purpose, go to the NGS: SAM Tools from the Tools menu and select BAM- to- SAM. In each run select one of your accepted hits outputs and execute. 8. When the results of the last step are ready, first view them using the View data button. Try to understand a little bit about it. 7

8 8. Run IGV. From the upper left box, select Human hg19 and open the genome. If hg19 is not listed there, select More and then indicate hg From the Tools menu Run igvtools, a new window will appear. Select Count as the command, run the Browse button for the input file and select the.bam file that was downloaded for the accepted hits (in step 6 above). The output file will be automatically set as the input file name with extension.bam.tdf. Change the extension to.tdf. You can assign better names for the file (i.e. Brain.tdf and Adrenal.tdf). Select the maximum Zoom level (10) and press Run. Wait until it is finished (the progress is indicated in the Message area below Run button. Do the same for the other.bam file downloaded. Then close igvtools window. 8


9 10. In the main menu of IGV, go to the File, then Load from file, and open both.tdf files you have just created. In the location box, enter chr19:3,000,000-3,500,000 to focus in this region. In the left panel right click on the names of.tdf files and select Log scale. Identify a differentially expressed gene between Brain and Adrenal. 9
10 Mission 3: Differential Expression Analysis Time to perform differential expression analysis. This time we will do several steps all together, without waiting the results of each step prepared. After a few hours, the results of all will be prepared (hopefully!) 1. Login to the Galaxy. 2. From the Tools menu select NGS: RNA- seq, then select Cufflinks. This tool measures the expression level of each region (gene, isoform, etc.). As the first option (SAM or BAM file of aligned RNA- Seq reads) select the Tophat2 accepted hits on data 1, 2, leave the other parameters unchanged and press execute. Do the same for accepted hits of data 3, 4. 10
11 3. While the requests of the previous step are waiting to be processed, run the following steps (Don t wait for the previous results to be prepared): From NGS:RNA- seq, select Cuffmerge. This will merge the results of both Brain and Adrenal tissues, that is required for the next step. As the first parameter (GTF file produced by Cufflinks) select cufflinks results on one of your datasets (i.e. Adrenal, though it s not ready yet). Then press the Add new Additional GTF Input Files, a new (GTF file produced by Cufflinks) parameter will appear, where you can select cufflinks results on the other dataset (i.e. Brain. No matter if you select Adrenal or Brain as the first GTF file). Finally press execute. 4. Now select Cuffdiff from NGS:RNA- seq menu, to find out differentially expressed genes. For the first option (Transcripts) select the Cuffmerge results. There is a textbox that you can enter the Name of Condition 1, enter Adrenal and select Tophat2 accepted hits on Adrenal data as the Replicate 1 option. Name Condition 2 as Brain and select Tophat2 accepted hits of Brain as Replicate 1 data of Condition 2 (See the image below carefully). Then press execute. 11
12 5. Be patient until all results are prepared 12

13 Phase 2: The Challenge! Mission 1: Looking for data 1. Open ArrayExpress: In the search text box, search for: breast cancer normal 2. There would be around 503 results, so we need to narrow down them. In the Filter experiments menu, select Homo sapiens as Organism, RNA assay as experiment assay, and Sequencing assay as technique, and press Filter button. 4. Find the experiment titled mrna-sequencing of breast cancer subtypes and normal tissue. It seems a good experiment. Click on its Accession number (E-GEOD-52194) to see the experiment. In Samples section there is a link: Click for detailed sample information and links to data. Click on it to see the samples. 13

.")
14 5. In the following page you will see the 1-25 of 117 rows (samples). Set the page size to 250 to see all samples. The tumor type column shows whether each sample is a type of breast cancer tumor, or normal tissue. The FASTQ column shows the links to download FASTQ files for each sample. Also the processed column contains the processed data (gene expression levels) for each sample. 6. Below the whole table there is a link: Download Samples and Data table in Tab-delimited format. Right click on it and select Save target as or Save linked file as (depending on the web browser you use it might be different). Save the data table on your computer and open it with Microsoft Excel or some other spreadsheet software. You might need to rename the file to.xls before opening it with Excel. 7. There is a column Characteristics [tumor type] in the excel file that again shows you whether the sample is a normal tissue, or breast cancer. Randomly select one normal sample, and one tumor sample. There are different tumor subtypes, no matter which of them you select. But please do your selection randomly not the same set that you know is selected by your friends. 14
![8. In the column Comment [ENA_EXPERIMENT] you can find the accession numbers of your selected samples](/docs-images/74/70242800/images/15-0.jpg "(SRX followed by a 6 digits number). Note the ENA numbers of the samples you have selected. 9.")


15 8. In the column Comment [ENA_EXPERIMENT] you can find the accession numbers of your selected samples (SRX followed by a 6 digits number). Note the ENA numbers of the samples you have selected. 9. Login to the Galaxy. Above the History panel there is a History options button with a gear icon. Press it and select Create New to make a new history something like a new project. The initial name will be Unnamed history. Click on it and rename it to Breast Cancer RNA-Seq Analysis. 10. In the Tools menu, select Get Data and then EBI SRA. Enter the ENA accession number of the Normal sample you have selected and press Search. 15

16 11. You will see a window with brief information about the experiment, including Model of the sequencing platform (Illumina HiSeq 2000) and Library Layout which is PAIRED, that means you have paired reads for each RNA fragment. 12. Below it, you will find another table showing individual samples. You should see a single record; with the same ENA number you have searched in the Experiment accession column. If you want to download the Fastq files you should press the links in Fastq files (ftp) column. However we need to analyze them with Galaxy, hence locate the Fastq files (galaxy) column. You should see two links, belonging to the pair of reads (if you less or more files, choose a different sample). Press the first link File 1. This will add a new job in the History panel of the Galaxy which downloads the first Fastq file. 13. Press the Back button of your web browser once and wait a few seconds, or go again to the EBI SRA and search the ENA accession number. This time select File 2, a new job will be added to the History accordingly. 16

 and press Save. 15. Do the steps 10-14 for the tumor sample you have selected.")

17 14. In the History panel, for each job there is a button Edit attributes with a pencil icon. Click on that, and set the Name of your data jobs as Normal Breast 1 and Normal Breast 2. Also in the Info text box, enter the ENA accession number of each sample type, this will let you to know the source of data in the future (The accession number you should enter is different from SRX I have entered in this picture!) and press Save. 15. Do the steps for the tumor sample you have selected. Set their names to Cancer Breast 1 and Cancer Breast 2. Wait until all of your data are downloaded. It might take a few minutes. 16. There is a possibility that the data you have selected is not available in fastq format, or the file server is not available at that moment. In this situation the job will be failed, and the color will turn red. Delete those data (both paired files of the same sample), select another sample ENA number and do the steps above again, until you have four data files successfully available. 17
, group as Genes and Gene Predictions, set the track to RefSeq genes and table to refflat.")

18 17. We need one addition data: the annotation of the human genes. Go to the Tools panel, then Get Data, then UCSC Main. Leave the genome as Human, assembly as Feb (GRCh37/hg19), group as Genes and Gene Predictions, set the track to RefSeq genes and table to refflat. Also set the output format as GTF gene transfer format and leave Send output to Galaxy checked (if you wanted to download the file to your computer you would need to fill the output file name). Press get output, and then Send query to galaxy. The new job of the history will download the gene annotations. 18. In the search menu of the Tools panel, search fastq groomer. Select the FASTQ Groomer tool, select your first FASTQ data as File to groom, and Sanger and Illumina 1.8+ as Input FASTQ quality scores type. Press Execute, and do the same for other 3 Fastq data you have added. 18

19 19. You don t need to wait the FASTQ Groomer jobs to be finished. In the search box of tools menu, enter fastqc to show FastQC: Read QC. Run it, select the results of FASTQ Groomer on data 1 and press execute. Do the same for the results of FASTQ Groomer on the other data files. These jobs will be queued and will run after the Fastq Groomer jobs are finished. 20. See my history in this picture. Now I have 4 FastQ jobs that are waiting for FASTQ Groomer jobs results. The 4 FASTQ Groomer jobs are still running (yellow) and all Get Data jobs are already finished successfully (green). While my top jobs is number 16, your job numbers might be different, since I had 2 failed Get Data jobs and I had to delete them and get another sample. 21. Wait until FastQC jobs are finished. In the future exercise we will see the results of FastQC and decide about trimming data or alignment without trimming accordingly. 19
 use FASTQ Trimmer to remove the ends with poor quality.")
20 Mission 2: Quality Control & Alignment 1. Login to the Galaxy. The FastQC results should be ready now. Click the View data button to check the quality results of each data. Pay special attention to the Per base sequence quality. If the quality for some part of a dataset is too poor (i.e. below 20) use FASTQ Trimmer to remove the ends with poor quality. For my data, it seems fine. 2. See the other sections of FastQC quality results. For example look at Per base sequence content which is the average appearance of each nucleotide in each position of all reads. Since our reads are of length 60 there are 60 columns. I see higher CG than AT in my selected dataset. What about you? How do you interpret these results? 20


21 3. Now we want to align RNA-seq reads to the reference genome. From Tools panel run Tophat2, select Paired-end, select the FASTQ Groomer results for the normal reads, select the Human hg19 reference genome, leave the other parameters unchanged and press Execute. We did not modify the Mean distance between the reads because it is not indicated along with the dataset. Do the same for cancer data. 21

22 4. Without waiting for Tophat results to be prepared, we continue to Cufflinks. Using Cufflinks we will quantify the expression levels of the genes. From the Tools menu select Cufflinks, in SAM or BAM file select the Tophat accepted hits for your normal data, change Use Reference Annotation to Use reference annotation, select UCSC Main on Human: refflat (genome) as your reference annotation and press Execute. Do the same for tophat results of cancer samples. Remember that the reference we are using is the same refflat annotation of all human genes we obtained from the UCSC Table Browser. If we don t use this gene annotations, Cufflinks would not know the name or positions of the genes, to quantify their expression levels. 5. Now we want to find differentially expressed genes. Without waiting the cufflinks results to be ready, run Cuffdiff from the Tools menu, select the same UCSC annotation of human genes ( UCSC Main on Human: refflat (genome) ) as the Transcripts, set Normal as the name of Condition 1 and select Tophat result for normal cells as the Replicate 1 for Condition 1. Set Cancer as the name of Condition 2 and select the related Tophat results of cancer cells. Press Execute. 6. Drink a cup of tea, and have a long rest (maybe a few days) until the results are ready 22
23 Mission 3: Differential Expression Analysis 1. We will start with Tophat2 results, which starts with a record in the History panel named: Tophat2 on data X and data Y: alignment_summary where X and Y are numbers. Select alignment summary for normal cells. Click the view data button to see the results. Here are my results. As you see 93.5% of single reads are aligned, with 83.2% of them having concordant pair-alignment (both single reads of the pair are aligned in an acceptable distance). Multiple alignment occurs for reads or pairs that we are not sure about their correct alignment position in the genome. As you see, there are 14.7% multiple aligned pairs in normal cells. 2. Now have a look over Tophat2 alignment summary of cancer cells. As you see below, there is a far distance with results of normal cells. The pairs with multiple alignment rate has increased for pairs to 71.1% which is too high, and concordant pair alignment rate has fallen to 65.1%. So there should be a problem. 23

24 3. To find out what s the problem with cancer cells data, have a look back at the FastQC results of all 4 data files (as we did in steps 1 and 2 of the RNAseq analysis Part 2 exercise). The main difference for my case was the length of reads: The reads are 75 bp for normal cells, while 60 bp long for cancer cells. Also the quality is higher for normal reads, particularly the right ends of reads. It s very natural that longer and higher quality reads are aligned better with less multiple alignments, and this is something with the data that we cannot easily fix it. A suggestion can be trimming right ends of cancer cells, but this makes cancer reads even shorter: Normal Cells Cancer Cells 24


25 4. There is a big difference between Overrepresented sequences section of cells in my data. While there are no overrepresented sequences in normal data, cancer data shows several overrepresented sequences, some of them are Illumina paired end PCR primers, as below: 25

, log2(fold_change) which")
26 5. A necessary step to have more accurate and reliable results would be to use FASTQ Quality Trimmer, Trim sequences and Clip adapter sequences tools from NGS: QC and manipulation section of Tools menu to remove these sequencing problems of the data. You can try it later and compare your Tophat2 alignment with the current results. For now, let s continue with our alignments. 6. Now we look at the differential expression analysis. Locate Cuffdiff on data X, data Y, and data Z: gene differential expression testing in the history panel, and press view data button. There are several columns, including gene ID and location, value_1 and value_2 which represent the expression values of each gene in normal and cancer cell types (in FPKM), log2(fold_change) which shows the expression change of gene in log2 scale, p_value which is the p-value of change, q-value which is the adjusted p-value (Hence we must use q-value for analysis of significance, not the p-value), and also a significant column that shows if the gene has significant differential expression between normal can cancer, or not. 7. Click on the same record in History menu, and then on Download button (with Disk icon) to download your differential analysis results. It should download a file with extension.tabular to your computer. 26
27 8. Download and install the statistical language R, which is widely used for bioinformatics analysis ( Also download and install RStudio, a development environment for R ( Run RStudio. Read the downloaded file using the following command (You should change YOURPATH and YOURFILE according to the path and name of downloaded file) x <- read.delim( YOURPATH/YOURFILE.tabular ) 9. Since log2(fold_change) value is not defined for many genes, we will define a new logfc value by the following command: x$logfc <- log2(x$value_2+1)-log2(x$value_1+1) 10. First find out genes having logfc > 2 (4-fold changes upregulation in cancer cells), and also logfc < -2 (4-fold changes upregulation in normal cells), by following commands: y <- subset(x, logfc > 2) write.table(y,file="yourpath/cancer.xls",sep="\t",quote=f,row.names=f) z <- subset(x, logfc < -2) write.table(y,file="yourpath/normal.xls",sep="\t",quote=f,row.names=f) 27

 you can relax the condition (e.g. logfc > 1 and logfc < -1). Also if there are too many genes (more than 2000) you can use more stringent conditions. 1. Now select the gene symbols (gene names or gene_id) of the filtered genes and copy them.")
28 Mission 4: Gene Ontology and Pathway Analysis So far, we have two lists of genes, one of them being over-expressed and the other list being under-expressed in cancer, compared to the normal cells. But what are the functions of these genes in the cells? Which parts of the biological pathways in the cells are changed in cancer? These are the questions to answer during this mission. We will repeat the following steps on each of the two gene lists: once for the genes with logfc > 2, the other time for the genes having logfc < -2. If there are too few genes (less than 100) you can relax the condition (e.g. logfc > 1 and logfc < -1). Also if there are too many genes (more than 2000) you can use more stringent conditions. 1. Now select the gene symbols (gene names or gene_id) of the filtered genes and copy them. Open david ( In the left panel (shortcut to DAVID tools) press Functional Annotation. Paste the gene symbols in box A (Paste a list), select OFFICIAL_GENE_SYMBOL in Step 2: Select Identifier, select Gene List in Step 3: List Type and press Submit List. 2. Depending of how recognized are the gene symbols of your dataset by david, it might show you different results. Usually it asks you to select species in the next step, when done you need to press Select Species button. If most of your gene symbols are not recognized by David, it might request you to convert your gene list to a recognized alternative, that is also straightforward. Pay attention to the number of genes recognized by david. It will not work very well if you have too few genes (i.e. less than 50) or too many genes (i.e. more than 2000). In such cases you might need to change the data or the groups of comparison, or the level of stringency in defining significantly differentially expressed genes. 28

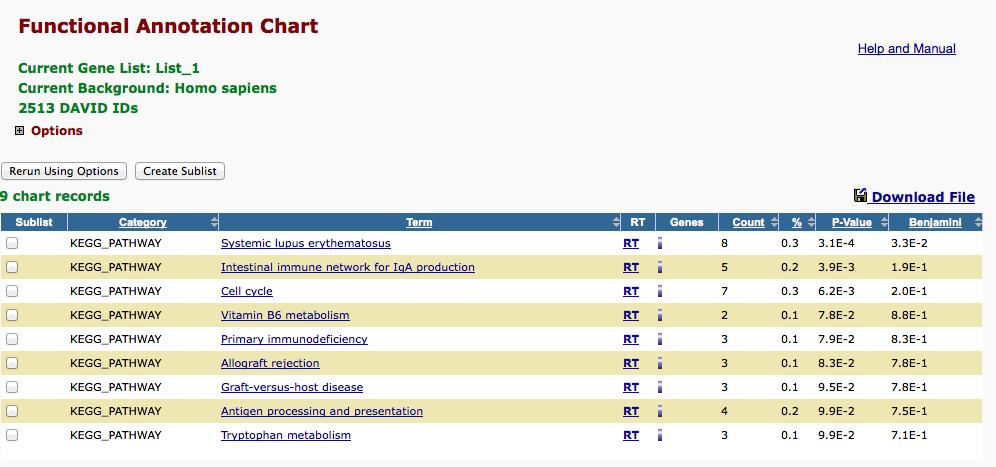
29 3. Press Functional Annotation Clustering button. A new window will appear that shows you the results. 4. In the David functional annotation clustering table, the second column shows the biological process/molecular function or cellular position that is overrepresented in your list of genes. The Count column shows the number of genes in your selection that match that biological process or function. Also the Benjamini column shows the significance of the results, you can consider values less than 5E-2 (0.05) as significant. For instance below you can see the results of the genes overexpressed in breast cancer cells. The cell cycle and cell division biological processes are significantly overrepresented in this gene set. If you press the bar in each row you will be shown the genes involved in that biological process, that appear in your list. Do the steps 15 to 19 for the genes overexpressed in the second group also. 29

, and see the pathways one by one.")
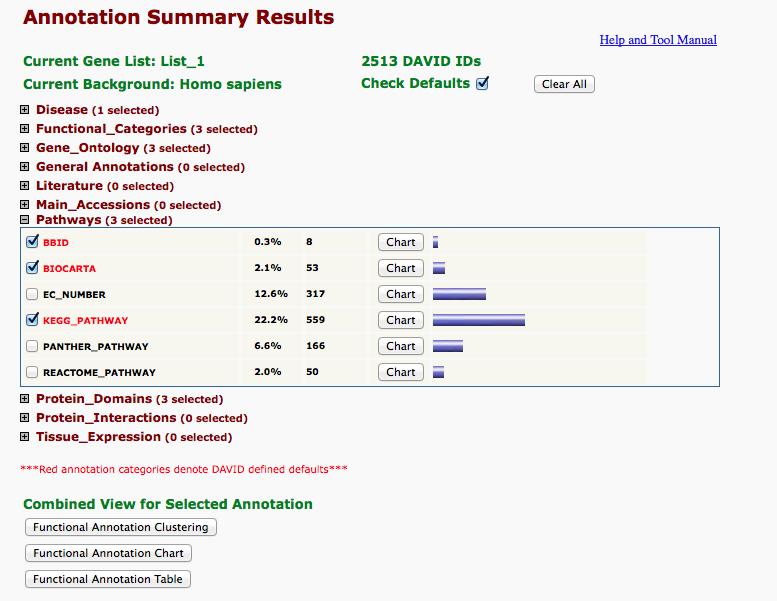
30 11. In addition to pressing the Functional Annotation Clustering button, explore the other results of David. Particularly expand the Pathways item, press the Chart button of each pathway database (for instance KEGG_PATHWAY), and see the pathways one by one. Save some of the pathways you are interested, that believe are relevant to your differential expression analysis. 30
31 31
32 Good luck! The End. 32
ChIP-seq hands-on practical using Galaxy
 ChIP-seq hands-on practical using Galaxy In this exercise we will cover some of the basic NGS analysis steps for ChIP-seq using the Galaxy framework: Quality control Mapping of reads using Bowtie2 Peak-calling
RNA-Seq Analysis With the Tuxedo Suite
 June 2016 RNA-Seq Analysis With the Tuxedo Suite Dena Leshkowitz Introduction In this exercise we will learn how to analyse RNA-Seq data using the Tuxedo Suite tools: Tophat, Cuffmerge, Cufflinks and Cuffdiff.
ChIP-Seq Tutorial on Galaxy
 1 Introduction ChIP-Seq Tutorial on Galaxy 2 December 2010 (modified April 6, 2017) Rory Stark The aim of this practical is to give you some experience handling ChIP-Seq data. We will be working with data
Galaxy workshop at the Winter School Igor Makunin
 Galaxy workshop at the Winter School 2016 Igor Makunin i.makunin@uq.edu.au Winter school, UQ, July 6, 2016 Plan Overview of the Genomics Virtual Lab Introduce Galaxy, a web based platform for analysis
Dr. Gabriela Salinas Dr. Orr Shomroni Kaamini Rhaithata
 Analysis of RNA sequencing data sets using the Galaxy environment Dr. Gabriela Salinas Dr. Orr Shomroni Kaamini Rhaithata Microarray and Deep-sequencing core facility 30.10.2017 RNA-seq workflow I Hypothesis
Galaxy Platform For NGS Data Analyses
 Galaxy Platform For NGS Data Analyses Weihong Yan wyan@chem.ucla.edu Collaboratory Web Site http://qcb.ucla.edu/collaboratory Collaboratory Workshops Workshop Outline ü Day 1 UCLA galaxy and user account
NGS Analysis Using Galaxy
 NGS Analysis Using Galaxy Sequences and Alignment Format Galaxy overview and Interface Get;ng Data in Galaxy Analyzing Data in Galaxy Quality Control Mapping Data History and workflow Galaxy Exercises
RNA-seq. Manpreet S. Katari
 RNA-seq Manpreet S. Katari Evolution of Sequence Technology Normalizing the Data RPKM (Reads per Kilobase of exons per million reads) Score = R NT R = # of unique reads for the gene N = Size of the gene
RNA-Seq in Galaxy: Tuxedo protocol. Igor Makunin, UQ RCC, QCIF
 RNA-Seq in Galaxy: Tuxedo protocol Igor Makunin, UQ RCC, QCIF Acknowledgments Genomics Virtual Lab: gvl.org.au Galaxy for tutorials: galaxy-tut.genome.edu.au Galaxy Australia: galaxy-aust.genome.edu.au
TP RNA-seq : Differential expression analysis
 TP RNA-seq : Differential expression analysis Overview of RNA-seq analysis Fusion transcripts detection Differential expresssion Gene level RNA-seq Transcript level Transcripts and isoforms detection 2
How to store and visualize RNA-seq data
 How to store and visualize RNA-seq data Gabriella Rustici Functional Genomics Group gabry@ebi.ac.uk EBI is an Outstation of the European Molecular Biology Laboratory. Talk summary How do we archive RNA-seq
ChIP-seq hands-on practical using Galaxy
 ChIP-seq hands-on practical using Galaxy In this exercise we will cover some of the basic NGS analysis steps for ChIP-seq using the Galaxy framework: Quality control Mapping of reads using Bowtie2 Peak-calling
Tutorial. RNA-Seq Analysis of Breast Cancer Data. Sample to Insight. November 21, 2017
 RNA-Seq Analysis of Breast Cancer Data November 21, 2017 Sample to Insight QIAGEN Aarhus Silkeborgvej 2 Prismet 8000 Aarhus C Denmark Telephone: +45 70 22 32 44 www.qiagenbioinformatics.com AdvancedGenomicsSupport@qiagen.com
David Crossman, Ph.D. UAB Heflin Center for Genomic Science. GCC2012 Wednesday, July 25, 2012
 David Crossman, Ph.D. UAB Heflin Center for Genomic Science GCC2012 Wednesday, July 25, 2012 Galaxy Splash Page Colors Random Galaxy icons/colors Queued Running Completed Download/Save Failed Icons Display
BGGN-213: FOUNDATIONS OF BIOINFORMATICS (Lecture 14)
") BGGN-213: FOUNDATIONS OF BIOINFORMATICS (Lecture 14) Genome Informatics (Part 1) https://bioboot.github.io/bggn213_f17/lectures/#14 Dr. Barry Grant Nov 2017 Overview: The purpose of this lab session is
BGGN-213: FOUNDATIONS OF BIOINFORMATICS (Lecture 14) Genome Informatics (Part 1) https://bioboot.github.io/bggn213_f17/lectures/#14 Dr. Barry Grant Nov 2017 Overview: The purpose of this lab session is
Analyzing ChIP- Seq Data in Galaxy
 Analyzing ChIP- Seq Data in Galaxy Lauren Mills RISS ABSTRACT Step- by- step guide to basic ChIP- Seq analysis using the Galaxy platform. Table of Contents Introduction... 3 Links to helpful information...
Mapping RNA sequence data (Part 1: using pathogen portal s RNAseq pipeline) Exercise 6
 Exercise 6") Mapping RNA sequence data (Part 1: using pathogen portal s RNAseq pipeline) Exercise 6 The goal of this exercise is to retrieve an RNA-seq dataset in FASTQ format and run it through an RNA-sequence analysis
Mapping RNA sequence data (Part 1: using pathogen portal s RNAseq pipeline) Exercise 6 The goal of this exercise is to retrieve an RNA-seq dataset in FASTQ format and run it through an RNA-sequence analysis
Services Performed. The following checklist confirms the steps of the RNA-Seq Service that were performed on your samples.
 Services Performed The following checklist confirms the steps of the RNA-Seq Service that were performed on your samples. SERVICE Sample Received Sample Quality Evaluated Sample Prepared for Sequencing
Copyright 2014 Regents of the University of Minnesota
 Quality Control of Illumina Data using Galaxy Contents September 16, 2014 1 Introduction 2 1.1 What is Galaxy?..................................... 2 1.2 Galaxy at MSI......................................
Copyright 2014 Regents of the University of Minnesota
 Quality Control of Illumina Data using Galaxy August 18, 2014 Contents 1 Introduction 2 1.1 What is Galaxy?..................................... 2 1.2 Galaxy at MSI......................................
NGS FASTQ file format
 NGS FASTQ file format Line1: Begins with @ and followed by a sequence idenefier and opeonal descripeon Line2: Raw sequence leiers Line3: + Line4: Encodes the quality values for the sequence in Line2 (see
Maize genome sequence in FASTA format. Gene annotation file in gff format
 Exercise 1. Using Tophat/Cufflinks to analyze RNAseq data. Step 1. One of CBSU BioHPC Lab workstations has been allocated for your workshop exercise. The allocations are listed on the workshop exercise
Cyverse tutorial 1 Logging in to Cyverse and data management. Open an Internet browser window and navigate to the Cyverse discovery environment:
 Cyverse tutorial 1 Logging in to Cyverse and data management Open an Internet browser window and navigate to the Cyverse discovery environment: https://de.cyverse.org/de/ Click Log in with your CyVerse
mrna-seq Basic processing Read mapping (shown here, but optional. May due if time allows) Gene expression estimation
 Gene expression estimation") mrna-seq Basic processing Read mapping (shown here, but optional. May due if time allows) Tophat Gene expression estimation cufflinks Confidence intervals Gene expression changes (separate use case) Sample
mrna-seq Basic processing Read mapping (shown here, but optional. May due if time allows) Tophat Gene expression estimation cufflinks Confidence intervals Gene expression changes (separate use case) Sample
Goal: Learn how to use various tool to extract information from RNAseq reads. 4.1 Mapping RNAseq Reads to a Genome Assembly
 ESSENTIALS OF NEXT GENERATION SEQUENCING WORKSHOP 2014 UNIVERSITY OF KENTUCKY AGTC Class 4 RNAseq Goal: Learn how to use various tool to extract information from RNAseq reads. Input(s): magnaporthe_oryzae_70-15_8_supercontigs.fasta
ChIP-seq practical: peak detection and peak annotation. Mali Salmon-Divon Remco Loos Myrto Kostadima
 ChIP-seq practical: peak detection and peak annotation Mali Salmon-Divon Remco Loos Myrto Kostadima March 2012 Introduction The goal of this hands-on session is to perform some basic tasks in the analysis
NGS Data Visualization and Exploration Using IGV
 1 What is Galaxy Galaxy for Bioinformaticians Galaxy for Experimental Biologists Using Galaxy for NGS Analysis NGS Data Visualization and Exploration Using IGV 2 What is Galaxy Galaxy for Bioinformaticians
Tutorial 1: Exploring the UCSC Genome Browser
 Last updated: May 12, 2011 Tutorial 1: Exploring the UCSC Genome Browser Open the homepage of the UCSC Genome Browser at: http://genome.ucsc.edu/ In the blue bar at the top, click on the Genomes link.
Goal: Learn how to use various tool to extract information from RNAseq reads.
 ESSENTIALS OF NEXT GENERATION SEQUENCING WORKSHOP 2017 Class 4 RNAseq Goal: Learn how to use various tool to extract information from RNAseq reads. Input(s): Output(s): magnaporthe_oryzae_70-15_8_supercontigs.fasta
Helpful Galaxy screencasts are available at:
 This user guide serves as a simplified, graphic version of the CloudMap paper for applicationoriented end-users. For more details, please see the CloudMap paper. Video versions of these user guides and
Importing your Exeter NGS data into Galaxy:
 Importing your Exeter NGS data into Galaxy: The aim of this tutorial is to show you how to import your raw Illumina FASTQ files and/or assemblies and remapping files into Galaxy. As of 1 st July 2011 Illumina
Using the Galaxy Local Bioinformatics Cloud at CARC
 Using the Galaxy Local Bioinformatics Cloud at CARC Lijing Bu Sr. Research Scientist Bioinformatics Specialist Center for Evolutionary and Theoretical Immunology (CETI) Department of Biology, University
INF-BIO5121/ Oct 7, Analyzing mirna data using Lifeportal PRACTICALS
 INF-BIO5121/9121 - Oct 7, 2014 Analyzing mirna data using Lifeportal PRACTICALS In this experiment we have mirna data from the livers of baboons (Papio Hamadryas) before and after they are given a high
Protocol: peak-calling for ChIP-seq data / segmentation analysis for histone modification data
 Protocol: peak-calling for ChIP-seq data / segmentation analysis for histone modification data Table of Contents Protocol: peak-calling for ChIP-seq data / segmentation analysis for histone modification
CLC Server. End User USER MANUAL
 CLC Server End User USER MANUAL Manual for CLC Server 10.0.1 Windows, macos and Linux March 8, 2018 This software is for research purposes only. QIAGEN Aarhus Silkeborgvej 2 Prismet DK-8000 Aarhus C Denmark
ITMO Ecole de Bioinformatique Hands-on session: smallrna-seq N. Servant 21 rd November 2013
 ITMO Ecole de Bioinformatique Hands-on session: smallrna-seq N. Servant 21 rd November 2013 1. Data and objectives We will use the data from GEO (GSE35368, Toedling, Servant et al. 2011). Two samples were
Using Galaxy for NGS Analyses Luce Skrabanek
 Using Galaxy for NGS Analyses Luce Skrabanek Registering for a Galaxy account Before we begin, first create an account on the main public Galaxy portal. Go to: https://main.g2.bx.psu.edu/ Under the User
Accessible, Transparent and Reproducible Analysis with Galaxy
 Accessible, Transparent and Reproducible Analysis with Galaxy Application of Next Generation Sequencing Technologies for Whole Transcriptome and Genome Analysis ABRF 2013 Saturday, March 2, 2013 Palm Springs,
RNA-seq Data Analysis
 Seyed Abolfazl Motahari RNA-seq Data Analysis Basics Next Generation Sequencing Biological Samples Data Cost Data Volume Big Data Analysis in Biology تحلیل داده ها کنترل سیستمهای بیولوژیکی تشخیص بیماریها
Sequence Analysis Pipeline
 Sequence Analysis Pipeline Transcript fragments 1. PREPROCESSING 2. ASSEMBLY (today) Removal of contaminants, vector, adaptors, etc Put overlapping sequence together and calculate bigger sequences 3. Analysis/Annotation
A short Introduction to UCSC Genome Browser
 A short Introduction to UCSC Genome Browser Elodie Girard, Nicolas Servant Institut Curie/INSERM U900 Bioinformatics, Biostatistics, Epidemiology and computational Systems Biology of Cancer 1 Why using
Single/paired-end RNAseq analysis with Galaxy
 October 016 Single/paired-end RNAseq analysis with Galaxy Contents: 1. Introduction. Quality control 3. Alignment 4. Normalization and read counts 5. Workflow overview 6. Sample data set to test the paired-end
Ensembl RNASeq Practical. Overview
 Ensembl RNASeq Practical The aim of this practical session is to use BWA to align 2 lanes of Zebrafish paired end Illumina RNASeq reads to chromosome 12 of the zebrafish ZV9 assembly. We have restricted
de.nbi and its Galaxy interface for RNA-Seq
 de.nbi and its Galaxy interface for RNA-Seq Jörg Fallmann Thanks to Björn Grüning (RBC-Freiburg) and Sarah Diehl (MPI-Freiburg) Institute for Bioinformatics University of Leipzig http://www.bioinf.uni-leipzig.de/
Introduction to Cancer Genomics
 Introduction to Cancer Genomics Gene expression data analysis part I David Gfeller Computational Cancer Biology Ludwig Center for Cancer research david.gfeller@unil.ch 1 Overview 1. Basic understanding
Using Galaxy: RNA-seq
 Using Galaxy: RNA-seq Stanford University September 23, 2014 Jennifer Hillman-Jackson Galaxy Team Penn State University http://galaxyproject.org/ The Agenda Introduction RNA-seq Example - Data Prep: QC
NGS : reads quality control
 NGS : reads quality control Data used in this tutorials are available on https:/urgi.versailles.inra.fr/download/tuto/ngs-readsquality-control. Select genome solexa.fasta, illumina.fastq, solexa.fastq
RNASeq2017 Course Salerno, September 27-29, 2017
 RNASeq2017 Course Salerno, September 27-29, 2017 RNA- seq Hands on Exercise Fabrizio Ferrè, University of Bologna Alma Mater (fabrizio.ferre@unibo.it) Hands- on tutorial based on the EBI teaching materials
Analyzing Variant Call results using EuPathDB Galaxy, Part II
 Analyzing Variant Call results using EuPathDB Galaxy, Part II In this exercise, we will work in groups to examine the results from the SNP analysis workflow that we started yesterday. The first step is
Exercise 2: Browser-Based Annotation and RNA-Seq Data
 Exercise 2: Browser-Based Annotation and RNA-Seq Data Jeremy Buhler July 24, 2018 This exercise continues your introduction to practical issues in comparative annotation. You ll be annotating genomic sequence
Illumina Next Generation Sequencing Data analysis
 Illumina Next Generation Sequencing Data analysis Chiara Dal Fiume Sr Field Application Scientist Italy 2010 Illumina, Inc. All rights reserved. Illumina, illuminadx, Solexa, Making Sense Out of Life,
Introduction to Read Alignment. UCD Genome Center Bioinformatics Core Tuesday 15 September 2015
 Introduction to Read Alignment UCD Genome Center Bioinformatics Core Tuesday 15 September 2015 From reads to molecules Why align? Individual A Individual B ATGATAGCATCGTCGGGTGTCTGCTCAATAATAGTGCCGTATCATGCTGGTGTTATAATCGCCGCATGACATGATCAATGG
Genome Browsers - The UCSC Genome Browser
 Genome Browsers - The UCSC Genome Browser Background The UCSC Genome Browser is a well-curated site that provides users with a view of gene or sequence information in genomic context for a specific species,
Advanced UCSC Browser Functions
 Advanced UCSC Browser Functions Dr. Thomas Randall tarandal@email.unc.edu bioinformatics.unc.edu UCSC Browser: genome.ucsc.edu Overview Custom Tracks adding your own datasets Utilities custom tools for
Aligners. J Fass 21 June 2017
 Aligners J Fass 21 June 2017 Definitions Assembly: I ve found the shredded remains of an important document; put it back together! UC Davis Genome Center Bioinformatics Core J Fass Aligners 2017-06-21
Welcome to MAPHiTS (Mapping Analysis Pipeline for High-Throughput Sequences) tutorial page.
 tutorial page.") Welcome to MAPHiTS (Mapping Analysis Pipeline for High-Throughput Sequences) tutorial page. In this page you will learn to use the tools of the MAPHiTS suite. A little advice before starting : rename your
Welcome to MAPHiTS (Mapping Analysis Pipeline for High-Throughput Sequences) tutorial page. In this page you will learn to use the tools of the MAPHiTS suite. A little advice before starting : rename your
High-throughout sequencing and using short-read aligners. Simon Anders
 High-throughout sequencing and using short-read aligners Simon Anders High-throughput sequencing (HTS) Sequencing millions of short DNA fragments in parallel. a.k.a.: next-generation sequencing (NGS) massively-parallel
version /1/2011 Source code Linux x86_64 binary Mac OS X x86_64 binary
 Cufflinks RNA-Seq analysis tools - Getting Started 1 of 6 14.07.2011 09:42 Cufflinks Transcript assembly, differential expression, and differential regulation for RNA-Seq Site Map Home Getting started
Maximizing Public Data Sources for Sequencing and GWAS
 Maximizing Public Data Sources for Sequencing and GWAS February 4, 2014 G Bryce Christensen Director of Services Questions during the presentation Use the Questions pane in your GoToWebinar window Agenda
Aligners. J Fass 23 August 2017
 Aligners J Fass 23 August 2017 Definitions Assembly: I ve found the shredded remains of an important document; put it back together! UC Davis Genome Center Bioinformatics Core J Fass Aligners 2017-08-23
Genome 373: Mapping Short Sequence Reads III. Doug Fowler
 Genome 373: Mapping Short Sequence Reads III Doug Fowler What is Galaxy? Galaxy is a free, open source web platform for running all sorts of computational analyses including pretty much all of the sequencing-related
Analysis of ChIP-seq data
 Before we start: 1. Log into tak (step 0 on the exercises) 2. Go to your lab space and create a folder for the class (see separate hand out) 3. Connect to your lab space through the wihtdata network and
Genomic Files. University of Massachusetts Medical School. October, 2015
 .. Genomic Files University of Massachusetts Medical School October, 2015 2 / 55. A Typical Deep-Sequencing Workflow Samples Fastq Files Fastq Files Sam / Bam Files Various files Deep Sequencing Further
TECH NOTE Improving the Sensitivity of Ultra Low Input mrna Seq
 TECH NOTE Improving the Sensitivity of Ultra Low Input mrna Seq SMART Seq v4 Ultra Low Input RNA Kit for Sequencing Powered by SMART and LNA technologies: Locked nucleic acid technology significantly improves
QIAseq Targeted RNAscan Panel Analysis Plugin USER MANUAL
 QIAseq Targeted RNAscan Panel Analysis Plugin USER MANUAL User manual for QIAseq Targeted RNAscan Panel Analysis 0.5.2 beta 1 Windows, Mac OS X and Linux February 5, 2018 This software is for research
Visualization using CummeRbund 2014 Overview
 Visualization using CummeRbund 2014 Overview In this lab, we'll look at how to use cummerbund to visualize our gene expression results from cuffdiff. CummeRbund is part of the tuxedo pipeline and it is
Getting Started. April Strand Life Sciences, Inc All rights reserved.
 Getting Started April 2015 Strand Life Sciences, Inc. 2015. All rights reserved. Contents Aim... 3 Demo Project and User Interface... 3 Downloading Annotations... 4 Project and Experiment Creation... 6
m6aviewer Version Documentation
 m6aviewer Version 1.6.0 Documentation Contents 1. About 2. Requirements 3. Launching m6aviewer 4. Running Time Estimates 5. Basic Peak Calling 6. Running Modes 7. Multiple Samples/Sample Replicates 8.
2. Take a few minutes to look around the site. The goal is to familiarize yourself with a few key components of the NCBI.
 2 Navigating the NCBI Instructions Aim: To become familiar with the resources available at the National Center for Bioinformatics (NCBI) and the search engine Entrez. Instructions: Write the answers to
Reference guided RNA-seq data analysis using BioHPC Lab computers
 Reference guided RNA-seq data analysis using BioHPC Lab computers This document assumes that you already know some basics of how to use a Linux computer. Some of the command lines in this document are
Mapping NGS reads for genomics studies
 Mapping NGS reads for genomics studies Valencia, 28-30 Sep 2015 BIER Alejandro Alemán aaleman@cipf.es Genomics Data Analysis CIBERER Where are we? Fastq Sequence preprocessing Fastq Alignment BAM Visualization
Tutorial: De Novo Assembly of Paired Data
 : De Novo Assembly of Paired Data September 20, 2013 CLC bio Silkeborgvej 2 Prismet 8000 Aarhus C Denmark Telephone: +45 70 22 32 44 Fax: +45 86 20 12 22 www.clcbio.com support@clcbio.com : De Novo Assembly
Fast-track to Gene Annotation and Genome Analysis
 Fast-track to Gene Annotation and Genome Analysis Contents Section Page 1.1 Introduction DNA Subway is a bioinformatics workspace that wraps high-level analysis tools in an intuitive and appealing interface.
ChIP-seq Analysis. BaRC Hot Topics - Feb 23 th 2016 Bioinformatics and Research Computing Whitehead Institute.
 ChIP-seq Analysis BaRC Hot Topics - Feb 23 th 2016 Bioinformatics and Research Computing Whitehead Institute http://barc.wi.mit.edu/hot_topics/ Outline ChIP-seq overview Experimental design Quality control/preprocessing
Transcript quantification using Salmon and differential expression analysis using bayseq
 Introduction to expression analysis (RNA-seq) Transcript quantification using Salmon and differential expression analysis using bayseq Philippine Genome Center University of the Philippines Prepared by
mirnet Tutorial Starting with expression data
 mirnet Tutorial Starting with expression data Computer and Browser Requirements A modern web browser with Java Script enabled Chrome, Safari, Firefox, and Internet Explorer 9+ For best performance and
High-throughput sequencing: Alignment and related topic. Simon Anders EMBL Heidelberg
 High-throughput sequencing: Alignment and related topic Simon Anders EMBL Heidelberg Established platforms HTS Platforms Illumina HiSeq, ABI SOLiD, Roche 454 Newcomers: Benchtop machines 454 GS Junior,
RNA-Seq analysis with Astrocyte Differential expression and transcriptome assembly
 RNA-Seq analysis with Astrocyte Differential expression and transcriptome assembly Beibei Chen Ph.D BICF 9/28/2016 Agenda Launch Workflows using Astrocyte BICF Workflows BICF RNA-seq Workflow Experimental
Integrated Genome browser (IGB) installation
 installation") Integrated Genome browser (IGB) installation Navigate to the IGB download page http://bioviz.org/igb/download.html You will see three icons for download: The three icons correspond to different memory
Integrated Genome browser (IGB) installation Navigate to the IGB download page http://bioviz.org/igb/download.html You will see three icons for download: The three icons correspond to different memory
Introduction to Galaxy
 Introduction to Galaxy Saint Louis University St. Louis, Missouri April 30, 2013 Dave Clements, Emory University http://galaxyproject.org/ Agenda 9:00 Welcome 9:20 Basic Analysis with Galaxy 10:30 Basic
Introduction to Genome Browsers
 Introduction to Genome Browsers Rolando Garcia-Milian, MLS, AHIP (Rolando.milian@ufl.edu) Department of Biomedical and Health Information Services Health Sciences Center Libraries, University of Florida
The UCSC Genome Browser
 The UCSC Genome Browser Search, retrieve and display the data that you want Materials prepared by Warren C. Lathe, Ph.D. Mary Mangan, Ph.D. www.openhelix.com Updated: Q3 2006 Version_0906 Copyright OpenHelix.
SEEK User Manual. Introduction
 SEEK User Manual Introduction SEEK is a computational gene co-expression search engine. It utilizes a vast human gene expression compendium to deliver fast, integrative, cross-platform co-expression analyses.
Using Galaxy to Perform Large-Scale Interactive Data Analyses
 Using Galaxy to Perform Large-Scale Interactive Data Analyses Jennifer Hillman-Jackson, 1 Dave Clements, 2 Daniel Blankenberg, 1 James Taylor, 2 Anton Nekrutenko, 1 and Galaxy Team 1,2 UNIT 10.5 1 Penn
Genomic Data Analysis Services Available for PL-Grid Users
 Domain-oriented services and resources of Polish Infrastructure for Supporting Computational Science in the European Research Space PLGrid Plus Domain-oriented services and resources of Polish Infrastructure
Practical Course in Genome Bioinformatics
 Practical Course in Genome Bioinformatics 20/01/2017 Exercises - Day 1 http://ekhidna.biocenter.helsinki.fi/downloads/teaching/spring2017/ Answer questions Q1-Q3 below and include requested Figures 1-5
NGS Data Analysis. Roberto Preste
 NGS Data Analysis Roberto Preste 1 Useful info http://bit.ly/2r1y2dr Contacts: roberto.preste@gmail.com Slides: http://bit.ly/ngs-data 2 NGS data analysis Overview 3 NGS Data Analysis: the basic idea http://bit.ly/2r1y2dr
TopHat, Cufflinks, Cuffdiff
 TopHat, Cufflinks, Cuffdiff Andreas Gisel Institute for Biomedical Technologies - CNR, Bari TopHat TopHat TopHat TopHat is a program that aligns RNA-Seq reads to a genome in order to identify exon-exon
Our typical RNA quantification pipeline
 RNA-Seq primer Our typical RNA quantification pipeline Upload your sequence data (fastq) Align to the ribosome (Bow>e) Align remaining reads to genome (TopHat) or transcriptome (RSEM) Make report of quality
Supplementary Figure 1. Fast read-mapping algorithm of BrowserGenome.
 Supplementary Figure 1 Fast read-mapping algorithm of BrowserGenome. (a) Indexing strategy: The genome sequence of interest is divided into non-overlapping 12-mers. A Hook table is generated that contains
Preparation of alignments for variant calling with GATK: exercise instructions for BioHPC Lab computers
 Preparation of alignments for variant calling with GATK: exercise instructions for BioHPC Lab computers Data used in the exercise We will use D. melanogaster WGS paired-end Illumina data with NCBI accessions
Introduction to Galaxy
 Introduction to Galaxy Dr Jason Wong Prince of Wales Clinical School Introductory bioinformatics for human genomics workshop, UNSW Day 1 Thurs 28 th January 2016 Overview What is Galaxy? Description of
Understanding and Pre-processing Raw Illumina Data
 Understanding and Pre-processing Raw Illumina Data Matt Johnson October 4, 2013 1 Understanding FASTQ files After an Illumina sequencing run, the data is stored in very large text files in a standard format
ChIP-seq Analysis. BaRC Hot Topics - March 21 st 2017 Bioinformatics and Research Computing Whitehead Institute.
 ChIP-seq Analysis BaRC Hot Topics - March 21 st 2017 Bioinformatics and Research Computing Whitehead Institute http://barc.wi.mit.edu/hot_topics/ Outline ChIP-seq overview Experimental design Quality control/preprocessing
Tutorial. Small RNA Analysis using Illumina Data. Sample to Insight. October 5, 2016
 Small RNA Analysis using Illumina Data October 5, 2016 Sample to Insight QIAGEN Aarhus Silkeborgvej 2 Prismet 8000 Aarhus C Denmark Telephone: +45 70 22 32 44 www.qiagenbioinformatics.com AdvancedGenomicsSupport@qiagen.com
Introduction to GE Microarray data analysis Practical Course MolBio 2012
 Introduction to GE Microarray data analysis Practical Course MolBio 2012 Claudia Pommerenke Nov-2012 Transkriptomanalyselabor TAL Microarray and Deep Sequencing Core Facility Göttingen University Medical
Small RNA Analysis using Illumina Data
 Small RNA Analysis using Illumina Data September 7, 2016 Sample to Insight CLC bio, a QIAGEN Company Silkeborgvej 2 Prismet 8000 Aarhus C Denmark Telephone: +45 70 22 32 44 www.clcbio.com support-clcbio@qiagen.com
NGS Analyses with Galaxy
 1 NGS Analyses with Galaxy Introduction Every living organism on our planet possesses a genome that is composed of one or several DNA (deoxyribonucleotide acid) molecules determining the way the organism
ChIP-seq Analysis Practical
 ChIP-seq Analysis Practical Vladimir Teif (vteif@essex.ac.uk) An updated version of this document will be available at http://generegulation.info/index.php/teaching In this practical we will learn how
High-throughput sequencing: Alignment and related topic. Simon Anders EMBL Heidelberg
 High-throughput sequencing: Alignment and related topic Simon Anders EMBL Heidelberg Established platforms HTS Platforms Illumina HiSeq, ABI SOLiD, Roche 454 Newcomers: Benchtop machines: Illumina MiSeq,