3D vector fields. Contents. Introduction 3D vector field topology Representation of particle lines. 3D LIC Combining different techniques
|
|
|
- Daniella Whitehead
- 5 years ago
- Views:
Transcription
1 3D vector fields Scientific Visualization (Part 9) PD Dr.-Ing. Peter Hastreiter Contents Introduction 3D vector field topology Representation of particle lines Path lines Ribbons Balls Tubes Stream tetrahedra 3D LIC Combining different techniques 2 Applied Visualization, SS10
2 Introduction Extension Many methods of 2D vector fields can be extended to 3D, in particular as far as ODE and cell searching is concerned Main problem in 3D Effective mapping to graphical primitives Main aspects Occlusion Amount of (visual) data Depth perception 3 Applied Visualization, SS10 Introduction Approaches to occlusion issue Sparse representations Animation Color differences to distinguish separate objects Continuity Reduction of visual data Sparse representations Clipping Importance of semi-transparency 4 Applied Visualization, SS10
3 Introduction We are concerned with enhancements and special features for 3D vector fields Glyphs Like 2D, more special icons Particle tracing The same as in 2D Time lines time surfaces P-space vs. C-space LIC Curvilinear grids like 2D Calculation is no problem, but rendering is difficult (display on 2D-screen, see next section) Qualitative analysis at critical points 5 Applied Visualization, SS10 3D vector field topology 6 Applied Visualization, SS10
4 3D vector field topology Assumption Critical point x 0 r r r v( x0) = 0 J r v ( x0 ) : Jacobian matrix Classification of critical points In 3D, using the 3 eigenvalues of the Jacobian There are 2 main cases 3 real eigenvalues 2 complex conjugate and 1 real eigenvalue 7 Applied Visualization, SS10 3D vector field topology Eigenvalues: each is real λ 1 < λ 2 < λ 3 <0 λ 1 < λ 2 <0<λ 3 λ 1 <0<λ 2 < λ 3 0 < λ 1 < λ 2 < λ 3 attracting node saddle node saddle node repelling node Eigenvalues: 1 real & 2 imaginary (like spiral in bathing tube) λ 1 < 0: attracting relative to 0 Re(λ 2 ) = Re(λ 3 ) < 0 attracting focus Re(λ 2 ) = Re(λ 3 ) > 0 repelling focus Orientation of rotation depending on imaginary part λ 1 > 0: repelling relative to 0 Re(λ 2 ) = Re(λ 3 ) < 0 attracting focus Re(λ 2 ) = Re(λ 3 ) > 0 repelling focus Orientation of rotation depending on imaginary part 8 Applied Visualization, SS10

5 3D vector field topology Nodes Node-Saddles Focus Focus-Saddles Repelling variants Attracting variables 3 real eigenvalues 2 complex eigenvalues Images: Saddle Connectors An approach to visualizing the topological skeleton of complex 3D vector fields, Theisel, Weinkauf, Hege, and Seidel 9 Applied Visualization, SS10 3D vector field topology Critical points Attracting and repelling point Flow perpendicular to surface Tangential component of vector field 0 Particle line start / end there Field vortex (ger.: Wirbel) Motion of flow swirling rapidly around a center Important since these are locations of loss of energy Regions of concentrated vorticity (i.e. flow rotation) Vorticity (ger.: Wirbelstärke or Vortizität) Central measure in fluid mechanics an meteorology Measures tendency for elements of the fluid to "spin" More formally Related to amount of "rotation" (i.e. local angular rate of rotation) in a flow (Pseudo-) vector field ω r r r r defined as rotation of the velocity field v r : ω = v 10 Applied Visualization, SS10
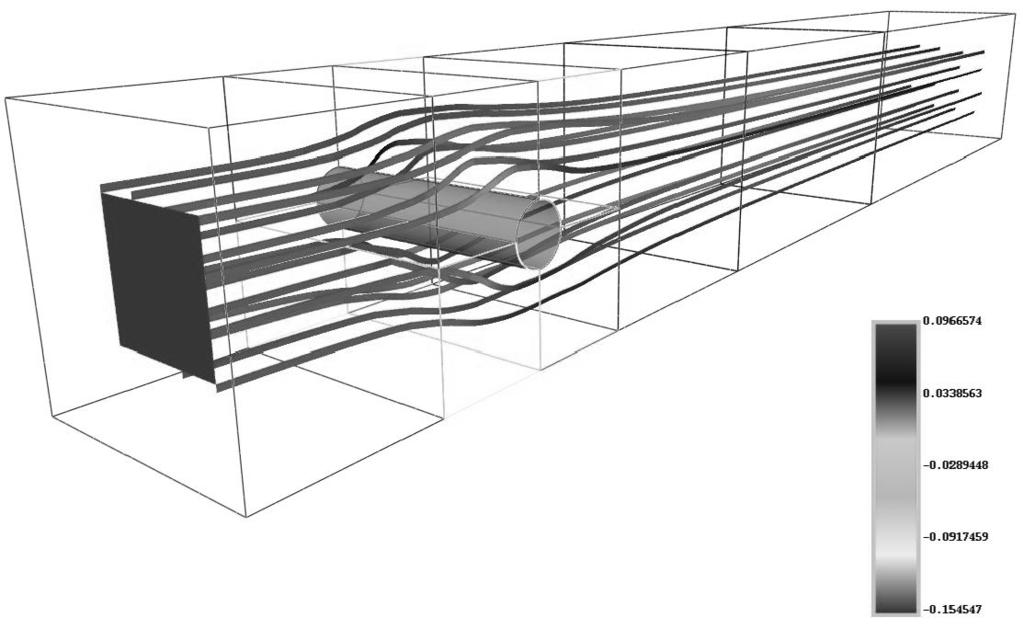
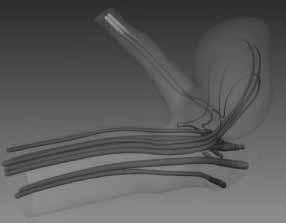
 Displacement of vortices behind moving rod Vortex in 11 impeller Applied Visualization, SS10 3D vector field")

6 3D vector field topology Examples for vortices Spiral motion with closed streamlines is vortex flow Air vortex: wake vortex (color encoded) Displacement of vortices behind moving rod Vortex in 11 impeller Applied Visualization, SS10 3D vector field topology Strategy for 3D vector field algorithms Find critical points Classify eigenvalues of Jacobian J v (x) Attracting / repelling node Attracting / repelling focus Saddle, center Combine critical points with particle lines 12 Applied Visualization, SS10


7 3D vector field topology Separatrices Occlusion effects of stream surfaces cluttered and hardly interpretable visualization Iconic representation Visualization with separation surfaces Images: Saddle Connectors An approach to visualizing the topological skeleton of 13 complex 3D vector fields, Theisel, Weinkauf, Hege, and Seidel Applied Visualization, SS10 3D vector field topology Separatrices (cont.) Instead use saddle connectors Separation surfaces of the saddles Intersection of the separation surfaces is the saddle connector Images: Saddle Connectors An approach to visualizing the topological skeleton of 14 complex 3D vector fields, Theisel, Weinkauf, Hege, and Seidel Applied Visualization, SS10


8 3D vector field topology Example using saddle connectors 13 critical points and 9 saddle connectors LIC shows correspondence of skeleton and flow 15 Applied Visualization, SS10 3D vector field topology Stream line oriented topology of a 2D time-dependent vector field LIC images at 3 different time slices Tracking the locations of critical points as stream lines (red / blue / yellow) Images: Saddle Connectors An approach to visualizing the topological skeleton of complex 3D vector fields, Theisel, Weinkauf, Hege, and Seidel 16 Applied Visualization, SS10
9 Path lines (Representation of particle lines) 17 Applied Visualization, SS10 Path lines Approach Randomly generate particles in the flow and trace the path of these particles over a specified time interval Choose randomly Starting positions Starting time Life time Encode scalar values by Color Line width of path Stream balls Etc. 18 Applied Visualization, SS10


10 Path lines Including shading of lines 19 Applied Visualization, SS10 Path lines Including shading of lines 20 Applied Visualization, SS10


11 Path lines Glyphs along path line 21 Applied Visualization, SS10 Path lines Glyphs along path line 22 Applied Visualization, SS10

 24 Applied")
12 Path lines Glyphs along path-line 23 Applied Visualization, SS10 Ribbons (Representation of particle lines) 24 Applied Visualization, SS10
13 Ribbons Approach Show rotation and divergence Trace two close particles Fill with polygon in between Disadvantages 2 traces Difficult in case of separation (better keep the width constant) Better: direct calculation of rotation Map rotation of vector field directly on particle line Vorticity Measure for rotation of vector field Streamwise vorticity Projection of vorticity on vector of velocity 25 Applied Visualization, SS10 Ribbons Decomposition of the Jacobian r = 1 r r T + ( ) + 1 r r J x( v) J x( v) J x ( v) J x ( v) J x( v) 2 2 = Λ + Ω T ( ) ( ( ) ) symmetric (deformation or stretching tensor) anti-symmetric (local rotation) Furthermore r = 1 r J x ( v) spur J x( v) Id 3 ( ) + Σ + Ω 1 spur( J x( v r )) Id 3 : can be interpreted as the expansion, i.e. local convergence or divergence of the flow field Σ : symmetric matrix, representing the local shear 26 Applied Visualization, SS10
14 Ribbons Local rotation Ω This is a skew-symmetric matrix, called vorticity or spin matrix Form of the rotation matrix where the vector field ω r = Ω = 1 2 streamwise vorticity 0 ω3 ω2 ( ω ω ) T 1 2 ω3 ω 0 ω 1 3 ω2 ω1 0 is the rotation of the velocity, i.e. r r ω = v r = rot v vorticity 27 Applied Visualization, SS10 Ribbons rotation Angle of stream ribbon Assuming Euler s method (for simplicity only!) for integrating the orbit x r τ v( x 1) n = xn 1 + n Let the band vector b (determines direction of the ribbon), be a small vector perpendicular to the tangent vector of the orbit Then b is transformed according to r b n r r r = + + r bn 1 τ J x( v( xn 1)) bn 1 O bn Neglecting higher order terms, expansion, and shear, it follows r b r n = bn 1 + τ Ω( xn 1) bn 1 Local rotation perpendicular to the velocity direction Project the new band vector b after each integration step onto plane perpendicular to tangent vector of the orbit Neglect rotation in path direction (already revealed by orbit itself) particle line 28 normal plane Applied Visualization, SS10 r 1 2

15 Ribbons Divergence of vector field Width of ribbon Advantage Curls of the flow along the flow s direction can easily be recognized 29 Applied Visualization, SS10 Ribbons 30 Applied Visualization, SS10


16 Ribbons 31 Applied Visualization, SS10 Ribbons 32 Applied Visualization, SS10
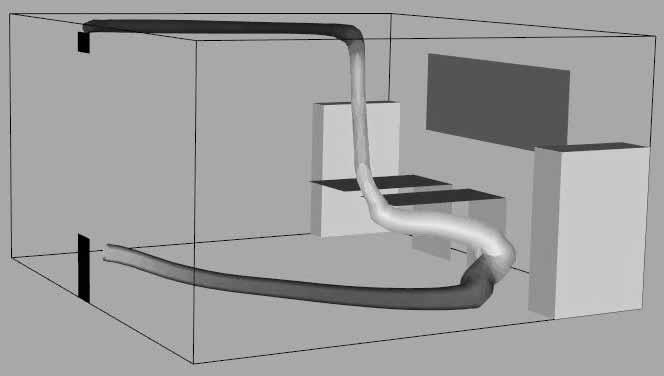
 Velocities and turbulence due to a pump in the aorta Helps to understand how the pump")

17 Ribbons Aortic Blood Turbulence (by: R. Boon et al.) Velocities and turbulence due to a pump in the aorta Helps to understand how the pump affects blood flow near a patient's heart in order to better design the pump 33 Applied Visualization, SS10 Ribbons Alternative approach Trace two close-by particles Keep distance constant 34 Applied Visualization, SS10
18 Balls (Representation of particle lines) 35 Applied Visualization, SS10 Balls Distance of balls Velocity Adaptive step size Radius of balls Scalar value Disadvantage Many triangles 36 Applied Visualization, SS10


19 Balls 37 Applied Visualization, SS10 Balls 38 Applied Visualization, SS10
20 Stream tubes (Representation of particle lines) 39 Applied Visualization, SS10 Stream tubes Polygonal object Spatial impression Radius Scalar value Calculation Circle trace all elements Trace line then place circles and combine them Advantage Curls of the flow along the flow s direction can easily be recognized 40 Applied Visualization, SS10


21 Stream tubes 41 Applied Visualization, SS10 Stream tubes 42 Applied Visualization, SS10


22 Stream tubes 43 Applied Visualization, SS10 Stream tubes 44 Applied Visualization, SS10
23 Stream tetrahedra 45 Applied Visualization, SS10 Stream tetrahedra Combines advantages of balls and ribbons Local rotation + velocity + divergence (rotation) (density) (size) Very simple geometry 46 Applied Visualization, SS10

24 Stream tetrahedra 47 Applied Visualization, SS10 3D LIC 48 Applied Visualization, SS10
 Animation Transparency 49 Applied Visualization, SS10 3D LIC Missing continuity 50 Applied Visualization, SS10")
25 3D LIC Calculation No problem the same as in 2D Representation Difficult interpretation Requires volume visualization Additional tools Clipping (plane, box, ) Animation Transparency 49 Applied Visualization, SS10 3D LIC Missing continuity 50 Applied Visualization, SS10


26 3D LIC Color differences to identify connected structures 51 Applied Visualization, SS10 3D LIC Animation 52 Applied Visualization, SS10


27 3D LIC Reduction of visual data Restrict to volume of interest 53 Applied Visualization, SS10 3D LIC Reduction of visual data Application of transparency 54 Applied Visualization, SS10


28 3D LIC Reduction of visual data Deform clip object based on vector field 55 Applied Visualization, SS10 3D LIC Reduction of visual data Clipping Masking 56 Applied Visualization, SS10

29 3D LIC Reduction of visual data Clipping 57 Applied Visualization, SS10 Combining different techniques 58 Applied Visualization, SS10

30 Combining different techniques Examples Frequent combination of different techniques Requirement of interactivity Efficient implementation 59 Applied Visualization, SS10 Combining different techniques 60 Applied Visualization, SS10


31 Combining different techniques 61 Applied Visualization, SS10 Combining different techniques Visualization of blood flow 62 Applied Visualization, SS10
Vector Visualization. CSC 7443: Scientific Information Visualization
 Vector Visualization Vector data A vector is an object with direction and length v = (v x,v y,v z ) A vector field is a field which associates a vector with each point in space The vector data is 3D representation
Vector Visualization
 Vector Visualization Vector Visulization Divergence and Vorticity Vector Glyphs Vector Color Coding Displacement Plots Stream Objects Texture-Based Vector Visualization Simplified Representation of Vector
Chapter 6 Visualization Techniques for Vector Fields
 Chapter 6 Visualization Techniques for Vector Fields 6.1 Introduction 6.2 Vector Glyphs 6.3 Particle Advection 6.4 Streamlines 6.5 Line Integral Convolution 6.6 Vector Topology 6.7 References 2006 Burkhard
2D vector fields 3. Contents. Line Integral Convolution (LIC) Image based flow visualization Vector field topology. Fast LIC Oriented LIC
 Image based flow visualization Vector field topology. Fast LIC Oriented LIC") 2D vector fields 3 Scientific Visualization (Part 8) PD Dr.-Ing. Peter Hastreiter Contents Line Integral Convolution (LIC) Fast LIC Oriented LIC Image based flow visualization Vector field topology 2 Applied
2D vector fields 3 Scientific Visualization (Part 8) PD Dr.-Ing. Peter Hastreiter Contents Line Integral Convolution (LIC) Fast LIC Oriented LIC Image based flow visualization Vector field topology 2 Applied
8. Tensor Field Visualization
 8. Tensor Field Visualization Tensor: extension of concept of scalar and vector Tensor data for a tensor of level k is given by t i1,i2,,ik (x 1,,x n ) Second-order tensor often represented by matrix Examples:
Vector Field Visualisation
 Vector Field Visualisation Computer Animation and Visualization Lecture 14 Institute for Perception, Action & Behaviour School of Informatics Visualising Vectors Examples of vector data: meteorological
Lecture overview. Visualisatie BMT. Vector algorithms. Vector algorithms. Time animation. Time animation
 Visualisatie BMT Lecture overview Vector algorithms Tensor algorithms Modeling algorithms Algorithms - 2 Arjan Kok a.j.f.kok@tue.nl 1 2 Vector algorithms Vector 2 or 3 dimensional representation of direction
Data Visualization. Fall 2017
 Data Visualization Fall 2017 Vector Fields Vector field v: D R n D is typically 2D planar surface or 2D surface embedded in 3D n = 2 fields tangent to 2D surface n = 3 volumetric fields When visualizing
Vector Visualization Chap. 6 March 7, 2013 March 26, Jie Zhang Copyright
 ector isualization Chap. 6 March 7, 2013 March 26, 2013 Jie Zhang Copyright CDS 301 Spring, 2013 Outline 6.1. Divergence and orticity 6.2. ector Glyphs 6.3. ector Color Coding 6.4. Displacement Plots (skip)
Flow Visualisation - Background. CITS4241 Visualisation Lectures 20 and 21
 CITS4241 Visualisation Lectures 20 and 21 Flow Visualisation Flow visualisation is important in both science and engineering From a "theoretical" study of o turbulence or o a fusion reactor plasma, to
Vector Visualisation 1. global view
 Vector Field Visualisation : global view Visualisation Lecture 12 Institute for Perception, Action & Behaviour School of Informatics Vector Visualisation 1 Vector Field Visualisation : local & global Vector
Data Visualization (CIS/DSC 468)
") Data Visualization (CIS/DSC 468) Vector Visualization Dr. David Koop Visualizing Volume (3D) Data 2D visualization slice images (or multi-planar reformating MPR) Indirect 3D visualization isosurfaces (or
Data Visualization (CIS/DSC 468) Vector Visualization Dr. David Koop Visualizing Volume (3D) Data 2D visualization slice images (or multi-planar reformating MPR) Indirect 3D visualization isosurfaces (or
Flow Visualisation 1
 Flow Visualisation Visualisation Lecture 13 Institute for Perception, Action & Behaviour School of Informatics Flow Visualisation 1 Flow Visualisation... so far Vector Field Visualisation vector fields
CIS 467/602-01: Data Visualization
 CIS 467/602-01: Data Visualization Vector Field Visualization Dr. David Koop Fields Tables Networks & Trees Fields Geometry Clusters, Sets, Lists Items Items (nodes) Grids Items Items Attributes Links
Flow Visualization with Integral Surfaces
 Flow Visualization with Integral Surfaces Visual and Interactive Computing Group Department of Computer Science Swansea University R.S.Laramee@swansea.ac.uk 1 1 Overview Flow Visualization with Integral
Over Two Decades of IntegrationBased, Geometric Vector Field. Visualization
 Over Two Decades of IntegrationBased, Geometric Vector Field Visualization Tony McLoughlin1, 1, Ronald Peikert2, Frits H. Post3, and Min Chen1 1 The Visual and Interactive Computing Group Computer Science
Vector Visualization
 Vector Visualization 5-1 Vector Algorithms Vector data is a three-dimensional representation of direction and magnitude. Vector data often results from the study of fluid flow, or when examining derivatives,
Lecture overview. Visualisatie BMT. Fundamental algorithms. Visualization pipeline. Structural classification - 1. Structural classification - 2
 Visualisatie BMT Fundamental algorithms Arjan Kok a.j.f.kok@tue.nl Lecture overview Classification of algorithms Scalar algorithms Vector algorithms Tensor algorithms Modeling algorithms 1 2 Visualization
Volume Illumination & Vector Field Visualisation
 Volume Illumination & Vector Field Visualisation Visualisation Lecture 11 Institute for Perception, Action & Behaviour School of Informatics Volume Illumination & Vector Vis. 1 Previously : Volume Rendering
Scaling the Topology of Symmetric, Second-Order Planar Tensor Fields
 Scaling the Topology of Symmetric, Second-Order Planar Tensor Fields Xavier Tricoche, Gerik Scheuermann, and Hans Hagen University of Kaiserslautern, P.O. Box 3049, 67653 Kaiserslautern, Germany E-mail:
Using Integral Surfaces to Visualize CFD Data
 Using Integral Surfaces to Visualize CFD Data Tony Mcloughlin, Matthew Edmunds,, Mark W. Jones, Guoning Chen, Eugene Zhang 1 1 Overview Flow Visualization with Integral Surfaces: Introduction to flow visualization
Fundamental Algorithms
 Fundamental Algorithms Fundamental Algorithms 3-1 Overview This chapter introduces some basic techniques for visualizing different types of scientific data sets. We will categorize visualization methods
2.7 Cloth Animation. Jacobs University Visualization and Computer Graphics Lab : Advanced Graphics - Chapter 2 123
 2.7 Cloth Animation 320491: Advanced Graphics - Chapter 2 123 Example: Cloth draping Image Michael Kass 320491: Advanced Graphics - Chapter 2 124 Cloth using mass-spring model Network of masses and springs
FLUID MECHANICS TESTS
 FLUID MECHANICS TESTS Attention: there might be more correct answers to the questions. Chapter 1: Kinematics and the continuity equation T.2.1.1A flow is steady if a, the velocity direction of a fluid
Separation in three-dimensional steady flows. Part 2 : DETACHMENT AND ATTACHMENT SEPARATION LINES DETACHMENT AND ATTACHMENT SEPARATION SURFACES
 Separation in three-dimensional steady flows Part 2 : DETACHMENT AND ATTACHMENT SEPARATION LINES DETACHMENT AND ATTACHMENT SEPARATION SURFACES Separation lines or separatrices A separation line is a skin
Scalar Visualization
 Scalar Visualization Visualizing scalar data Popular scalar visualization techniques Color mapping Contouring Height plots outline Recap of Chap 4: Visualization Pipeline 1. Data Importing 2. Data Filtering
Scientific Visualization
 Scientific Visualization Dr. Ronald Peikert Summer 2007 Ronald Peikert SciVis 2007 - Introduction 1-1 Introduction to Scientific Visualization Ronald Peikert SciVis 2007 - Introduction 1-2 What is Scientific
Lecture notes: Visualization I Visualization of vector fields using Line Integral Convolution and volume rendering
 Lecture notes: Visualization I Visualization of vector fields using Line Integral Convolution and volume rendering Anders Helgeland FFI Chapter 1 Visualization techniques for vector fields Vector fields
Volume Rendering. Computer Animation and Visualisation Lecture 9. Taku Komura. Institute for Perception, Action & Behaviour School of Informatics
 Volume Rendering Computer Animation and Visualisation Lecture 9 Taku Komura Institute for Perception, Action & Behaviour School of Informatics Volume Rendering 1 Volume Data Usually, a data uniformly distributed
Vorticity dynamics & the small scales of turbulence Particle Tracking Velocimetry 3DPTV & DNS
 Vorticity dynamics & the small scales of turbulence Particle Tracking Velocimetry 3DPTV & DNS Luthi et al. JFM (528) pp 87, 2005 Guala et al. JFM (533) pp 339, 2005 Hoyer et al., Exp. in fluids (39) pp
1. Interpreting the Results: Visualization 1
 1. Interpreting the Results: Visualization 1 visual/graphical/optical representation of large sets of data: data from experiments or measurements: satellite images, tomography in medicine, microsopy,...
FLOWING FLUIDS AND PRESSURE VARIATION
 Chapter 4 Pressure differences are (often) the forces that move fluids FLOWING FLUIDS AND PRESSURE VARIATION Fluid Mechanics, Spring Term 2011 e.g., pressure is low at the center of a hurricane. For your
Data Representation in Visualisation
 Data Representation in Visualisation Visualisation Lecture 4 Taku Komura Institute for Perception, Action & Behaviour School of Informatics Taku Komura Data Representation 1 Data Representation We have
CIS 467/602-01: Data Visualization
 CIS 467/60-01: Data Visualization Isosurfacing and Volume Rendering Dr. David Koop Fields and Grids Fields: values come from a continuous domain, infinitely many values - Sampled at certain positions to
Volume visualization. Volume visualization. Volume visualization methods. Sources of volume visualization. Sources of volume visualization
 Volume visualization Volume visualization Volumes are special cases of scalar data: regular 3D grids of scalars, typically interpreted as density values. Each data value is assumed to describe a cubic
Flow Visualization: The State-of-the-Art
 Flow Visualization: The State-of-the-Art The Visual and Interactive Computing Group Computer Science Department Swansea University Swansea, Wales, UK 1 Overview Introduction to Flow Visualization (FlowViz)
The State of the Art in Flow Visualisation: Feature Extraction and Tracking
 Volume 22 (2003), Number 4 pp. 1 17 The State of the Art in Flow Visualisation: Feature Extraction and Tracking Frits H. Post a, Benjamin Vrolijk a, Helwig Hauser b, Robert S. Laramee b and Helmut Doleisch
mjb March 9, 2015 Chuck Evans
 Vector Visualization What is a Vector Visualization Problem? A vector has direction and magnitude. Typically science and engineering problems that work this way are those involving fluid flow through a
Digital Image Processing
 Digital Image Processing Part 9: Representation and Description AASS Learning Systems Lab, Dep. Teknik Room T1209 (Fr, 11-12 o'clock) achim.lilienthal@oru.se Course Book Chapter 11 2011-05-17 Contents
Guidelines for proper use of Plate elements
 Guidelines for proper use of Plate elements In structural analysis using finite element method, the analysis model is created by dividing the entire structure into finite elements. This procedure is known
Scientific Visualization Example exam questions with commented answers
 Scientific Visualization Example exam questions with commented answers The theoretical part of this course is evaluated by means of a multiple- choice exam. The questions cover the material mentioned during
Visualization Computer Graphics I Lecture 20
 15-462 Computer Graphics I Lecture 20 Visualization Height Fields and Contours Scalar Fields Volume Rendering Vector Fields [Angel Ch. 12] November 20, 2003 Doug James Carnegie Mellon University http://www.cs.cmu.edu/~djames/15-462/fall03
Diffusion Imaging Visualization
 Diffusion Imaging Visualization Thomas Schultz URL: http://cg.cs.uni-bonn.de/schultz/ E-Mail: schultz@cs.uni-bonn.de 1 Outline Introduction to Diffusion Imaging Basic techniques Glyph-based Visualization
The State of the Art in Flow Visualisation: Feature Extraction and Tracking
 Volume 22 (2003), number 4 pp. 775 792 COMPUTER GRAPHICS forum The State of the Art in Flow Visualisation: Feature Extraction and Tracking Frits H. Post 1, Benjamin Vrolijk 1, Helwig Hauser 2, Robert S.
Continuous Topology Simplification of Planar Vector Fields
 Continuous Topology Simplification of Planar Vector Fields Xavier Tricoche 1 Gerik Scheuermann 1 Hans Hagen 1 Abstract Vector fields can present complex structural behavior, especially in turbulent computational
Surface Representations of Two- and Three-Dimensional. Fluid Flow Topology
 Surface Representations of Two- and Three-Dimensional Fluid Flow Topology J. L. Helman Lambertus Hesselink Department of Applied Physics Departments of Aeronautics/Astronautics and Electrical Engineering
Data Visualization (DSC 530/CIS )
") Data Visualization (DSC 530/CIS 60-01) Scalar Visualization Dr. David Koop Online JavaScript Resources http://learnjsdata.com/ Good coverage of data wrangling using JavaScript Fields in Visualization Scalar
Data Visualization (DSC 530/CIS 60-01) Scalar Visualization Dr. David Koop Online JavaScript Resources http://learnjsdata.com/ Good coverage of data wrangling using JavaScript Fields in Visualization Scalar
Distributed Visualization and Analysis of Fluid Dynamics Data
 Distributed Visualization and Analysis of Fluid Dynamics Data Hans-Christian HEGE, Tino WEINKAUF, Steffen PROHASKA, and Andrei HUTANU Zuse Institute Berlin, Scientific Visualization Group, Germany {hege,weinkauf,prohaska,hutanu}@zib.de,
Vector Field Visualization: Introduction
 Vector Field Visualization: Introduction What is a Vector Field? Why It is Important? Vector Fields in Engineering and Science Automotive design [Chen et al. TVCG07,TVCG08] Weather study [Bhatia and Chen
System Design for Visualizing Scientific Computations
 25 Chapter 2 System Design for Visualizing Scientific Computations In Section 1.1 we defined five broad goals for scientific visualization. Specifically, we seek visualization techniques that 1. Can be
Isosurface Rendering. CSC 7443: Scientific Information Visualization
 Isosurface Rendering What is Isosurfacing? An isosurface is the 3D surface representing the locations of a constant scalar value within a volume A surface with the same scalar field value Isosurfaces form
11/1/13. Visualization. Scientific Visualization. Types of Data. Height Field. Contour Curves. Meshes
 CSCI 420 Computer Graphics Lecture 26 Visualization Height Fields and Contours Scalar Fields Volume Rendering Vector Fields [Angel Ch. 2.11] Jernej Barbic University of Southern California Scientific Visualization
Visualization. CSCI 420 Computer Graphics Lecture 26
 CSCI 420 Computer Graphics Lecture 26 Visualization Height Fields and Contours Scalar Fields Volume Rendering Vector Fields [Angel Ch. 11] Jernej Barbic University of Southern California 1 Scientific Visualization
Gallery of Transition Effects. Transition Effects Dissolves Wipes Digital Video Effects
 C Gallery of Transition Effects Transition Effects...................................... 608 Dissolves.......................................... 608 Wipes............................................. 610
WEEKS 1-2 MECHANISMS
 References WEEKS 1-2 MECHANISMS (METU, Department of Mechanical Engineering) Text Book: Mechanisms Web Page: http://www.me.metu.edu.tr/people/eres/me301/in dex.ht Analitik Çözümlü Örneklerle Mekanizma
Previously... contour or image rendering in 2D
 Volume Rendering Visualisation Lecture 10 Taku Komura Institute for Perception, Action & Behaviour School of Informatics Volume Rendering 1 Previously... contour or image rendering in 2D 2D Contour line
Topology Simplification for Turbulent Flow Visualization
 Topology Simplification for Turbulent Flow Visualization Xavier Tricoche University of Kaiserslautern Department of Computer Science, Computer Graphics & CAGD P.O. Box 3049, D-67653 Kaiserslautern Germany
9.9 Coherent Structure Detection in a Backward-Facing Step Flow
 9.9 Coherent Structure Detection in a Backward-Facing Step Flow Contributed by: C. Schram, P. Rambaud, M. L. Riethmuller 9.9.1 Introduction An algorithm has been developed to automatically detect and characterize
Improving perception of intersecting 2D scalar fields. Mark Robinson Advisor: Dr. Kay Robbins
 Improving perception of intersecting 2D scalar fields Mark Robinson Advisor: Dr. Kay Robbins Outline of Presentation 1. Definition 2. 2D, 3D visualization techniques 3. Description of stratification 4.
Course Review. Computer Animation and Visualisation. Taku Komura
 Course Review Computer Animation and Visualisation Taku Komura Characters include Human models Virtual characters Animal models Representation of postures The body has a hierarchical structure Many types
Chapter 5. Projections and Rendering
 Chapter 5 Projections and Rendering Topics: Perspective Projections The rendering pipeline In order to view manipulate and view a graphics object we must find ways of storing it a computer-compatible way.
CHAPTER 3. Elementary Fluid Dynamics
 CHAPTER 3. Elementary Fluid Dynamics - Understanding the physics of fluid in motion - Derivation of the Bernoulli equation from Newton s second law Basic Assumptions of fluid stream, unless a specific
Vector Field Visualization: Introduction
 Vector Field Visualization: Introduction What is a Vector Field? A simple 2D steady vector field A vector valued function that assigns a vector (with direction and magnitude) to any given point. It typically
Scalar Algorithms: Contouring
 Scalar Algorithms: Contouring Computer Animation and Visualisation Lecture tkomura@inf.ed.ac.uk Institute for Perception, Action & Behaviour School of Informatics Contouring Scaler Data Last Lecture...
The exam begins at 5:10pm and ends at 8:00pm. You must turn your exam in when time is announced or risk not having it accepted.
 CS 184: Foundations of Computer Graphics page 1 of 11 Student Name: Student ID: Instructions: Read them carefully! The exam begins at 5:10pm and ends at 8:00pm. You must turn your exam in when time is
Data Visualization (DSC 530/CIS )
") Data Visualization (DSC 530/CIS 60-0) Isosurfaces & Volume Rendering Dr. David Koop Fields & Grids Fields: - Values come from a continuous domain, infinitely many values - Sampled at certain positions
Data Visualization (DSC 530/CIS 60-0) Isosurfaces & Volume Rendering Dr. David Koop Fields & Grids Fields: - Values come from a continuous domain, infinitely many values - Sampled at certain positions
Visualization Computer Graphics I Lecture 20
 15-462 Computer Graphics I Lecture 20 Visualization Height Fields and Contours Scalar Fields Volume Rendering Vector Fields [Angel Ch. 12] April 15, 2003 Frank Pfenning Carnegie Mellon University http://www.cs.cmu.edu/~fp/courses/graphics/
Height Fields and Contours Scalar Fields Volume Rendering Vector Fields [Angel Ch. 12] April 23, 2002 Frank Pfenning Carnegie Mellon University
![Height Fields and Contours Scalar Fields Volume Rendering Vector Fields [Angel Ch. 12] April 23, 2002 Frank Pfenning Carnegie Mellon University](/thumbs/90/102611276.jpg "Height Fields and Contours Scalar Fields Volume Rendering Vector Fields [Angel Ch. 12] April 23, 2002 Frank Pfenning Carnegie Mellon University") 15-462 Computer Graphics I Lecture 21 Visualization Height Fields and Contours Scalar Fields Volume Rendering Vector Fields [Angel Ch. 12] April 23, 2002 Frank Pfenning Carnegie Mellon University http://www.cs.cmu.edu/~fp/courses/graphics/
15-462 Computer Graphics I Lecture 21 Visualization Height Fields and Contours Scalar Fields Volume Rendering Vector Fields [Angel Ch. 12] April 23, 2002 Frank Pfenning Carnegie Mellon University http://www.cs.cmu.edu/~fp/courses/graphics/
The Spalart Allmaras turbulence model
 The Spalart Allmaras turbulence model The main equation The Spallart Allmaras turbulence model is a one equation model designed especially for aerospace applications; it solves a modelled transport equation
Assignment #2: 2D Vector Field Topological Analysis: Compute Differential Topology and Geometric-based Morse Decomposition
 Assignment #2: 2D Vector Field Topological Analysis: Compute Differential Topology and Geometric-based Morse Decomposition Goals: Due Mar 8 th, before midnight By completing the first assignment, you should
Topology-Based Visualization of Time-Dependent 2D Vector Fields
 Topology-Based Visualization of Time-Dependent 2D Vector Fields Xavier Tricoche, Gerik Scheuermann, and Hans Hagen University of Kaiserslautern P.O. Box 3049, D-67653 Kaiserslautern Germany E-mail: ftricoche
Inviscid Flows. Introduction. T. J. Craft George Begg Building, C41. The Euler Equations. 3rd Year Fluid Mechanics
 Contents: Navier-Stokes equations Inviscid flows Boundary layers Transition, Reynolds averaging Mixing-length models of turbulence Turbulent kinetic energy equation One- and Two-equation models Flow management
Continuous Topology Simplification of Planar Vector Fields
 Continuous Topology Simplification of Planar Vector Fields Xavier Tricoche Gerik Scheuermann Hans Hagen E-mail: University of Kaiserslautern Department of Computer Science P.O. Box 3049, D-67653 Kaiserslautern
2.11 Particle Systems
 2.11 Particle Systems 320491: Advanced Graphics - Chapter 2 152 Particle Systems Lagrangian method not mesh-based set of particles to model time-dependent phenomena such as snow fire smoke 320491: Advanced
Simulation of Turbulent Flow around an Airfoil
 1. Purpose Simulation of Turbulent Flow around an Airfoil ENGR:2510 Mechanics of Fluids and Transfer Processes CFD Lab 2 (ANSYS 17.1; Last Updated: Nov. 7, 2016) By Timur Dogan, Michael Conger, Andrew
The University of Calgary
 The University of Calgary Department of Computer Science Final Examination, Questions ENEL/CPSC 555 Computer Graphics Time: 2 Hours Closed Book, calculators are permitted. The questions carry equal weight.
Cloth Simulation. COMP 768 Presentation Zhen Wei
 Cloth Simulation COMP 768 Presentation Zhen Wei Outline Motivation and Application Cloth Simulation Methods Physically-based Cloth Simulation Overview Development References 2 Motivation Movies Games VR
USE OF PROPER ORTHOGONAL DECOMPOSITION TO INVESTIGATE THE TURBULENT WAKE OF A SURFACE-MOUNTED FINITE SQUARE PRISM
 June 30 - July 3, 2015 Melbourne, Australia 9 6B-3 USE OF PROPER ORTHOGONAL DECOMPOSITION TO INVESTIGATE THE TURBULENT WAKE OF A SURFACE-MOUNTED FINITE SQUARE PRISM Rajat Chakravarty, Nader Moazamigoodarzi,
Shading Shades. Frank Jargstorff. June 1, Abstract
 Shading Shades Frank Jargstorff fjargstorff@nvidia.com June 1, 2004 Abstract Procedural material shaders continue to pop up since the advent of fragment programmability. Most of these shaders concentrate
ACGV 2008, Lecture 1 Tuesday January 22, 2008
 Advanced Computer Graphics and Visualization Spring 2008 Ch 1: Introduction Ch 4: The Visualization Pipeline Ch 5: Basic Data Representation Organization, Spring 2008 Stefan Seipel Filip Malmberg Mats
Visualization and Quantification of Helical Flow in the Aorta using 4D Flow MRI
 Linköpings universitet Institutionen för medicinsk teknik Master Thesis, 30 hp Biomedical Engineering Spring 2016 LiTH-IMT/BIT30-A-EX--16/537--SE Visualization and Quantification of Helical Flow in the
AudioFlow. Flow-influenced sound. Matthias Adorjan, BSc February 12, 2015
 AudioFlow Flow-influenced sound Matthias Adorjan, BSc e0927290@student.tuwien.ac.at February 12, 2015 1 Introduction Nowadays flow visualization is used in various application fields to make invisible
Human Motion. Session Speaker Dr. M. D. Deshpande. AML2506 Biomechanics and Flow Simulation PEMP-AML2506
 AML2506 Biomechanics and Flow Simulation Day 02A Kinematic Concepts for Analyzing Human Motion Session Speaker Dr. M. D. Deshpande 1 Session Objectives At the end of this session the delegate would have
Indirect Volume Rendering
 Indirect Volume Rendering Visualization Torsten Möller Weiskopf/Machiraju/Möller Overview Contour tracing Marching cubes Marching tetrahedra Optimization octree-based range query Weiskopf/Machiraju/Möller
Midterm Exam! CS 184: Foundations of Computer Graphics! page 1 of 13!
 Midterm Exam! CS 184: Foundations of Computer Graphics! page 1 of 13! Student Name:!! Class Account Username:! Instructions: Read them carefully!! The exam begins at 1:10pm and ends at 2:30pm. You must
An Introduction to Flow Visualization (1) Christoph Garth
 Christoph Garth") An Introduction to Flow Visualization (1) Christoph Garth cgarth@ucdavis.edu Motivation What will I be talking about? Classical: Physical experiments to understand flow. 2 Motivation What will I be talking
An Introduction to Flow Visualization (1) Christoph Garth cgarth@ucdavis.edu Motivation What will I be talking about? Classical: Physical experiments to understand flow. 2 Motivation What will I be talking
Comparing LIC and Spot Noise
 Comparing LIC and Spot Noise Wim de Leeuw Robert van Liere Center for Mathematics and Computer Science, CWI Abstract Spot noise and line integral convolution (LIC) are two texture synthesis techniques
Transformations in Ray Tracing. MIT EECS 6.837, Durand and Cutler
 Transformations in Ray Tracing Linear Algebra Review Session Tonight! 7:30 9 PM Last Time: Simple Transformations Classes of Transformations Representation homogeneous coordinates Composition not commutative
Extraction and Visualization of Swirl and Tumble Motion from Engine Simulation Data
 Extraction and Visualization of Swirl and Tumble Motion from Engine Simulation Data Christoph Garth 1, Robert S. Laramee 2, Xavier Tricoche 3,Jürgen Schneider 4, and Hans Hagen 1 1 Visualization Group,
A Crowdsourcing System for Integrated and Reproducible Evaluation in Scientific Visualization Appendix: Application Cases
 A Crowdsourcing System for Integrated and Reproducible Evaluation in Scientific Visualization Appendix: Application Cases Rickard Englund1 * 1 2 Sathish Kottravel1 Timo Ropinski2 Interactive Visualization
Input Nodes. Surface Input. Surface Input Nodal Motion Nodal Displacement Instance Generator Light Flocking
 Input Nodes Surface Input Nodal Motion Nodal Displacement Instance Generator Light Flocking The different Input nodes, where they can be found, what their outputs are. Surface Input When editing a surface,
Tracing Parallel Vectors
 Tracing Parallel Vectors Jeffrey Sukharev Xiaoqiang Zheng Alex Pang ABSTRACT Feature tracking algorithms usually rely on operators for identifying regions of interest. One of these commonly used operators
GLASGOW 2003 INTEGRATING CFD AND EXPERIMENT
 GLASGOW 2003 INTEGRATING CFD AND EXPERIMENT A Detailed CFD and Experimental Investigation of a Benchmark Turbulent Backward Facing Step Flow Stephen Hall & Tracie Barber University of New South Wales Sydney,
21. Efficient and fast numerical methods to compute fluid flows in the geophysical β plane
 12th International Conference on Domain Decomposition Methods Editors: Tony Chan, Takashi Kako, Hideo Kawarada, Olivier Pironneau, c 2001 DDM.org 21. Efficient and fast numerical methods to compute fluid
Extraction and Visualization of Swirl and Tumble Motion from Engine Simulation Data
 Extraction and Visualization of Swirl and Tumble Motion from Engine Simulation Data Christoph Garth 1, Robert S. Laramee 2, Xavier Tricoche 3, Jürgen Schneider 4, and Hans Hagen 5 1 Visualization Group,
Lecture 1.1 Introduction to Fluid Dynamics
 Lecture 1.1 Introduction to Fluid Dynamics 1 Introduction A thorough study of the laws of fluid mechanics is necessary to understand the fluid motion within the turbomachinery components. In this introductory
NUMERICAL COUPLING BETWEEN DEM (DISCRETE ELEMENT METHOD) AND FEA (FINITE ELEMENTS ANALYSIS).
 AND FEA (FINITE ELEMENTS ANALYSIS).") NUMERICAL COUPLING BETWEEN DEM (DISCRETE ELEMENT METHOD) AND FEA (FINITE ELEMENTS ANALYSIS). Daniel Schiochet Nasato - ESSS Prof. Dr. José Roberto Nunhez Unicamp Dr. Nicolas Spogis - ESSS Fabiano Nunes
NUMERICAL COUPLING BETWEEN DEM (DISCRETE ELEMENT METHOD) AND FEA (FINITE ELEMENTS ANALYSIS). Daniel Schiochet Nasato - ESSS Prof. Dr. José Roberto Nunhez Unicamp Dr. Nicolas Spogis - ESSS Fabiano Nunes
CMSC427 Transformations II: Viewing. Credit: some slides from Dr. Zwicker
 CMSC427 Transformations II: Viewing Credit: some slides from Dr. Zwicker What next? GIVEN THE TOOLS OF The standard rigid and affine transformations Their representation with matrices and homogeneous coordinates
THE FLUCTUATING VELOCITY FIELD ABOVE THE FREE END OF A SURFACE- MOUNTED FINITE-HEIGHT SQUARE PRISM
 THE FLUCTUATING VELOCITY FIELD ABOVE THE FREE END OF A SURFACE- MOUNTED FINITE-HEIGHT SQUARE PRISM Rajat Chakravarty, Noorallah Rostamy, Donald J. Bergstrom and David Sumner Department of Mechanical Engineering
Anatomical Descriptions That Compute Functional Attributes
 Anatomical Descriptions That Compute Functional Attributes Goal: To write a description of an anatomical structure that leads directly to the calculation of its functional attributes. For instance, an