Vector Visualisation 1. global view
|
|
|
- Howard Long
- 5 years ago
- Views:
Transcription
1 Vector Field Visualisation : global view Visualisation Lecture 12 Institute for Perception, Action & Behaviour School of Informatics Vector Visualisation 1
2 Vector Field Visualisation : local & global Vector Fields specify flows through the field aim : visualise flow in field Two properties of vector fields to visualise local view global view with respect to a fixed point (last lecture) e.g. glyphs, lines, warping, displacement etc. trajectory of particles transported by vector field today Vector Visualisation 2
3 Steady / Unsteady Flow Steady flow remains constant over time state of equilibrium or snapshot Unsteady flow varies with time implications to tracing particles Vector Visualisation 3


4 Stream/Streaklines Showing where the vector flow has come from/going to shows flow features such as vortices in flow only shows information for intersected points need to initialise in correct place clutter problem in 3D Vector Visualisation 4
5 Particle trace Particle trace : the path over time of a massless fluid particle transported by the vector field The particle's velocity is always determined by the vector field dx=v dt Express in integral form : x t = V dt t Solve using numerical integration methods. Vector Visualisation 5
6 Steam & Streak lines : the difference Streakline : the set particle traces at a particular time that have previously passed through a specific point (snapshot) Path of the particles that were released from a point x0 at times t0< s < t Streamline : integral curves along a curve s satisfying: s= V ds, with s=s x, t s at a fixed time t Integral in the vector field while keeping the time constant Vector Visualisation 6

7 Streamlines Always tangent to the vector field Fluid do not cross streamline streamlines technically not particle traces For steady flows streamlines == streaklines 2 are equivalent For unsteady flow Every streamline only exists at one moment in time Always changing its shape Vector Visualisation 7
 by air pressure (with is scalar).")
8 Example : convection streaklines Ventilation simulation of a kitchen. - Steady state or equilibrium. Thirty streaklines initiated under a window. Colour mapped (lecture 5) by air pressure (with is scalar). Note the warm air convected by the hot stove. Vector Visualisation 8
9 Showing motion over time A scaled, oriented line is an approximation to a particle s motion in the flow field dx If velocity V = dt Displacement of a point is dx=v dt Need to integrate in order to draw streamlines / streaklines Vector Visualisation 9
10 Numerical Integration Numerical Integration : beyond scope course Accuracy depends on step size dt Results require careful examination But... What do we mean by error in the context of visualisation? At least to make it appear nice Should avoid the path to diverge! It is numerically and visually bad! Vector Visualisation 10
11 Numerical Integration : Euler's Method Seed point. V i Δt x t = V dt t x i Euler's method : x i 1 x i 1 = x i V i Δt New position x i 1 = old position, xi plus instantaneous velocity times incremental time step 2 Numerical Error is O Δt Vector Visualisation 11
12 Problem with Euler's method r r Rotational flow field. With Euler s method, integrated flow occurs in a spiral. With a rotational flow field Euler's method wrongly diverges due to error Vector Visualisation 12
13 nd Runge-Kutta method, 2 Order Seed point. Euler's method : x i 1 = x i V i Δt Runge-Kutta method : Δt x i 1 = x i V i V i 1 2 V i 1 is calculated using Euler's method. Error is O Δt 3 (assuming 0 < t < 1) Vector Visualisation 13
14 nd 2 Order Runge-Kutta Improves accuracy, but more expensive additional function evaluation N.B. 0 < t < 1 Larger time-step for same error 4th Order Runge-Kutta also popular for integration Best method depends on data and interpretation Vector Visualisation 14


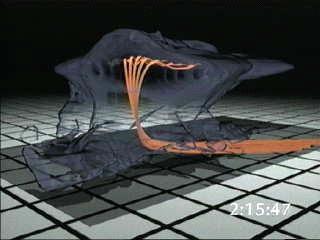
15 Example : thunderstorm simulation Massless particles are introduced in a regular grid Orange indicates ascending Blue indicates descending Vector Visualisation 15


16 Example : thunderstorm simulation Streamers indicate air movement, colours are used as before. Rotation of air is shown by a ribbon. Vector Visualisation 16
17 Computational Issues Computing particle traces is expensive: Interpolation need to interpolate velocity from grid points and in time in the case of unsteady flows Searching need to locate grid box that contains particle Coordinate transformation need to transform from global to local coordinates to perform integration Vector Visualisation 17
18 Variable step Euler method P3 In 2D (lines through cells) Assume vector is constant across cell. P2 P0 P1 Calculate closest intersection of cell edge with ray parallel to vector direction using ray-ray intersection. Iterate for next cell position. Vector Visualisation 18
19 Initialisation of Streamlines Streamlines usually initialised along a curve, or rake Often initialised at a source (e.g. engine thrust) Results can vary depending on placement of rake NASA Ames, FAST system Vector Visualisation 19
20 Rakes : stream origins Streams originate at rake What can a rake show? spreads apart divergence rotates - vorticity What shapes can we put a rake in? Line shows rotation around the line Closed shape - 2D or 3D Vector Visualisation 20
21 Lines & Points visualise particle trace with points show all points simultaneously (like time-lapse photograph) or animate the points over time (for trajectory trace) can connect the points with lines colour mapping to show speed, or use dashes, with length proportional to speed Use ribbons or tubes to show other properties (next lecture) Vector Visualisation 21
22 VTK : Streamlines vtkstreamer base class performs numerical integration to generate particle paths vtkstreamline derived class produces connect stream lines from integration results vtkdashedstreamline / vtkstreampoints derived classes Vector Visualisation 22


23 VTK : Stream Points Stream Points (points along stream line at given separation) N.B. rake = 2D grid Vector Visualisation 23


24 VTK : Dashed Stream Line Uses vtkgylph3d to specify shape to use for dash Vector Visualisation 24

25 Example : carotid artery Visualisation using VTK streamlines solves clarity issues of glyphs streamv.tcl Vector Visualisation 25
26 Summary Global View of Vector Fields visualising transport requires numerical integration Euler's method Runge-Kutta computational issues rakes (where it all begins!) stream {lines points glyphs } next lecture : visualising flow using ribbons, surfaces & texture Vector Visualisation 26
Vector Field Visualisation
 Vector Field Visualisation Computer Animation and Visualization Lecture 14 Institute for Perception, Action & Behaviour School of Informatics Visualising Vectors Examples of vector data: meteorological
Flow Visualisation 1
 Flow Visualisation Visualisation Lecture 13 Institute for Perception, Action & Behaviour School of Informatics Flow Visualisation 1 Flow Visualisation... so far Vector Field Visualisation vector fields
Lecture overview. Visualisatie BMT. Vector algorithms. Vector algorithms. Time animation. Time animation
 Visualisatie BMT Lecture overview Vector algorithms Tensor algorithms Modeling algorithms Algorithms - 2 Arjan Kok a.j.f.kok@tue.nl 1 2 Vector algorithms Vector 2 or 3 dimensional representation of direction
Data Visualization. Fall 2017
 Data Visualization Fall 2017 Vector Fields Vector field v: D R n D is typically 2D planar surface or 2D surface embedded in 3D n = 2 fields tangent to 2D surface n = 3 volumetric fields When visualizing
Volume Illumination & Vector Field Visualisation
 Volume Illumination & Vector Field Visualisation Visualisation Lecture 11 Institute for Perception, Action & Behaviour School of Informatics Volume Illumination & Vector Vis. 1 Previously : Volume Rendering
Vector Visualization. CSC 7443: Scientific Information Visualization
 Vector Visualization Vector data A vector is an object with direction and length v = (v x,v y,v z ) A vector field is a field which associates a vector with each point in space The vector data is 3D representation
Using Integral Surfaces to Visualize CFD Data
 Using Integral Surfaces to Visualize CFD Data Tony Mcloughlin, Matthew Edmunds,, Mark W. Jones, Guoning Chen, Eugene Zhang 1 1 Overview Flow Visualization with Integral Surfaces: Introduction to flow visualization
Vector Visualization
 Vector Visualization Vector Visulization Divergence and Vorticity Vector Glyphs Vector Color Coding Displacement Plots Stream Objects Texture-Based Vector Visualization Simplified Representation of Vector
Vector Visualization Chap. 6 March 7, 2013 March 26, Jie Zhang Copyright
 ector isualization Chap. 6 March 7, 2013 March 26, 2013 Jie Zhang Copyright CDS 301 Spring, 2013 Outline 6.1. Divergence and orticity 6.2. ector Glyphs 6.3. ector Color Coding 6.4. Displacement Plots (skip)
CIS 467/602-01: Data Visualization
 CIS 467/602-01: Data Visualization Vector Field Visualization Dr. David Koop Fields Tables Networks & Trees Fields Geometry Clusters, Sets, Lists Items Items (nodes) Grids Items Items Attributes Links
3D vector fields. Contents. Introduction 3D vector field topology Representation of particle lines. 3D LIC Combining different techniques
 3D vector fields Scientific Visualization (Part 9) PD Dr.-Ing. Peter Hastreiter Contents Introduction 3D vector field topology Representation of particle lines Path lines Ribbons Balls Tubes Stream tetrahedra
Fundamental Algorithms
 Fundamental Algorithms Fundamental Algorithms 3-1 Overview This chapter introduces some basic techniques for visualizing different types of scientific data sets. We will categorize visualization methods
Flow Visualization with Integral Surfaces
 Flow Visualization with Integral Surfaces Visual and Interactive Computing Group Department of Computer Science Swansea University R.S.Laramee@swansea.ac.uk 1 1 Overview Flow Visualization with Integral
Flow Visualisation - Background. CITS4241 Visualisation Lectures 20 and 21
 CITS4241 Visualisation Lectures 20 and 21 Flow Visualisation Flow visualisation is important in both science and engineering From a "theoretical" study of o turbulence or o a fusion reactor plasma, to
An Introduction to Flow Visualization (1) Christoph Garth
 Christoph Garth") An Introduction to Flow Visualization (1) Christoph Garth cgarth@ucdavis.edu Motivation What will I be talking about? Classical: Physical experiments to understand flow. 2 Motivation What will I be talking
An Introduction to Flow Visualization (1) Christoph Garth cgarth@ucdavis.edu Motivation What will I be talking about? Classical: Physical experiments to understand flow. 2 Motivation What will I be talking
Data Visualization (CIS/DSC 468)
") Data Visualization (CIS/DSC 468) Vector Visualization Dr. David Koop Visualizing Volume (3D) Data 2D visualization slice images (or multi-planar reformating MPR) Indirect 3D visualization isosurfaces (or
Data Visualization (CIS/DSC 468) Vector Visualization Dr. David Koop Visualizing Volume (3D) Data 2D visualization slice images (or multi-planar reformating MPR) Indirect 3D visualization isosurfaces (or
Vector Visualization
 Vector Visualization 5-1 Vector Algorithms Vector data is a three-dimensional representation of direction and magnitude. Vector data often results from the study of fluid flow, or when examining derivatives,
Chapter 6 Visualization Techniques for Vector Fields
 Chapter 6 Visualization Techniques for Vector Fields 6.1 Introduction 6.2 Vector Glyphs 6.3 Particle Advection 6.4 Streamlines 6.5 Line Integral Convolution 6.6 Vector Topology 6.7 References 2006 Burkhard
Part I: Theoretical Background and Integration-Based Methods
 Large Vector Field Visualization: Theory and Practice Part I: Theoretical Background and Integration-Based Methods Christoph Garth Overview Foundations Time-Varying Vector Fields Numerical Integration
Chapter 1 - Basic Equations
 2.20 Marine Hydrodynamics, Fall 2017 Lecture 2 Copyright c 2017 MIT - Department of Mechanical Engineering, All rights reserved. 2.20 Marine Hydrodynamics Lecture 2 Chapter 1 - Basic Equations 1.1 Description
Over Two Decades of IntegrationBased, Geometric Vector Field. Visualization
 Over Two Decades of IntegrationBased, Geometric Vector Field Visualization Tony McLoughlin1, 1, Ronald Peikert2, Frits H. Post3, and Min Chen1 1 The Visual and Interactive Computing Group Computer Science
Lecture 1.1 Introduction to Fluid Dynamics
 Lecture 1.1 Introduction to Fluid Dynamics 1 Introduction A thorough study of the laws of fluid mechanics is necessary to understand the fluid motion within the turbomachinery components. In this introductory
MAE 3130: Fluid Mechanics Lecture 5: Fluid Kinematics Spring Dr. Jason Roney Mechanical and Aerospace Engineering
 MAE 3130: Fluid Mechanics Lecture 5: Fluid Kinematics Spring 2003 Dr. Jason Roney Mechanical and Aerospace Engineering Outline Introduction Velocity Field Acceleration Field Control Volume and System Representation
Realistic Animation of Fluids
 Realistic Animation of Fluids p. 1/2 Realistic Animation of Fluids Nick Foster and Dimitri Metaxas Realistic Animation of Fluids p. 2/2 Overview Problem Statement Previous Work Navier-Stokes Equations
Navier-Stokes & Flow Simulation
 Last Time? Navier-Stokes & Flow Simulation Optional Reading for Last Time: Spring-Mass Systems Numerical Integration (Euler, Midpoint, Runge-Kutta) Modeling string, hair, & cloth HW2: Cloth & Fluid Simulation
mjb March 9, 2015 Chuck Evans
 Vector Visualization What is a Vector Visualization Problem? A vector has direction and magnitude. Typically science and engineering problems that work this way are those involving fluid flow through a
FLUID MECHANICS TESTS
 FLUID MECHANICS TESTS Attention: there might be more correct answers to the questions. Chapter 1: Kinematics and the continuity equation T.2.1.1A flow is steady if a, the velocity direction of a fluid
11/1/13. Visualization. Scientific Visualization. Types of Data. Height Field. Contour Curves. Meshes
 CSCI 420 Computer Graphics Lecture 26 Visualization Height Fields and Contours Scalar Fields Volume Rendering Vector Fields [Angel Ch. 2.11] Jernej Barbic University of Southern California Scientific Visualization
Visualization. CSCI 420 Computer Graphics Lecture 26
 CSCI 420 Computer Graphics Lecture 26 Visualization Height Fields and Contours Scalar Fields Volume Rendering Vector Fields [Angel Ch. 11] Jernej Barbic University of Southern California 1 Scientific Visualization
A Broad Overview of Scientific Visualization with a Focus on Geophysical Turbulence Simulation Data (SciVis
 A Broad Overview of Scientific Visualization with a Focus on Geophysical Turbulence Simulation Data (SciVis 101 for Turbulence Researchers) John Clyne clyne@ucar.edu Examples: Medicine Examples: Biology
1 Mathematical Concepts
 1 Mathematical Concepts Mathematics is the language of geophysical fluid dynamics. Thus, in order to interpret and communicate the motions of the atmosphere and oceans. While a thorough discussion of the
Lecture overview. Visualisatie BMT. Fundamental algorithms. Visualization pipeline. Structural classification - 1. Structural classification - 2
 Visualisatie BMT Fundamental algorithms Arjan Kok a.j.f.kok@tue.nl Lecture overview Classification of algorithms Scalar algorithms Vector algorithms Tensor algorithms Modeling algorithms 1 2 Visualization
Volume Rendering. Computer Animation and Visualisation Lecture 9. Taku Komura. Institute for Perception, Action & Behaviour School of Informatics
 Volume Rendering Computer Animation and Visualisation Lecture 9 Taku Komura Institute for Perception, Action & Behaviour School of Informatics Volume Rendering 1 Volume Data Usually, a data uniformly distributed
Visualization Computer Graphics I Lecture 20
 15-462 Computer Graphics I Lecture 20 Visualization Height Fields and Contours Scalar Fields Volume Rendering Vector Fields [Angel Ch. 12] April 15, 2003 Frank Pfenning Carnegie Mellon University http://www.cs.cmu.edu/~fp/courses/graphics/
Height Fields and Contours Scalar Fields Volume Rendering Vector Fields [Angel Ch. 12] April 23, 2002 Frank Pfenning Carnegie Mellon University
![Height Fields and Contours Scalar Fields Volume Rendering Vector Fields [Angel Ch. 12] April 23, 2002 Frank Pfenning Carnegie Mellon University](/thumbs/90/102611276.jpg "Height Fields and Contours Scalar Fields Volume Rendering Vector Fields [Angel Ch. 12] April 23, 2002 Frank Pfenning Carnegie Mellon University") 15-462 Computer Graphics I Lecture 21 Visualization Height Fields and Contours Scalar Fields Volume Rendering Vector Fields [Angel Ch. 12] April 23, 2002 Frank Pfenning Carnegie Mellon University http://www.cs.cmu.edu/~fp/courses/graphics/
15-462 Computer Graphics I Lecture 21 Visualization Height Fields and Contours Scalar Fields Volume Rendering Vector Fields [Angel Ch. 12] April 23, 2002 Frank Pfenning Carnegie Mellon University http://www.cs.cmu.edu/~fp/courses/graphics/
Vector Field Visualization: Introduction
 Vector Field Visualization: Introduction What is a Vector Field? Why It is Important? Vector Fields in Engineering and Science Automotive design [Chen et al. TVCG07,TVCG08] Weather study [Bhatia and Chen
Post Processing, Visualization, and Sample Output
 Chapter 7 Post Processing, Visualization, and Sample Output Upon successful execution of an ADCIRC run, a number of output files will be created. Specifically which files are created depends upon how the
Navier-Stokes & Flow Simulation
 Last Time? Navier-Stokes & Flow Simulation Pop Worksheet! Teams of 2. Hand in to Jeramey after we discuss. Sketch the first few frames of a 2D explicit Euler mass-spring simulation for a 2x3 cloth network
2.29 Numerical Marine Hydrodynamics Spring 2007
 Numerical Marine Hydrodynamics Spring 2007 Course Staff: Instructor: Prof. Henrik Schmidt OCW Web Site: http://ocw.mit.edu/ocwweb/mechanical- Engineering/2-29Spring-2003/CourseHome/index.htm Units: (3-0-9)
Data Representation in Visualisation
 Data Representation in Visualisation Visualisation Lecture 4 Taku Komura Institute for Perception, Action & Behaviour School of Informatics Taku Komura Data Representation 1 Data Representation We have
Visualization Computer Graphics I Lecture 20
 15-462 Computer Graphics I Lecture 20 Visualization Height Fields and Contours Scalar Fields Volume Rendering Vector Fields [Angel Ch. 12] November 20, 2003 Doug James Carnegie Mellon University http://www.cs.cmu.edu/~djames/15-462/fall03
Visualization. Images are used to aid in understanding of data. Height Fields and Contours Scalar Fields Volume Rendering Vector Fields [chapter 26]
![Visualization. Images are used to aid in understanding of data. Height Fields and Contours Scalar Fields Volume Rendering Vector Fields [chapter 26]](/thumbs/74/70771954.jpg "Visualization. Images are used to aid in understanding of data. Height Fields and Contours Scalar Fields Volume Rendering Vector Fields [chapter 26]") Visualization Images are used to aid in understanding of data Height Fields and Contours Scalar Fields Volume Rendering Vector Fields [chapter 26] Tumor SCI, Utah Scientific Visualization Visualize large
Visualization Images are used to aid in understanding of data Height Fields and Contours Scalar Fields Volume Rendering Vector Fields [chapter 26] Tumor SCI, Utah Scientific Visualization Visualize large
1. Interpreting the Results: Visualization 1
 1. Interpreting the Results: Visualization 1 visual/graphical/optical representation of large sets of data: data from experiments or measurements: satellite images, tomography in medicine, microsopy,...
Rendering Smoke & Clouds
 Rendering Smoke & Clouds Game Design Seminar 2007 Jürgen Treml Talk Overview 1. Introduction to Clouds 2. Virtual Clouds based on physical Models 1. Generating Clouds 2. Rendering Clouds using Volume Rendering
Vector Field Visualization: Introduction
 Vector Field Visualization: Introduction What is a Vector Field? A simple 2D steady vector field A vector valued function that assigns a vector (with direction and magnitude) to any given point. It typically
Mass-Spring Systems. Last Time?
 Mass-Spring Systems Last Time? Implicit Surfaces & Marching Cubes/Tetras Collision Detection & Conservative Bounding Regions Spatial Acceleration Data Structures Octree, k-d tree, BSF tree 1 Today Particle
Flow Visualization: The State-of-the-Art
 Flow Visualization: The State-of-the-Art The Visual and Interactive Computing Group Computer Science Department Swansea University Swansea, Wales, UK 1 Overview Introduction to Flow Visualization (FlowViz)
CS-184: Computer Graphics Lecture #21: Fluid Simulation II
 CS-184: Computer Graphics Lecture #21: Fluid Simulation II Rahul Narain University of California, Berkeley Nov. 18 19, 2013 Grid-based fluid simulation Recap: Eulerian viewpoint Grid is fixed, fluid moves
Physics Tutorial 2: Numerical Integration Methods
 Physics Tutorial 2: Numerical Integration Methods Summary The concept of numerically solving differential equations is explained, and applied to real time gaming simulation. Some objects are moved in a
FLOWING FLUIDS AND PRESSURE VARIATION
 Chapter 4 Pressure differences are (often) the forces that move fluids FLOWING FLUIDS AND PRESSURE VARIATION Fluid Mechanics, Spring Term 2011 e.g., pressure is low at the center of a hurricane. For your
21. Efficient and fast numerical methods to compute fluid flows in the geophysical β plane
 12th International Conference on Domain Decomposition Methods Editors: Tony Chan, Takashi Kako, Hideo Kawarada, Olivier Pironneau, c 2001 DDM.org 21. Efficient and fast numerical methods to compute fluid
Anatomy of a Physics Engine. Erwin Coumans
 Anatomy of a Physics Engine Erwin Coumans erwin_coumans@playstation.sony.com How it fits together» Terminology» Rigid Body Dynamics» Collision Detection» Software Design Decisions» Trip through the Physics
Visualizing the Life and Anatomy of Dark Matter
 Visualizing the Life and Anatomy of Dark Matter Subhashis Hazarika Tzu-Hsuan Wei Rajaditya Mukherjee Alexandru Barbur ABSTRACT In this paper we provide a visualization based answer to understanding the
Numerical Methods in Aerodynamics. Fluid Structure Interaction. Lecture 4: Fluid Structure Interaction
 Fluid Structure Interaction Niels N. Sørensen Professor MSO, Ph.D. Department of Civil Engineering, Alborg University & Wind Energy Department, Risø National Laboratory Technical University of Denmark
Previously... contour or image rendering in 2D
 Volume Rendering Visualisation Lecture 10 Taku Komura Institute for Perception, Action & Behaviour School of Informatics Volume Rendering 1 Previously... contour or image rendering in 2D 2D Contour line
Navier-Stokes & Flow Simulation
 Last Time? Navier-Stokes & Flow Simulation Implicit Surfaces Marching Cubes/Tetras Collision Detection & Response Conservative Bounding Regions backtracking fixing Today Flow Simulations in Graphics Flow
CHAPTER 3. Elementary Fluid Dynamics
 CHAPTER 3. Elementary Fluid Dynamics - Understanding the physics of fluid in motion - Derivation of the Bernoulli equation from Newton s second law Basic Assumptions of fluid stream, unless a specific
More Animation Techniques
 CS 231 More Animation Techniques So much more Animation Procedural animation Particle systems Free-form deformation Natural Phenomena 1 Procedural Animation Rule based animation that changes/evolves over
Scalar Algorithms: Contouring
 Scalar Algorithms: Contouring Computer Animation and Visualisation Lecture tkomura@inf.ed.ac.uk Institute for Perception, Action & Behaviour School of Informatics Contouring Scaler Data Last Lecture...
Visualization, Lecture #2d. Part 3 (of 3)
") Visualization, Lecture #2d Flow visualization Flow visualization, Part 3 (of 3) Retrospect: Lecture #2c Flow Visualization, Part 2: FlowVis with arrows numerical integration Euler-integration Runge-Kutta-integration
Visualization, Lecture #2d Flow visualization Flow visualization, Part 3 (of 3) Retrospect: Lecture #2c Flow Visualization, Part 2: FlowVis with arrows numerical integration Euler-integration Runge-Kutta-integration
The Level Set Method. Lecture Notes, MIT J / 2.097J / 6.339J Numerical Methods for Partial Differential Equations
 The Level Set Method Lecture Notes, MIT 16.920J / 2.097J / 6.339J Numerical Methods for Partial Differential Equations Per-Olof Persson persson@mit.edu March 7, 2005 1 Evolving Curves and Surfaces Evolving
Coupling of STAR-CCM+ to Other Theoretical or Numerical Solutions. Milovan Perić
 Coupling of STAR-CCM+ to Other Theoretical or Numerical Solutions Milovan Perić Contents The need to couple STAR-CCM+ with other theoretical or numerical solutions Coupling approaches: surface and volume
Texture Advection. Ronald Peikert SciVis Texture Advection 6-1
 Texture Advection Ronald Peikert SciVis 2007 - Texture Advection 6-1 Texture advection Motivation: dense visualization of vector fields, no seed points needed. Methods for static fields: LIC - Line integral
Course Review. Computer Animation and Visualisation. Taku Komura
 Course Review Computer Animation and Visualisation Taku Komura Characters include Human models Virtual characters Animal models Representation of postures The body has a hierarchical structure Many types
The State of the Art in Flow Visualization, part 1: Direct, Texture-based, and Geometric Techniques
 Volume 22 (2003), Number 2, yet unknown pages The State of the Art in Flow Visualization, part 1: Direct, Texture-based, and Geometric Techniques Helwig Hauser, Robert S. Laramee, Helmut Doleisch, Frits
Debojyoti Ghosh. Adviser: Dr. James Baeder Alfred Gessow Rotorcraft Center Department of Aerospace Engineering
 Debojyoti Ghosh Adviser: Dr. James Baeder Alfred Gessow Rotorcraft Center Department of Aerospace Engineering To study the Dynamic Stalling of rotor blade cross-sections Unsteady Aerodynamics: Time varying
Lagrangian and Eulerian Representations of Fluid Flow: Kinematics and the Equations of Motion
 Lagrangian and Eulerian Representations of Fluid Flow: Kinematics and the Equations of Motion James F. Price Woods Hole Oceanographic Institution Woods Hole, MA, 02543 July 31, 2006 Summary: This essay
Polygonization of Implicit Surfaces
 Polygonization of Implicit Surfaces Hongxin Zhang and Jieqing Feng 2007-01-11 State Key Lab of CAD&CG Zhejiang University Contents Polygonization of Implicit Surfaces Other Methods for Displaying Implicit
Immersed Boundary Method and Chimera Method applied to Fluid-
 The numericsacademy Fixed Colloquium IBM on Moving Immersed IBM Boundary Applications Methods : Conclusion Current Status and Future Research Directions 15-17 June 2009, Academy Building, Amsterdam, the
Computer Animation. Conventional Animation
 Animation The term animation has a Greek (animos) as well as roman (anima) root, meaning to bring to life Life: evolution over time Conventional Animation Animation is a technique in which the illusion
Chapter 4 FLUID KINEMATICS
 Fluid Mechanics: Fundamentals and Applications, 2nd Edition Yunus A. Cengel, John M. Cimbala McGraw-Hill, 2010 Chapter 4 FLUID KINEMATICS Lecture slides by Hasan Hacışevki Copyright The McGraw-Hill Companies,
Over Two Decades of Integration-Based, Geometric Flow Visualization
 Volume xx (200y), Number z, pp. 1 23 Over Two Decades of Integration-Based, Geometric Flow Visualization Tony McLoughlin 1, Robert S. Laramee 1, Ronald Peikert 2, Frits H. Post 3, and Min Chen 1 1 Visual
Measurement Techniques. Digital Particle Image Velocimetry
 Measurement Techniques Digital Particle Image Velocimetry Heat and Mass Transfer Laboratory (LTCM) Sepideh Khodaparast Marco Milan Navid Borhani 1 Content m Introduction m Particle Image Velocimetry features
Volume Illumination, Contouring
 Volume Illumination, Contouring Computer Animation and Visualisation Lecture 0 tkomura@inf.ed.ac.uk Institute for Perception, Action & Behaviour School of Informatics Contouring Scaler Data Overview -
Visualisation of uncertainty. Kai-Mikael Jää-Aro
 Visualisation of uncertainty Kai-Mikael Jää-Aro Why is this important? Visualising uncertainty Means and Methods Scalar data Vector data Volume data Generic methods Let us talk about the weather A weather
Lagrangian methods and Smoothed Particle Hydrodynamics (SPH) Computation in Astrophysics Seminar (Spring 2006) L. J. Dursi
 Computation in Astrophysics Seminar (Spring 2006) L. J. Dursi") Lagrangian methods and Smoothed Particle Hydrodynamics (SPH) Eulerian Grid Methods The methods covered so far in this course use an Eulerian grid: Prescribed coordinates In `lab frame' Fluid elements flow
Lagrangian methods and Smoothed Particle Hydrodynamics (SPH) Eulerian Grid Methods The methods covered so far in this course use an Eulerian grid: Prescribed coordinates In `lab frame' Fluid elements flow
Adarsh Krishnamurthy (cs184-bb) Bela Stepanova (cs184-bs)
 Bela Stepanova (cs184-bs)") OBJECTIVE FLUID SIMULATIONS Adarsh Krishnamurthy (cs184-bb) Bela Stepanova (cs184-bs) The basic objective of the project is the implementation of the paper Stable Fluids (Jos Stam, SIGGRAPH 99). The final
OBJECTIVE FLUID SIMULATIONS Adarsh Krishnamurthy (cs184-bb) Bela Stepanova (cs184-bs) The basic objective of the project is the implementation of the paper Stable Fluids (Jos Stam, SIGGRAPH 99). The final
Separation in three-dimensional steady flows. Part 2 : DETACHMENT AND ATTACHMENT SEPARATION LINES DETACHMENT AND ATTACHMENT SEPARATION SURFACES
 Separation in three-dimensional steady flows Part 2 : DETACHMENT AND ATTACHMENT SEPARATION LINES DETACHMENT AND ATTACHMENT SEPARATION SURFACES Separation lines or separatrices A separation line is a skin
MATH 31A HOMEWORK 9 (DUE 12/6) PARTS (A) AND (B) SECTION 5.4. f(x) = x + 1 x 2 + 9, F (7) = 0
 PARTS (A) AND (B) SECTION 5.4. f(x) = x + 1 x 2 + 9, F (7) = 0") FROM ROGAWSKI S CALCULUS (2ND ED.) SECTION 5.4 18.) Express the antiderivative F (x) of f(x) satisfying the given initial condition as an integral. f(x) = x + 1 x 2 + 9, F (7) = 28.) Find G (1), where
FROM ROGAWSKI S CALCULUS (2ND ED.) SECTION 5.4 18.) Express the antiderivative F (x) of f(x) satisfying the given initial condition as an integral. f(x) = x + 1 x 2 + 9, F (7) = 28.) Find G (1), where
Hierarchical Streamarrows for the Visualization of Dynamical Systems
 Hierarchical Streamarrows for the Visualization of Dynamical Systems Helwig Löffelmann Lukas Mroz Eduard Gröller Institute of Computer Graphics, Vienna University of Technology Abstract. Streamarrows are
Particle Image Velocimetry Part - 3
 AerE 545X class notes #5 Particle Image Velocimetry Part - 3 Hui Hu Department of Aerospace Engineering, Iowa State University Ames, Iowa 50011, U.S.A PIV System Setup Particle tracers: Illumination system:
CS 231. Basics of Computer Animation
 CS 231 Basics of Computer Animation Animation Techniques Keyframing Motion capture Physics models Keyframe animation Highest degree of control, also difficult Interpolation affects end result Timing must
Scalar Visualization
 Scalar Visualization Visualizing scalar data Popular scalar visualization techniques Color mapping Contouring Height plots outline Recap of Chap 4: Visualization Pipeline 1. Data Importing 2. Data Filtering
Cloth Simulation. Tanja Munz. Master of Science Computer Animation and Visual Effects. CGI Techniques Report
 Cloth Simulation CGI Techniques Report Tanja Munz Master of Science Computer Animation and Visual Effects 21st November, 2014 Abstract Cloth simulation is a wide and popular area of research. First papers
The viscous forces on the cylinder are proportional to the gradient of the velocity field at the
 Fluid Dynamics Models : Flow Past a Cylinder Flow Past a Cylinder Introduction The flow of fluid behind a blunt body such as an automobile is difficult to compute due to the unsteady flows. The wake behind
Contours & Implicit Modelling 4
 Brief Recap Contouring & Implicit Modelling Contouring Implicit Functions Visualisation Lecture 8 lecture 6 Marching Cubes lecture 3 visualisation of a Quadric toby.breckon@ed.ac.uk Computer Vision Lab.
CS205b/CME306. Lecture 9
 CS205b/CME306 Lecture 9 1 Convection Supplementary Reading: Osher and Fedkiw, Sections 3.3 and 3.5; Leveque, Sections 6.7, 8.3, 10.2, 10.4. For a reference on Newton polynomial interpolation via divided
Lecture # 11: Particle image velocimetry
 AerE 344 Lecture Notes Lecture # 11: Particle image velocimetry Dr. Hui Hu Dr. Rye M Waldman Department of Aerospace Engineering Iowa State University Ames, Iowa 50011, U.S.A Sources/ Further reading:
The Jello Cube Assignment 1, CSCI 520. Jernej Barbic, USC
 The Jello Cube Assignment 1, CSCI 520 Jernej Barbic, USC 1 The jello cube Undeformed cube Deformed cube The jello cube is elastic, Can be bent, stretched, squeezed,, Without external forces, it eventually
Red Orange the reflected ray. Yellow Green and the normal. Blue Indigo line. Colours of visible reflection
 distance the carrying the moves away from rest position Brightness Loudness The angle between the incident ray and the normal line Amplitude Amplitude of a light Amplitude of a sound incidence Angle between
Volume visualization. Volume visualization. Volume visualization methods. Sources of volume visualization. Sources of volume visualization
 Volume visualization Volume visualization Volumes are special cases of scalar data: regular 3D grids of scalars, typically interpreted as density values. Each data value is assumed to describe a cubic
Faculty of Mechanical and Manufacturing Engineering, University Tun Hussein Onn Malaysia (UTHM), Parit Raja, Batu Pahat, Johor, Malaysia
, Parit Raja, Batu Pahat, Johor, Malaysia") Applied Mechanics and Materials Vol. 393 (2013) pp 305-310 (2013) Trans Tech Publications, Switzerland doi:10.4028/www.scientific.net/amm.393.305 The Implementation of Cell-Centred Finite Volume Method
Applied Mechanics and Materials Vol. 393 (2013) pp 305-310 (2013) Trans Tech Publications, Switzerland doi:10.4028/www.scientific.net/amm.393.305 The Implementation of Cell-Centred Finite Volume Method
Particle tracing in curvilinear grids. David M. Reed, Lawson Wade, Peter G. Carswell, Wayne E. Carlson
 Particle tracing in curvilinear grids David M. Reed, Lawson Wade, Peter G. Carswell, Wayne E. Carlson Advanced Computing Center for the Arts and Design and Department of Computer and Information Science
SIMULATION OF PROPELLER-SHIP HULL INTERACTION USING AN INTEGRATED VLM/RANSE SOLVER MODELING.
 SIMULATION OF PROPELLER-SHIP HULL INTERACTION USING AN INTEGRATED VLM/RANSE SOLVER MODELING. M.N.Senthil Prakash, Department of Ocean Engineering, IIT Madras, India V. Anantha Subramanian Department of
The Spalart Allmaras turbulence model
 The Spalart Allmaras turbulence model The main equation The Spallart Allmaras turbulence model is a one equation model designed especially for aerospace applications; it solves a modelled transport equation
Contours & Implicit Modelling 1
 Contouring & Implicit Modelling Visualisation Lecture 8 Institute for Perception, Action & Behaviour School of Informatics Contours & Implicit Modelling 1 Brief Recap Contouring Implicit Functions lecture
Overview of Traditional Surface Tracking Methods
 Liquid Simulation With Mesh-Based Surface Tracking Overview of Traditional Surface Tracking Methods Matthias Müller Introduction Research lead of NVIDIA PhysX team PhysX GPU acc. Game physics engine www.nvidia.com\physx
Stream Hulls: A 3D Visualization Technique for Chaotic Dynamical Systems
 Stream Hulls: A 3D Visualization Technique for Chaotic Dynamical Systems Kenny Gruchalla Elizabeth Bradley Department of Computer Science, University of Colorado at Boulder, Boulder, Colorado 80309 gruchall@cs.colorado.edu
4 Visualization and. Approximation
 4 Visualization and Approximation b A slope field for the differential equation y tan(x + y) tan(x) tan(y). It is not always possible to write down an explicit formula for the solution to a differential
Flow Structures Extracted from Visualization Images: Vector Fields and Topology
 Flow Structures Extracted from Visualization Images: Vector Fields and Topology Tianshu Liu Department of Mechanical & Aerospace Engineering Western Michigan University, Kalamazoo, MI 49008, USA We live