DATA CLASSIFICATORY TECHNIQUES
|
|
|
- Claude Conley
- 5 years ago
- Views:
Transcription
1 DATA CLASSIFICATORY TECHNIQUES AMRENDER KUMAR AND V.K.BHATIA Indian Agricultural Statistics Research Institute Library Avenue, New Delhi Introduction Rudimentary, exploratory procedures are often quite helpful in understanding the complex nature of multivariate relationship. Searching the data for a structure of "natural" grouping is an important exploratory technique. The most important techniques for data classification are Cluster analysis Discriminant analysis Although both cluster and discriminant analysis classifies objects into categories, discriminant analysis requires one to know group membership for the cases used to decide the classification rule whereas in cluster analysis group membership for all cases is unknown. In addition to membership, the number of groups is also generally unknown. In cluster analysis the units within cluster are similar but different between clusters. The grouping is done on the basis of some criterion like similarities measures etc. Thus in the case of cluster analysis the inputs are similarity measures or the data from which these can be computed. 2. Cluster Analysis Cluster analysis is a technique used for combining observations into groups such that: (a) Each group is homogeneous or compact with respect to certain characteristics i.e., observations in each group are similar to each other. (b) Each group should be different from other groups with respect to the characteristics i.e., observations of one group should be different from the observations of other groups. There are various mathematical methods which help to sort objects into a group of similar objects called a Cluster. Cluster analysis is used in diversified research fields. In biology, cluster analysis is used to identify diseases and their stages. For example, by examining patients who are diagnosed as depressed, one finds that there are several distinct subgroups of patients with different types of depression. In marketing, cluster analysis is used to identify persons with similar buying habits. By examining their characteristics it becomes possible to plan future marketing strategies more efficiently. The objective of cluster analysis is to group observations into clusters such that each cluster is as homogenous as possible with respect to the clustering variables. The various steps in cluster analysis (i) Select a measure of similarity. (ii) Decision is to be made on the type of clustering technique to be used (iii) Type of clustering method for the selected technique (iv) Decision regarding the number of clusters (v) Cluster solution is interpreted.
2 No generalization about cluster analysis is possible as a vast number of clustering methods have been developed in several different fields with different definitions of clusters and similarities. There are many kinds of clusters namely: Disjoint cluster where every object appears in single cluster. Hierarchical clusters where one cluster can be completely contained in another cluster, but no other kind of overlap is permitted Overlapping clusters. Fuzzy clusters, defined by a probability of membership of each object in one cluster. 2.1 Similarity Measures A measure of closeness is required to form simple group structures from complex data sets. A great deal of subjectivity is involved in the choice of similarity measures. Important considerations are the nature of the variables i.e. discrete, continuous or binary or scales of measurement (nominal, ordinal, interval, ratio etc.) and subject matter knowledge. If the items are to be clustered, proximity is usually indicated by some sort of distance. The variables however are grouped on the basis of some measure of association like the correlation co-efficient etc. Some of the measures are Qualitative Variables k variables observed on n units in case of binary response can be represented as follows: j th unit i th unit Yes No Total Yes K 11 K 12 K 11 +K 12 No K 21 K 22 K 21 +K 22 Total K 11 +K 21 K 12 +K 22 K Simple matching coefficient (% matches) d ij = (K 11 + K 22 )/ K (i,j =1,2,,n) This can easily be summarized to polytomous responses. Quantitative Variables In the case of k quantitative variables recorded on n cases, the observations can be expressed as X 11 X 12 X 13 X 1k X 21 X 22 X 23 X 2k X n1 X n2 X n3 X nk Similarity r ij (i,j = 1,2,,n) is the correlation between X ik s with X jk s (Not the same as correlation between variables) Dissimilarity d ij = k 2 (Xik Xjk ) which is the Euclidean distance X s are standardised. It can be calculated for one variable. 2
3 2.2 Hierarchical Agglomeration Hierarchical clustering techniques begin by either a series of successive mergers or of successive divisions. Consider a natural process of grouping Each unit is an entity to start with Merge those two units first which are most similar (least d ij ) - now becomes an entity Examine mutual distance between (n-1) entities Merge those two that are most similar Repeat the process and go on merging till all are merged to form one entity At each stage of agglomerative process, note the distance between the two merging entities Choose that stage which shows sudden jump in this distance (since it indicates that two very dissimilar entities are being merged). This could be subjective. 2.3 Distance Between Entities As there are large numbers of methods available, so it is not possible to enumerate them here but some of them are Single linkage- This method works on the principle of smallest distance or nearest neighbour Complete linkage- It works on the principle of distant neighbour or dissimilarities- Farthest neighbour Average linkage- This works on the principle of average distance. Average of distances between unit of one entity and the other unit of the second entity. Centroid- This method assigns each item to the cluster having nearest centroid (means). The process has three steps Partition the items into k initial clusters Proceed through the list of items assigning an item to the cluster whose centroid (mean) is nearest. Recalculate the centroid (mean) for the cluster receiving the new item and the cluster losing the item. Repeat this step until no more assignments take place Ward s It forms cluster by maximising within cluster homogeneity, within group sum of squares is used as the measure of homogeneity Two stage density linkage Units assigned to modal entities on the basis of densities (frequencies) (k th nearest neighbour) Modal entities allowed to join later on SAS Cluster Procedure The SAS procedures for clustering are oriented towards disjoint or hierarchical cluster from a co-ordinate data, distance or a correlation or covariance matrix. The following procedures are used for clustering CLUSTER FASTCLUS VARCLUS Does hierarchical clustering of observations Finds disjoint clusters of observations using a k-means method applied to co-ordinate data. Recommended for large data sets. It is used for hierarchical as well as non-hierarchical clustering 3
4 TREE Draws the tree diagrams or dendograms using outputs from the CLUSTER or VARCLUS procedures The TREE procedure is considered to be very important because it produces dendrogram, using a data set created by the CLUSTER or VARCLUS procedure and also create output data sets giving the results of hierarchical clustering as tree structure. The TREE procedure uses the output sets to print a diagram. Following is the terminology related to TREE procedure. Leaves Objects that are clustered Root The cluster containing all the objects Branch A cluster containing at least two objects but not all of them Node A general term for leaves, branch and roots Parent & Child If A is union of cluster B and C, then A is parent and B and C are children Specifications The TREE procedure is invoked by the following statements: PROC TREE <options> Optional Statements NAME variables HEIGHT variables PARENT variables BY variables COPY variables FREQ variables ID variables If the data sets have been created by CLUSTER or VARCLUS, the only requirement is the statement PROC TREE. The other optional statements listed above are described after the PROC TREE statement PROC TREE <options> The PROC TREE statement starts the TREE procedure. The options that usually find place in the PROC TREE statement are as given: FUNCTION Specify data set Specify cluster heights OPTION DATA= DOCK= LEVEL= NCLUSTERS= OUT= HEIGHT= DISSIMILAR= SIMILAR= 4
5 Print horizontal trees Control the height axis Control characters printed in trees Control sort order Control output HORIZONTAL INC= MAXHEIGHT= MINHEIGHT= NTICK= PAGES= POS= SPACES= TICKPOPS= FILLCHAR= JOINCHAR= LEAFCHAR= TREECHAR= DESCENDING SORT LIST NOPRINT PAGES By default, the tree diagram is oriented with the height vertical and the object names at the top of the diagram. For horizontal axis HORIZONTAL option can be used. EXERCISE The data along with SAS CODE belongs to different kinds of teeth for a variety of mammals. The objective of the study is to identify suitable clusters of mammals based on the eight variables. Data teeth; Input mammal $ v1 v2 v3 v4 v5 v6 v7 v8; Cards; A B C D E F G H I J K L
6 M N O P Q R S T U V W X Y Z AA BB CC DD EE FF ; proc cluster method=average std pseudo ndesign; var v1-v8; id mammal; This will perform clustering by using average linkage distance method. The following PROC TREE statements use the average linkage distances as height as default proc tree; The following PROC TREE statements sort the clusters at each branch in order of formation and use the number of clusters for the height axis. proc tree sort height=n; The following PROC TREE statements produce no printed output but creates an output data set indicating the cluster to which each observation belongs at the 6-cluster level in the tree; the data set is reproduced by PROC PRINT proc tree noprint out=part nclusters=6; id mammal; copy v1-v8; 6

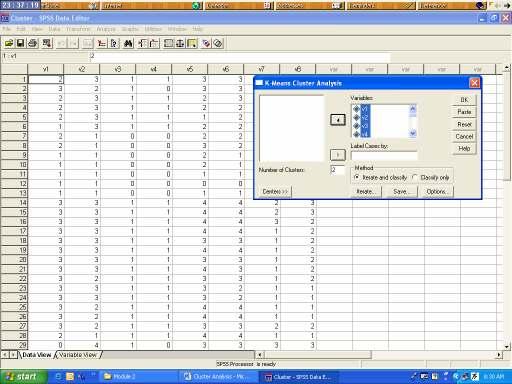
7 proc sort; by cluster; proc print label uniform; id mammal; var v1-v8; format v1-v8 1.; by cluster; Data Entry and Procedure in SPSS Analyze Classify K-Means Cluster Hierarchical Cluster Discrimant K-Means Cluster 7
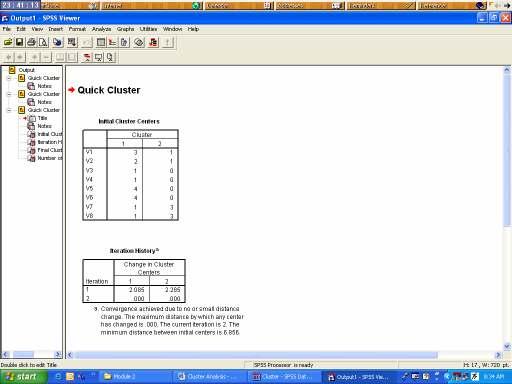
8 Output 8
9 3. Discriminant Analysis Discriminant analysis is a multivariate technique concerned with classifying distinct set of objects (or set of observations) and with allocating new objects or observations to the previously defined groups. It involves deriving variates, which are combination of two or more independent variables that will discriminate best between a priori defined groups. The Objectives of Discriminant Analysis are (i) Identifying a set of variables that best discriminates between the groups. (ii) Identifying a new axis, Z, such that new variables Z, given by the projection of observations onto this new axis, provides the maximum separation or discrimination between the groups. (iii) Classifying future observations into one of the groups. 3.1 Linear Discriminant Function If the population covariance matrices are equal then linear discriminant function for classification is used, otherwise quadratic discriminant function is used for this purpose. The maximum number of discriminant functions that can be computed is equal to minimum of G-1 and p, where G is the number of groups and p is the number of variables. Suppose the first discriminant function is Z = +, 1 W11X1+ W12X2...W1p Xp where the W 1j is the weight of the j th variable for the 1 st discriminant function. The weights of the discriminant function are such that the ratio between groups SS of Z1 λ 1 = is maximized. within groups SS of Z Suppose the second discriminant function is given by, Z + 2 = W21X1+ W22X2...W2pX p The weights of above discriminant function are estimated such that the ratio between groups SS of Z2 λ 2 =, within groups SS of Z 1 2 is maximized subject to the constraint that the discriminant scores Z 1 and Z 2 are uncorrelated. The procedure is repeated until all possible discriminant functions are identified. Once the discriminant functions are identified, the next step is to determine a rule for classifying the future observations. Classification procedure involves the division of the discriminant space in g mutually exclusive and collectively exhaustive regions. For example, to classify any given observation using discriminant scores, the discriminant scores are computed, then the observations are plotted in the discriminant space and the observation is classified into the group in whose region it falls. 9
10 EXERCISE Given below is annual data on weather parameters temp.(max. and min), relative humidity (morning and evening), sunshine hours, amount of rainfall (mm) and number of rainy days for three groups. GROUP MXT MNT RHM RHE SS RAINFALL NOR Analysis through SPSS (analysis based on 20 observations) DATA LIST filename /GROUP MXT MNT RHM RHE SS RAINFALL NOR. LIST. SET LIST result filename. DSCRIMINANT /GROUPS = GROUP(1,3) /VARIABLES MXT TO NOR/ANALYSIS ALL /METHOD DIRECT/STATISTICS ALL. Discriminant Functions Function Eigen value % of variance Wilk s Lamda Chi-square Discriminant Function Coefficients of Weather Variables Function Constant MXT MNT RHM RHE SS RAINFA LL NOR
11 Group Centroids Group Function 1 Function Calculation of Discriminant Score Z 1 = *MXT *MNT *RHM *RHE *SS *RAINFALL *NOR Z 2 = *MXT *MNT *RHM *RHE *SS *RAINFALL *NOR Misclassification Results Actual Group No. of cases Predicted Group Membership Group % % % Group % % 0 0.0% Group % 0 0.0% 6 100% Percentage of grouped cases correctly classified = 76.19% Classification for the future data can be done on the basis of probability of group membership i.e. put the future observation in the group of highest probability. Observation Observed Predicted Probability Probability Probability group group of group 1 of group 2 of group The highest probability of last observation (21) is 0.60 which fall in group 3, thus this observation fall in the group 3. SAS Commands for discriminant Analysis Data weather; title 'Discriminant Analysis '; input GROUP MXT MNT RHM RHE SS RAINFALL NOR; datalines; ; 11
12 proc discrim data=weather method=normal pool=yes list crossvalidate CAN; class group; var MXT MNT RHM RHE SS RAINFALL NOR; References and Suggested Reading Chatfield, C. and Collins, A.J. (1990). Introduction to multivariate analysis. Chapman and Hall publications. Johnson, R.A. and Wichern, D.W. (1996). Applied multivariate statistical analysis. Prentice-Hall of India Private Limited. Sharma, S. (1996). Applied Multivariate Techniques, John Wiley & Sons, New York. 12
CLUSTER ANALYSIS. V. K. Bhatia I.A.S.R.I., Library Avenue, New Delhi
 CLUSTER ANALYSIS V. K. Bhatia I.A.S.R.I., Library Avenue, New Delhi-110 012 In multivariate situation, the primary interest of the experimenter is to examine and understand the relationship amongst the
Forestry Applied Multivariate Statistics. Cluster Analysis
 1 Forestry 531 -- Applied Multivariate Statistics Cluster Analysis Purpose: To group similar entities together based on their attributes. Entities can be variables or observations. [illustration in Class]
Workload Characterization Techniques
 Workload Characterization Techniques Raj Jain Washington University in Saint Louis Saint Louis, MO 63130 Jain@cse.wustl.edu These slides are available on-line at: http://www.cse.wustl.edu/~jain/cse567-08/
Cluster Analysis: Agglomerate Hierarchical Clustering
 Cluster Analysis: Agglomerate Hierarchical Clustering Yonghee Lee Department of Statistics, The University of Seoul Oct 29, 2015 Contents 1 Cluster Analysis Introduction Distance matrix Agglomerative Hierarchical
Chapter 1. Using the Cluster Analysis. Background Information
 Chapter 1 Using the Cluster Analysis Background Information Cluster analysis is the name of a multivariate technique used to identify similar characteristics in a group of observations. In cluster analysis,
Multivariate Analysis
 Multivariate Analysis Cluster Analysis Prof. Dr. Anselmo E de Oliveira anselmo.quimica.ufg.br anselmo.disciplinas@gmail.com Unsupervised Learning Cluster Analysis Natural grouping Patterns in the data
Cluster Analysis. Ying Shen, SSE, Tongji University
 Cluster Analysis Ying Shen, SSE, Tongji University Cluster analysis Cluster analysis groups data objects based only on the attributes in the data. The main objective is that The objects within a group
Cluster Analysis. Mu-Chun Su. Department of Computer Science and Information Engineering National Central University 2003/3/11 1
 Cluster Analysis Mu-Chun Su Department of Computer Science and Information Engineering National Central University 2003/3/11 1 Introduction Cluster analysis is the formal study of algorithms and methods
Cluster Analysis. Angela Montanari and Laura Anderlucci
 Cluster Analysis Angela Montanari and Laura Anderlucci 1 Introduction Clustering a set of n objects into k groups is usually moved by the aim of identifying internally homogenous groups according to a
Clustering and Visualisation of Data
 Clustering and Visualisation of Data Hiroshi Shimodaira January-March 28 Cluster analysis aims to partition a data set into meaningful or useful groups, based on distances between data points. In some
Classification. Vladimir Curic. Centre for Image Analysis Swedish University of Agricultural Sciences Uppsala University
 Classification Vladimir Curic Centre for Image Analysis Swedish University of Agricultural Sciences Uppsala University Outline An overview on classification Basics of classification How to choose appropriate
INF4820, Algorithms for AI and NLP: Hierarchical Clustering
 INF4820, Algorithms for AI and NLP: Hierarchical Clustering Erik Velldal University of Oslo Sept. 25, 2012 Agenda Topics we covered last week Evaluating classifiers Accuracy, precision, recall and F-score
INF4820. Clustering. Erik Velldal. Nov. 17, University of Oslo. Erik Velldal INF / 22
 INF4820 Clustering Erik Velldal University of Oslo Nov. 17, 2009 Erik Velldal INF4820 1 / 22 Topics for Today More on unsupervised machine learning for data-driven categorization: clustering. The task
Cluster Analysis. Prof. Thomas B. Fomby Department of Economics Southern Methodist University Dallas, TX April 2008 April 2010
 Cluster Analysis Prof. Thomas B. Fomby Department of Economics Southern Methodist University Dallas, TX 7575 April 008 April 010 Cluster Analysis, sometimes called data segmentation or customer segmentation,
Unsupervised Learning and Clustering
 Unsupervised Learning and Clustering Selim Aksoy Department of Computer Engineering Bilkent University saksoy@cs.bilkent.edu.tr CS 551, Spring 2009 CS 551, Spring 2009 c 2009, Selim Aksoy (Bilkent University)
Tree Models of Similarity and Association. Clustering and Classification Lecture 5
 Tree Models of Similarity and Association Clustering and Lecture 5 Today s Class Tree models. Hierarchical clustering methods. Fun with ultrametrics. 2 Preliminaries Today s lecture is based on the monograph
3. Cluster analysis Overview
 Université Laval Multivariate analysis - February 2006 1 3.1. Overview 3. Cluster analysis Clustering requires the recognition of discontinuous subsets in an environment that is sometimes discrete (as
Unsupervised Learning and Clustering
 Unsupervised Learning and Clustering Selim Aksoy Department of Computer Engineering Bilkent University saksoy@cs.bilkent.edu.tr CS 551, Spring 2008 CS 551, Spring 2008 c 2008, Selim Aksoy (Bilkent University)
3. Cluster analysis Overview
 Université Laval Analyse multivariable - mars-avril 2008 1 3.1. Overview 3. Cluster analysis Clustering requires the recognition of discontinuous subsets in an environment that is sometimes discrete (as
Clustering CS 550: Machine Learning
 Clustering CS 550: Machine Learning This slide set mainly uses the slides given in the following links: http://www-users.cs.umn.edu/~kumar/dmbook/ch8.pdf http://www-users.cs.umn.edu/~kumar/dmbook/dmslides/chap8_basic_cluster_analysis.pdf
Chapter 6 Continued: Partitioning Methods
 Chapter 6 Continued: Partitioning Methods Partitioning methods fix the number of clusters k and seek the best possible partition for that k. The goal is to choose the partition which gives the optimal
Unsupervised Learning. Presenter: Anil Sharma, PhD Scholar, IIIT-Delhi
 Unsupervised Learning Presenter: Anil Sharma, PhD Scholar, IIIT-Delhi Content Motivation Introduction Applications Types of clustering Clustering criterion functions Distance functions Normalization Which
Cluster analysis. Agnieszka Nowak - Brzezinska
 Cluster analysis Agnieszka Nowak - Brzezinska Outline of lecture What is cluster analysis? Clustering algorithms Measures of Cluster Validity What is Cluster Analysis? Finding groups of objects such that
Summer School in Statistics for Astronomers & Physicists June 15-17, Cluster Analysis
 Summer School in Statistics for Astronomers & Physicists June 15-17, 2005 Session on Computational Algorithms for Astrostatistics Cluster Analysis Max Buot Department of Statistics Carnegie-Mellon University
Discriminate Analysis
 Discriminate Analysis Outline Introduction Linear Discriminant Analysis Examples 1 Introduction What is Discriminant Analysis? Statistical technique to classify objects into mutually exclusive and exhaustive
Data Mining Cluster Analysis: Basic Concepts and Algorithms. Slides From Lecture Notes for Chapter 8. Introduction to Data Mining
 Data Mining Cluster Analysis: Basic Concepts and Algorithms Slides From Lecture Notes for Chapter 8 Introduction to Data Mining by Tan, Steinbach, Kumar Tan,Steinbach, Kumar Introduction to Data Mining
ECLT 5810 Clustering
 ECLT 5810 Clustering What is Cluster Analysis? Cluster: a collection of data objects Similar to one another within the same cluster Dissimilar to the objects in other clusters Cluster analysis Grouping
ECLT 5810 Clustering
 ECLT 5810 Clustering What is Cluster Analysis? Cluster: a collection of data objects Similar to one another within the same cluster Dissimilar to the objects in other clusters Cluster analysis Grouping
Unsupervised Learning : Clustering
 Unsupervised Learning : Clustering Things to be Addressed Traditional Learning Models. Cluster Analysis K-means Clustering Algorithm Drawbacks of traditional clustering algorithms. Clustering as a complex
Part I. Hierarchical clustering. Hierarchical Clustering. Hierarchical clustering. Produces a set of nested clusters organized as a
 Week 9 Based in part on slides from textbook, slides of Susan Holmes Part I December 2, 2012 Hierarchical Clustering 1 / 1 Produces a set of nested clusters organized as a Hierarchical hierarchical clustering
Chapter 6: Cluster Analysis
 Chapter 6: Cluster Analysis The major goal of cluster analysis is to separate individual observations, or items, into groups, or clusters, on the basis of the values for the q variables measured on each
Hierarchical Clustering / Dendrograms
 Chapter 445 Hierarchical Clustering / Dendrograms Introduction The agglomerative hierarchical clustering algorithms available in this program module build a cluster hierarchy that is commonly displayed
CHAPTER 4: CLUSTER ANALYSIS
 CHAPTER 4: CLUSTER ANALYSIS WHAT IS CLUSTER ANALYSIS? A cluster is a collection of data-objects similar to one another within the same group & dissimilar to the objects in other groups. Cluster analysis
Automated Clustering-Based Workload Characterization
 Automated Clustering-Based Worload Characterization Odysseas I. Pentaalos Daniel A. MenascŽ Yelena Yesha Code 930.5 Dept. of CS Dept. of EE and CS NASA GSFC Greenbelt MD 2077 George Mason University Fairfax
Supervised vs. Unsupervised Learning
 Clustering Supervised vs. Unsupervised Learning So far we have assumed that the training samples used to design the classifier were labeled by their class membership (supervised learning) We assume now
INF4820 Algorithms for AI and NLP. Evaluating Classifiers Clustering
 INF4820 Algorithms for AI and NLP Evaluating Classifiers Clustering Erik Velldal & Stephan Oepen Language Technology Group (LTG) September 23, 2015 Agenda Last week Supervised vs unsupervised learning.
Network Traffic Measurements and Analysis
 DEIB - Politecnico di Milano Fall, 2017 Introduction Often, we have only a set of features x = x 1, x 2,, x n, but no associated response y. Therefore we are not interested in prediction nor classification,
Hierarchical Clustering Lecture 9
 Hierarchical Clustering Lecture 9 Marina Santini Acknowledgements Slides borrowed and adapted from: Data Mining by I. H. Witten, E. Frank and M. A. Hall 1 Lecture 9: Required Reading Witten et al. (2011:
Multivariate analyses in ecology. Cluster (part 2) Ordination (part 1 & 2)
 Ordination (part 1 & 2)") Multivariate analyses in ecology Cluster (part 2) Ordination (part 1 & 2) 1 Exercise 9B - solut 2 Exercise 9B - solut 3 Exercise 9B - solut 4 Exercise 9B - solut 5 Multivariate analyses in ecology Cluster
Multivariate analyses in ecology Cluster (part 2) Ordination (part 1 & 2) 1 Exercise 9B - solut 2 Exercise 9B - solut 3 Exercise 9B - solut 4 Exercise 9B - solut 5 Multivariate analyses in ecology Cluster
Machine Learning (BSMC-GA 4439) Wenke Liu
 Wenke Liu") Machine Learning (BSMC-GA 4439) Wenke Liu 01-31-017 Outline Background Defining proximity Clustering methods Determining number of clusters Comparing two solutions Cluster analysis as unsupervised Learning
Machine Learning (BSMC-GA 4439) Wenke Liu 01-31-017 Outline Background Defining proximity Clustering methods Determining number of clusters Comparing two solutions Cluster analysis as unsupervised Learning
2. Find the smallest element of the dissimilarity matrix. If this is D lm then fuse groups l and m.
 Cluster Analysis The main aim of cluster analysis is to find a group structure for all the cases in a sample of data such that all those which are in a particular group (cluster) are relatively similar
Hierarchical Clustering
 What is clustering Partitioning of a data set into subsets. A cluster is a group of relatively homogeneous cases or observations Hierarchical Clustering Mikhail Dozmorov Fall 2016 2/61 What is clustering
INF 4300 Classification III Anne Solberg The agenda today:
 INF 4300 Classification III Anne Solberg 28.10.15 The agenda today: More on estimating classifier accuracy Curse of dimensionality and simple feature selection knn-classification K-means clustering 28.10.15
Homework # 4. Example: Age in years. Answer: Discrete, quantitative, ratio. a) Year that an event happened, e.g., 1917, 1950, 2000.
 Year that an event happened, e.g., 1917, 1950, 2000.") Homework # 4 1. Attribute Types Classify the following attributes as binary, discrete, or continuous. Further classify the attributes as qualitative (nominal or ordinal) or quantitative (interval or ratio).
Homework # 4 1. Attribute Types Classify the following attributes as binary, discrete, or continuous. Further classify the attributes as qualitative (nominal or ordinal) or quantitative (interval or ratio).
Statistical Analysis of Metabolomics Data. Xiuxia Du Department of Bioinformatics & Genomics University of North Carolina at Charlotte
 Statistical Analysis of Metabolomics Data Xiuxia Du Department of Bioinformatics & Genomics University of North Carolina at Charlotte Outline Introduction Data pre-treatment 1. Normalization 2. Centering,
CSE 5243 INTRO. TO DATA MINING
 CSE 5243 INTRO. TO DATA MINING Cluster Analysis: Basic Concepts and Methods Huan Sun, CSE@The Ohio State University 09/25/2017 Slides adapted from UIUC CS412, Fall 2017, by Prof. Jiawei Han 2 Chapter 10.
Lecture 6: Unsupervised Machine Learning Dagmar Gromann International Center For Computational Logic
 SEMANTIC COMPUTING Lecture 6: Unsupervised Machine Learning Dagmar Gromann International Center For Computational Logic TU Dresden, 23 November 2018 Overview Unsupervised Machine Learning overview Association
Methods for Intelligent Systems
 Methods for Intelligent Systems Lecture Notes on Clustering (II) Davide Eynard eynard@elet.polimi.it Department of Electronics and Information Politecnico di Milano Davide Eynard - Lecture Notes on Clustering
BBS654 Data Mining. Pinar Duygulu. Slides are adapted from Nazli Ikizler
 BBS654 Data Mining Pinar Duygulu Slides are adapted from Nazli Ikizler 1 Classification Classification systems: Supervised learning Make a rational prediction given evidence There are several methods for
Latent Class Modeling as a Probabilistic Extension of K-Means Clustering
 Latent Class Modeling as a Probabilistic Extension of K-Means Clustering Latent Class Cluster Models According to Kaufman and Rousseeuw (1990), cluster analysis is "the classification of similar objects
Cluster Analysis for Microarray Data
 Cluster Analysis for Microarray Data Seventh International Long Oligonucleotide Microarray Workshop Tucson, Arizona January 7-12, 2007 Dan Nettleton IOWA STATE UNIVERSITY 1 Clustering Group objects that
Lesson 3. Prof. Enza Messina
 Lesson 3 Prof. Enza Messina Clustering techniques are generally classified into these classes: PARTITIONING ALGORITHMS Directly divides data points into some prespecified number of clusters without a hierarchical
Gene Clustering & Classification
 BINF, Introduction to Computational Biology Gene Clustering & Classification Young-Rae Cho Associate Professor Department of Computer Science Baylor University Overview Introduction to Gene Clustering
Understanding Clustering Supervising the unsupervised
 Understanding Clustering Supervising the unsupervised Janu Verma IBM T.J. Watson Research Center, New York http://jverma.github.io/ jverma@us.ibm.com @januverma Clustering Grouping together similar data
Machine Learning and Data Mining. Clustering (1): Basics. Kalev Kask
: Basics. Kalev Kask") Machine Learning and Data Mining Clustering (1): Basics Kalev Kask Unsupervised learning Supervised learning Predict target value ( y ) given features ( x ) Unsupervised learning Understand patterns of
Machine Learning and Data Mining Clustering (1): Basics Kalev Kask Unsupervised learning Supervised learning Predict target value ( y ) given features ( x ) Unsupervised learning Understand patterns of
CSE 5243 INTRO. TO DATA MINING
 CSE 5243 INTRO. TO DATA MINING Cluster Analysis: Basic Concepts and Methods Huan Sun, CSE@The Ohio State University Slides adapted from UIUC CS412, Fall 2017, by Prof. Jiawei Han 2 Chapter 10. Cluster
Chemometrics. Description of Pirouette Algorithms. Technical Note. Abstract
 19-1214 Chemometrics Technical Note Description of Pirouette Algorithms Abstract This discussion introduces the three analysis realms available in Pirouette and briefly describes each of the algorithms
AN IMPROVED K-MEANS CLUSTERING ALGORITHM FOR IMAGE SEGMENTATION
 AN IMPROVED K-MEANS CLUSTERING ALGORITHM FOR IMAGE SEGMENTATION WILLIAM ROBSON SCHWARTZ University of Maryland, Department of Computer Science College Park, MD, USA, 20742-327, schwartz@cs.umd.edu RICARDO
Applied Clustering Techniques. Jing Dong
 Applied Clustering Techniques Jing Dong Nov 31, 2016 What is cluster analysis? What is Cluster Analysis? Cluster: o Similar to one another within the same cluster o Dissimilar to the objects in other clusters
Finding Clusters 1 / 60
 Finding Clusters Types of Clustering Approaches: Linkage Based, e.g. Hierarchical Clustering Clustering by Partitioning, e.g. k-means Density Based Clustering, e.g. DBScan Grid Based Clustering 1 / 60
Olmo S. Zavala Romero. Clustering Hierarchical Distance Group Dist. K-means. Center of Atmospheric Sciences, UNAM.
 Center of Atmospheric Sciences, UNAM November 16, 2016 Cluster Analisis Cluster analysis or clustering is the task of grouping a set of objects in such a way that objects in the same group (called a cluster)
Unsupervised Learning
 Outline Unsupervised Learning Basic concepts K-means algorithm Representation of clusters Hierarchical clustering Distance functions Which clustering algorithm to use? NN Supervised learning vs. unsupervised
Statistical Pattern Recognition
 Statistical Pattern Recognition Features and Feature Selection Hamid R. Rabiee Jafar Muhammadi Spring 2012 http://ce.sharif.edu/courses/90-91/2/ce725-1/ Agenda Features and Patterns The Curse of Size and
Statistical Pattern Recognition
 Statistical Pattern Recognition Features and Feature Selection Hamid R. Rabiee Jafar Muhammadi Spring 2013 http://ce.sharif.edu/courses/91-92/2/ce725-1/ Agenda Features and Patterns The Curse of Size and
Applied Multivariate Analysis
 Department of Mathematics and Statistics, University of Vaasa, Finland Spring 2017 Cluster Analysis Background 1 Cluster analysis Background Distance data Background Example 1 Consider the following data
Clustering. Chapter 10 in Introduction to statistical learning
 Clustering Chapter 10 in Introduction to statistical learning 16 14 12 10 8 6 4 2 0 2 4 6 8 10 12 14 1 Clustering ² Clustering is the art of finding groups in data (Kaufman and Rousseeuw, 1990). ² What
Dynamic Thresholding for Image Analysis
 Dynamic Thresholding for Image Analysis Statistical Consulting Report for Edward Chan Clean Energy Research Center University of British Columbia by Libo Lu Department of Statistics University of British
Machine Learning (BSMC-GA 4439) Wenke Liu
 Wenke Liu") Machine Learning (BSMC-GA 4439) Wenke Liu 01-25-2018 Outline Background Defining proximity Clustering methods Determining number of clusters Other approaches Cluster analysis as unsupervised Learning Unsupervised
Machine Learning (BSMC-GA 4439) Wenke Liu 01-25-2018 Outline Background Defining proximity Clustering methods Determining number of clusters Other approaches Cluster analysis as unsupervised Learning Unsupervised
8.11 Multivariate regression trees (MRT)
") Multivariate regression trees (MRT) 375 8.11 Multivariate regression trees (MRT) Univariate classification tree analysis (CT) refers to problems where a qualitative response variable is to be predicted
Multivariate regression trees (MRT) 375 8.11 Multivariate regression trees (MRT) Univariate classification tree analysis (CT) refers to problems where a qualitative response variable is to be predicted
University of Florida CISE department Gator Engineering. Clustering Part 2
 Clustering Part 2 Dr. Sanjay Ranka Professor Computer and Information Science and Engineering University of Florida, Gainesville Partitional Clustering Original Points A Partitional Clustering Hierarchical
Hierarchical clustering
 Aprendizagem Automática Hierarchical clustering Ludwig Krippahl Hierarchical clustering Summary Hierarchical Clustering Agglomerative Clustering Divisive Clustering Clustering Features 1 Aprendizagem Automática
COMP5318 Knowledge Management & Data Mining Assignment 1
 COMP538 Knowledge Management & Data Mining Assignment Enoch Lau SID 20045765 7 May 2007 Abstract 5.5 Scalability............... 5 Clustering is a fundamental task in data mining that aims to place similar
Sequence clustering. Introduction. Clustering basics. Hierarchical clustering
 Sequence clustering Introduction Data clustering is one of the key tools used in various incarnations of data-mining - trying to make sense of large datasets. It is, thus, natural to ask whether clustering
Distributed and clustering techniques for Multiprocessor Systems
 www.ijcsi.org 199 Distributed and clustering techniques for Multiprocessor Systems Elsayed A. Sallam Associate Professor and Head of Computer and Control Engineering Department, Faculty of Engineering,
Clustering. Supervised vs. Unsupervised Learning
 Clustering Supervised vs. Unsupervised Learning So far we have assumed that the training samples used to design the classifier were labeled by their class membership (supervised learning) We assume now
Multi-Modal Data Fusion: A Description
 Multi-Modal Data Fusion: A Description Sarah Coppock and Lawrence J. Mazlack ECECS Department University of Cincinnati Cincinnati, Ohio 45221-0030 USA {coppocs,mazlack}@uc.edu Abstract. Clustering groups
10701 Machine Learning. Clustering
 171 Machine Learning Clustering What is Clustering? Organizing data into clusters such that there is high intra-cluster similarity low inter-cluster similarity Informally, finding natural groupings among
Points Lines Connected points X-Y Scatter. X-Y Matrix Star Plot Histogram Box Plot. Bar Group Bar Stacked H-Bar Grouped H-Bar Stacked
 Plotting Menu: QCExpert Plotting Module graphs offers various tools for visualization of uni- and multivariate data. Settings and options in different types of graphs allow for modifications and customizations
Hierarchical clustering
 Hierarchical clustering Based in part on slides from textbook, slides of Susan Holmes December 2, 2012 1 / 1 Description Produces a set of nested clusters organized as a hierarchical tree. Can be visualized
Unsupervised: no target value to predict
 Clustering Unsupervised: no target value to predict Differences between models/algorithms: Exclusive vs. overlapping Deterministic vs. probabilistic Hierarchical vs. flat Incremental vs. batch learning
Unsupervised Learning
 Unsupervised Learning Unsupervised learning Until now, we have assumed our training samples are labeled by their category membership. Methods that use labeled samples are said to be supervised. However,
Working with Unlabeled Data Clustering Analysis. Hsiao-Lung Chan Dept Electrical Engineering Chang Gung University, Taiwan
 Working with Unlabeled Data Clustering Analysis Hsiao-Lung Chan Dept Electrical Engineering Chang Gung University, Taiwan chanhl@mail.cgu.edu.tw Unsupervised learning Finding centers of similarity using
Foundations of Machine Learning CentraleSupélec Fall Clustering Chloé-Agathe Azencot
 Foundations of Machine Learning CentraleSupélec Fall 2017 12. Clustering Chloé-Agathe Azencot Centre for Computational Biology, Mines ParisTech chloe-agathe.azencott@mines-paristech.fr Learning objectives
9/29/13. Outline Data mining tasks. Clustering algorithms. Applications of clustering in biology
 9/9/ I9 Introduction to Bioinformatics, Clustering algorithms Yuzhen Ye (yye@indiana.edu) School of Informatics & Computing, IUB Outline Data mining tasks Predictive tasks vs descriptive tasks Example
CMPUT 391 Database Management Systems. Data Mining. Textbook: Chapter (without 17.10)
") CMPUT 391 Database Management Systems Data Mining Textbook: Chapter 17.7-17.11 (without 17.10) University of Alberta 1 Overview Motivation KDD and Data Mining Association Rules Clustering Classification
CMPUT 391 Database Management Systems Data Mining Textbook: Chapter 17.7-17.11 (without 17.10) University of Alberta 1 Overview Motivation KDD and Data Mining Association Rules Clustering Classification
Acquisition Description Exploration Examination Understanding what data is collected. Characterizing properties of data.
 Summary Statistics Acquisition Description Exploration Examination what data is collected Characterizing properties of data. Exploring the data distribution(s). Identifying data quality problems. Selecting
2. Background. 2.1 Clustering
 2. Background 2.1 Clustering Clustering involves the unsupervised classification of data items into different groups or clusters. Unsupervised classificaiton is basically a learning task in which learning
MATH5745 Multivariate Methods Lecture 13
 MATH5745 Multivariate Methods Lecture 13 April 24, 2018 MATH5745 Multivariate Methods Lecture 13 April 24, 2018 1 / 33 Cluster analysis. Example: Fisher iris data Fisher (1936) 1 iris data consists of
Hierarchical Clustering
 Hierarchical Clustering Hierarchical Clustering Produces a set of nested clusters organized as a hierarchical tree Can be visualized as a dendrogram A tree-like diagram that records the sequences of merges
Unsupervised Learning Hierarchical Methods
 Unsupervised Learning Hierarchical Methods Road Map. Basic Concepts 2. BIRCH 3. ROCK The Principle Group data objects into a tree of clusters Hierarchical methods can be Agglomerative: bottom-up approach
4. Ad-hoc I: Hierarchical clustering
 4. Ad-hoc I: Hierarchical clustering Hierarchical versus Flat Flat methods generate a single partition into k clusters. The number k of clusters has to be determined by the user ahead of time. Hierarchical
Statistics 202: Data Mining. c Jonathan Taylor. Week 8 Based in part on slides from textbook, slides of Susan Holmes. December 2, / 1
 Week 8 Based in part on slides from textbook, slides of Susan Holmes December 2, 2012 1 / 1 Part I Clustering 2 / 1 Clustering Clustering Goal: Finding groups of objects such that the objects in a group
Unsupervised Learning
 Unsupervised Learning Fabio G. Cozman - fgcozman@usp.br November 16, 2018 What can we do? We just have a dataset with features (no labels, no response). We want to understand the data... no easy to define
Part I, Chapters 4 & 5. Data Tables and Data Analysis Statistics and Figures
 Part I, Chapters 4 & 5 Data Tables and Data Analysis Statistics and Figures Descriptive Statistics 1 Are data points clumped? (order variable / exp. variable) Concentrated around one value? Concentrated
Statistical Pattern Recognition
 Statistical Pattern Recognition Features and Feature Selection Hamid R. Rabiee Jafar Muhammadi Spring 2014 http://ce.sharif.edu/courses/92-93/2/ce725-2/ Agenda Features and Patterns The Curse of Size and
Introduction to Clustering
 Introduction to Clustering Ref: Chengkai Li, Department of Computer Science and Engineering, University of Texas at Arlington (Slides courtesy of Vipin Kumar) What is Cluster Analysis? Finding groups of
Clustering part II 1
 Clustering part II 1 Clustering What is Cluster Analysis? Types of Data in Cluster Analysis A Categorization of Major Clustering Methods Partitioning Methods Hierarchical Methods 2 Partitioning Algorithms:
Exploratory data analysis for microarrays
 Exploratory data analysis for microarrays Jörg Rahnenführer Computational Biology and Applied Algorithmics Max Planck Institute for Informatics D-66123 Saarbrücken Germany NGFN - Courses in Practical DNA
Multivariate Methods
 Multivariate Methods Cluster Analysis http://www.isrec.isb-sib.ch/~darlene/embnet/ Classification Historically, objects are classified into groups periodic table of the elements (chemistry) taxonomy (zoology,
CHAPTER THREE THE DISTANCE FUNCTION APPROACH
 50 CHAPTER THREE THE DISTANCE FUNCTION APPROACH 51 3.1 INTRODUCTION Poverty is a multi-dimensional phenomenon with several dimensions. Many dimensions are divided into several attributes. An example of