Analytical and Computer Cartography Winter Lecture 11: Generalization and Structure-to-Structure Transformations
|
|
|
- Laurel Patrick
- 6 years ago
- Views:
Transcription

1 Analytical and Computer Cartography Winter 2017 Lecture 11: Generalization and Structure-to-Structure Transformations
2 Generalization Transformations Conversion of data collected at higher resolutions to lower resolution Change (reduction) in extent due to scale change (e.g. zoom) Less data and less detail Simplicity -> clarity Can be lossless or lossy

3 Less detail and fewer features
4 Generalization: Line to line transformations Problem of "line character" Algorithmic resampling i.e. reduce # of points in finite sample Algorithmic reconstruction Enhancement artificial natural
5 Algorithms (Reviewed by McMaster) N-th Point retention Equidistant Resampling Douglas-Peucker
6
7 Douglas-Peucker aka Ramer Douglas Peucker algorithm, the iterative end-point fit algorithm or the split-and-merge algorithm
8 Pseudocode function DouglasPeucker(PointList[], epsilon) //Find the point with the maximum distance dmax = 0 index = 0 for i = 2 to (length(pointlist) - 1) d = OrthogonalDistance(PointList[i], Line(PointList[1], PointList[end])) if d > dmax index = i dmax = d end end //If max distance is greater than epsilon, recursively simplify if dmax >= epsilon //Recursive call recresults1[] = DouglasPeucker(PointList[1...index], epsilon) recresults2[] = DouglasPeucker(PointList[index...end], epsilon) // Build the result list ResultList[ ] = {recresults1[1...end-1] recresults2[1...end]} else ResultList[] = {PointList[1], PointList[end]} end //Return the result return ResultList[] end
9 Douglas-Peucker for Michigan Counties Example (Using Animation) Courtesy of Brad Allen and Waldo Tobler.
10 Enhancement: adding detail back! Lines Splines Bezier Curves Polynomial Functions Trigonometric Functions (Fourier-based) Fractals Surfaces Fractal Fourier Manual
11 Splines

12 Bezier curves: Match points and guide points Continuous derivative at switching point
13 Polynomial curves
14 Fourier Series

15 Fractals: Fractional Geometry

16 Surfaces: Fractal 2.75

17 Fourier surfaces

18 Algorithms for Areas: Overlay 1. Intersections 2. Chain splitting 3. Polygon reassembly 4. Labeling and attribution


19 Volume-to-Volume Common conversion between two major data structures, vector (TIN) and grid. Often via points and interpolation Problem of VIPs
20 Vector to Raster and Back Again Efficient V->R-> V has eliminated vector-raster debate, BUT is a major source of error Major consumer of processing power Vector to Raster Easy compared to inverse, a form of resampling Grid must relate to coordinates (extent, bounds, resolution, orientation) Rasters can be square, rectangular, hexagonal. Resample at minimum r/2 Both structures may be tiled Problem: What value goes into the cell? Separate arrays for dimensions and binary data? Index entries & look up tables
, the routine has a severely limited range of options")
21 Bressenham s Algorithm Consider drawing a line on a raster grid where we restrict the allowable slopes of the line to the range. If we further restrict the line-drawing routine so that it always increments x as it plots, it becomes clear that, having plotted a point at (x,y), the routine has a severely limited range of options as to where it may put the next point on the line: It may plot the point (x+1,y), or: It may plot the point (x+1,y+1). So, working in the first positive octant of the plane, line drawing becomes a matter of deciding between two possibilities at each step.
22 Resampling Problems


23 Issues in Resampling Drop out Broken lines Fat lines Jaggies Moire patterns


24 Algorithm (e.g. rasterize) Convert form of vectors (e.g. to slope intercept) Thin fat lines Compute implicit inclusion (anti-alias)
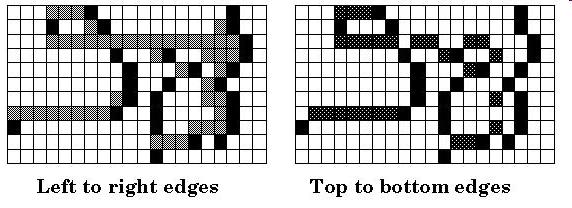
25 Raster to Vector Much harder, more error prone. May involve cartographer intervention (e.g. Laserscan) Importance of allignment Can do points, lines, area

26 WinTopo

27 DXF file created


28 Algorithms Skeletonization and Thinning Peeling/Erosion Dilation Medial Axis Feature Extraction Topological Reconstruction User assisted update

29
30 Data Structure Transformations Scale transformations are lossy (re)storage produce error Algorithmic error, systematic and random Types are: scale structural (data structure) dimensional vector-to-raster

31 JPG using lossy wavelet compression 100% to 1%
32 Data structure transformations
33 The Role of Error Kate Beard: Source error, use error, process error Morrison: Method-produced error Error is inherent, can it be predicted, controlled or minimized? XT = X' X' T -1 = X + E
34 Traditional View of Error Measurement error is random and Gaussian Many errors are also systematic Type 1 and Type 2: Omission and Commission Omission: Something real on the ground was missed Commission: Something NOT on the ground was captured Feature Present Feature Absent Mapped True Positive False positive Not mapped False negative True negative

 known")
35 Map error positional attribute systematic random blunder (e.g. 8 vs. 5) known uncertain
36 Avoiding error Errors can be attributed to poor choice of transformations Chain of transformations: Which contributes most error? Worst case vs average Incompatible sequences of T's (non-invertible) "Hidden" Error = use error, not process error Blunders and misinterpretations: Design! Errors on maps can have major consequences!
37 Summary Line-to-line algorithms resampling vs. modeling Also applies to surfaces Generalization algorithms examined, can they be inverted? Saw examples of data structure transformations Resampling and generalization can cause map errors Showed issues surrounding raster to vector conversion Data structure transformations can be lossy Errors on maps can be caused by sequences of transformation Errors on maps can be blunders, random or systematic
Analytical and Computer Cartography Winter Lecture 9: Geometric Map Transformations
 Analytical and Computer Cartography Winter 2017 Lecture 9: Geometric Map Transformations Cartographic Transformations Attribute Data (e.g. classification) Locational properties (e.g. projection) Graphics
Section 18-1: Graphical Representation of Linear Equations and Functions
 Section 18-1: Graphical Representation of Linear Equations and Functions Prepare a table of solutions and locate the solutions on a coordinate system: f(x) = 2x 5 Learning Outcome 2 Write x + 3 = 5 as
OpenGL Graphics System. 2D Graphics Primitives. Drawing 2D Graphics Primitives. 2D Graphics Primitives. Mathematical 2D Primitives.
 D Graphics Primitives Eye sees Displays - CRT/LCD Frame buffer - Addressable pixel array (D) Graphics processor s main function is to map application model (D) by projection on to D primitives: points,
Werner Purgathofer
 Einführung in Visual Computing 186.822 Visible Surface Detection Werner Purgathofer Visibility in the Rendering Pipeline scene objects in object space object capture/creation ti modeling viewing projection
3D Modeling: Surfaces
 CS 430/536 Computer Graphics I 3D Modeling: Surfaces Week 8, Lecture 16 David Breen, William Regli and Maxim Peysakhov Geometric and Intelligent Computing Laboratory Department of Computer Science Drexel
Lecture 18 Representation and description I. 2. Boundary descriptors
 Lecture 18 Representation and description I 1. Boundary representation 2. Boundary descriptors What is representation What is representation After segmentation, we obtain binary image with interested regions
Computer Graphics. - Rasterization - Philipp Slusallek
 Computer Graphics - Rasterization - Philipp Slusallek Rasterization Definition Given some geometry (point, 2D line, circle, triangle, polygon, ), specify which pixels of a raster display each primitive
2D rendering takes a photo of the 2D scene with a virtual camera that selects an axis aligned rectangle from the scene. The photograph is placed into
 2D rendering takes a photo of the 2D scene with a virtual camera that selects an axis aligned rectangle from the scene. The photograph is placed into the viewport of the current application window. A pixel
Points and lines. x x 1 + y 1. y = mx + b
 Points and lines Point is the fundamental element of the picture representation. It is nothing but the position in a plan defined as either pairs or triplets of number depending on whether the data are
A Distributed Approach to Fast Map Overlay
 A Distributed Approach to Fast Map Overlay Peter Y. Wu Robert Morris University Abstract Map overlay is the core operation in many GIS applications. We briefly survey the different approaches, and describe
7 Fractions. Number Sense and Numeration Measurement Geometry and Spatial Sense Patterning and Algebra Data Management and Probability
 7 Fractions GRADE 7 FRACTIONS continue to develop proficiency by using fractions in mental strategies and in selecting and justifying use; develop proficiency in adding and subtracting simple fractions;
0. Introduction: What is Computer Graphics? 1. Basics of scan conversion (line drawing) 2. Representing 2D curves
 2. Representing 2D curves") CSC 418/2504: Computer Graphics Course web site (includes course information sheet): http://www.dgp.toronto.edu/~elf Instructor: Eugene Fiume Office: BA 5266 Phone: 416 978 5472 (not a reliable way) Email:
CSC 418/2504: Computer Graphics Course web site (includes course information sheet): http://www.dgp.toronto.edu/~elf Instructor: Eugene Fiume Office: BA 5266 Phone: 416 978 5472 (not a reliable way) Email:
(Refer Slide Time: 00:03:51)
") Computer Graphics Prof. Sukhendu Das Dept. of Computer Science and Engineering Indian Institute of Technology, Madras Lecture 17 Scan Converting Lines, Circles and Ellipses Hello and welcome everybody
Computer Graphics Prof. Sukhendu Das Dept. of Computer Science and Engineering Indian Institute of Technology, Madras Lecture 17 Scan Converting Lines, Circles and Ellipses Hello and welcome everybody
Spatial Data Structures
 Spatial Data Structures Hierarchical Bounding Volumes Regular Grids Octrees BSP Trees Constructive Solid Geometry (CSG) [Angel 9.10] Outline Ray tracing review what rays matter? Ray tracing speedup faster
Introduction to Geographic Information Science. Some Updates. Last Lecture 4/6/2017. Geography 4103 / Raster Data and Tesselations.
 Geography 43 / 3 Introduction to Geographic Information Science Raster Data and Tesselations Schedule Some Updates Last Lecture We finished DBMS and learned about storage of data in complex databases Relational
CHAPTER 1 Graphics Systems and Models 3
 ?????? 1 CHAPTER 1 Graphics Systems and Models 3 1.1 Applications of Computer Graphics 4 1.1.1 Display of Information............. 4 1.1.2 Design.................... 5 1.1.3 Simulation and Animation...........
Curves. Computer Graphics CSE 167 Lecture 11
 Curves Computer Graphics CSE 167 Lecture 11 CSE 167: Computer graphics Polynomial Curves Polynomial functions Bézier Curves Drawing Bézier curves Piecewise Bézier curves Based on slides courtesy of Jurgen
Homework #2. Hidden Surfaces, Projections, Shading and Texture, Ray Tracing, and Parametric Curves
 Computer Graphics Instructor: Brian Curless CSE 457 Spring 2013 Homework #2 Hidden Surfaces, Projections, Shading and Texture, Ray Tracing, and Parametric Curves Assigned: Sunday, May 12 th Due: Thursday,
CS 130. Scan Conversion. Raster Graphics
 CS 130 Scan Conversion Raster Graphics 2 1 Image Formation Computer graphics forms images, generally two dimensional, using processes analogous to physical imaging systems like: - Cameras - Human visual
4.5 VISIBLE SURFACE DETECTION METHODES
 4.5 VISIBLE SURFACE DETECTION METHODES A major consideration in the generation of realistic graphics displays is identifying those parts of a scene that are visible from a chosen viewing position. There
CS123 INTRODUCTION TO COMPUTER GRAPHICS. Describing Shapes. Constructing Objects in Computer Graphics 1/15
 Describing Shapes Constructing Objects in Computer Graphics 1/15 2D Object Definition (1/3) Lines and polylines: Polylines: lines drawn between ordered points A closed polyline is a polygon, a simple polygon
DIGITAL TERRAIN MODELS
 DIGITAL TERRAIN MODELS 1 Digital Terrain Models Dr. Mohsen Mostafa Hassan Badawy Remote Sensing Center GENERAL: A Digital Terrain Models (DTM) is defined as the digital representation of the spatial distribution
CPSC / Scan Conversion
 CPSC 599.64 / 601.64 Computer Screens: Raster Displays pixel rasters (usually) square pixels in rectangular raster evenly cover the image problem no such things such as lines, circles, etc. scan conversion
Maps as Numbers. Maps as Numbers. Chapter 3: Maps as Numbers 14SND Getting Started with GIS Chapter 3
 Maps as Numbers Getting Started with GIS Chapter 3 Chapter 3: Maps as Numbers 3.1 Representing Maps as Numbers 3.2 Structuring Attributes 3.3 Structuring Maps 3.4 Why Topology Matters 3.5 Formats for GIS
Spatial Data Structures
 15-462 Computer Graphics I Lecture 17 Spatial Data Structures Hierarchical Bounding Volumes Regular Grids Octrees BSP Trees Constructive Solid Geometry (CSG) April 1, 2003 [Angel 9.10] Frank Pfenning Carnegie
Digital Image Processing Fundamentals
 Ioannis Pitas Digital Image Processing Fundamentals Chapter 7 Shape Description Answers to the Chapter Questions Thessaloniki 1998 Chapter 7: Shape description 7.1 Introduction 1. Why is invariance to
Line Generalisation Algorithms Specific Theory
 Line Generalisation Algorithms Specific Theory Digital Generalisation Digital generalisation can be defined as the process of deriving, from a data source, a symbolically or digitally-encoded cartographic
Lossy Coding 2 JPEG. Perceptual Image Coding. Discrete Cosine Transform JPEG. CS559 Lecture 9 JPEG, Raster Algorithms
 CS559 Lecture 9 JPEG, Raster Algorithms These are course notes (not used as slides) Written by Mike Gleicher, Sept. 2005 With some slides adapted from the notes of Stephen Chenney Lossy Coding 2 Suppose
Curves and Surfaces 1
 Curves and Surfaces 1 Representation of Curves & Surfaces Polygon Meshes Parametric Cubic Curves Parametric Bi-Cubic Surfaces Quadric Surfaces Specialized Modeling Techniques 2 The Teapot 3 Representing
Topic 6 Representation and Description
 Topic 6 Representation and Description Background Segmentation divides the image into regions Each region should be represented and described in a form suitable for further processing/decision-making Representation
Spatial Data Structures
 15-462 Computer Graphics I Lecture 17 Spatial Data Structures Hierarchical Bounding Volumes Regular Grids Octrees BSP Trees Constructive Solid Geometry (CSG) March 28, 2002 [Angel 8.9] Frank Pfenning Carnegie
Warping and Morphing. Ligang Liu Graphics&Geometric Computing Lab USTC
 Warping and Morphing Ligang Liu Graphics&Geometric Computing Lab USTC http://staff.ustc.edu.cn/~lgliu Metamorphosis "transformation of a shape and its visual attributes" Intrinsic in our environment Deformations
DIGITAL TERRAIN MODELLING. Endre Katona University of Szeged Department of Informatics
 DIGITAL TERRAIN MODELLING Endre Katona University of Szeged Department of Informatics katona@inf.u-szeged.hu The problem: data sources data structures algorithms DTM = Digital Terrain Model Terrain function:
Section 7D Systems of Linear Equations
 Section 7D Systems of Linear Equations Companies often look at more than one equation of a line when analyzing how their business is doing. For example a company might look at a cost equation and a profit
Line Drawing. Introduction to Computer Graphics Torsten Möller / Mike Phillips. Machiraju/Zhang/Möller
 Line Drawing Introduction to Computer Graphics Torsten Möller / Mike Phillips Rendering Pipeline Hardware Modelling Transform Visibility Illumination + Shading Perception, Color Interaction Texture/ Realism
GTPS Curriculum Mathematics Grade 8
 4.2.8.B2 Use iterative procedures to generate geometric patterns: Fractals (e.g., the Koch Snowflake); Self-similarity; Construction of initial stages; Patterns in successive stages (e.g., number of triangles
CS337 INTRODUCTION TO COMPUTER GRAPHICS. Describing Shapes. Constructing Objects in Computer Graphics. Bin Sheng Representing Shape 9/20/16 1/15
 Describing Shapes Constructing Objects in Computer Graphics 1/15 2D Object Definition (1/3) Lines and polylines: Polylines: lines drawn between ordered points A closed polyline is a polygon, a simple polygon
GRAPHING WORKSHOP. A graph of an equation is an illustration of a set of points whose coordinates satisfy the equation.
 GRAPHING WORKSHOP A graph of an equation is an illustration of a set of points whose coordinates satisfy the equation. The figure below shows a straight line drawn through the three points (2, 3), (-3,-2),
CS559: Computer Graphics. Lecture 12: Antialiasing & Visibility Li Zhang Spring 2008
 CS559: Computer Graphics Lecture 12: Antialiasing & Visibility Li Zhang Spring 2008 Antialising Today Hidden Surface Removal Reading: Shirley ch 3.7 8 OpenGL ch 1 Last time A 2 (x 0 y 0 ) (x 1 y 1 ) P
Sec 4.1 Coordinates and Scatter Plots. Coordinate Plane: Formed by two real number lines that intersect at a right angle.
 Algebra I Chapter 4 Notes Name Sec 4.1 Coordinates and Scatter Plots Coordinate Plane: Formed by two real number lines that intersect at a right angle. X-axis: The horizontal axis Y-axis: The vertical
From Ver(ces to Fragments: Rasteriza(on
 From Ver(ces to Fragments: Rasteriza(on From Ver(ces to Fragments 3D vertices vertex shader rasterizer fragment shader final pixels 2D screen fragments l determine fragments to be covered l interpolate
FMA901F: Machine Learning Lecture 3: Linear Models for Regression. Cristian Sminchisescu
 FMA901F: Machine Learning Lecture 3: Linear Models for Regression Cristian Sminchisescu Machine Learning: Frequentist vs. Bayesian In the frequentist setting, we seek a fixed parameter (vector), with value(s)
Computer Graphics : Bresenham Line Drawing Algorithm, Circle Drawing & Polygon Filling
 Computer Graphics : Bresenham Line Drawing Algorithm, Circle Drawing & Polygon Filling Downloaded from :www.comp.dit.ie/bmacnamee/materials/graphics/006- Contents In today s lecture we ll have a loo at:
Chapter 3. Sukhwinder Singh
 Chapter 3 Sukhwinder Singh PIXEL ADDRESSING AND OBJECT GEOMETRY Object descriptions are given in a world reference frame, chosen to suit a particular application, and input world coordinates are ultimately
1 Preview. Dr. Scott Gordon Computer Science Dept. CSUS. Virtual Cameras, Viewing Transformations: CSc-155 Advanced Computer Graphics
 CSc-155 Advanced Computer Graphics 1 Preview Dr. Scott Gordon Computer Science Dept. CSUS Course Description Modeling, viewing, and rendering techniques in 3D computer graphics systems. Topics include:
Lecture IV Bézier Curves
 Lecture IV Bézier Curves Why Curves? Why Curves? Why Curves? Why Curves? Why Curves? Linear (flat) Curved Easier More pieces Looks ugly Complicated Fewer pieces Looks smooth What is a curve? Intuitively:
Visible Surface Detection Methods
 Visible urface Detection Methods Visible-urface Detection identifying visible parts of a scene (also hidden- elimination) type of algorithm depends on: complexity of scene type of objects available equipment
Rasterization: Geometric Primitives
 Rasterization: Geometric Primitives Outline Rasterizing lines Rasterizing polygons 1 Rasterization: What is it? How to go from real numbers of geometric primitives vertices to integer coordinates of pixels
UNIT -8 IMPLEMENTATION
 UNIT -8 IMPLEMENTATION 1. Discuss the Bresenham s rasterization algorithm. How is it advantageous when compared to other existing methods? Describe. (Jun2012) 10M Ans: Consider drawing a line on a raster
CEng 477 Introduction to Computer Graphics Fall 2007
 Visible Surface Detection CEng 477 Introduction to Computer Graphics Fall 2007 Visible Surface Detection Visible surface detection or hidden surface removal. Realistic scenes: closer objects occludes the
You should be able to plot points on the coordinate axis. You should know that the the midpoint of the line segment joining (x, y 1 1
 Name GRAPHICAL REPRESENTATION OF DATA: You should be able to plot points on the coordinate axis. You should know that the the midpoint of the line segment joining (x, y 1 1 ) and (x, y ) is x1 x y1 y,.
Contour Simplification with Defined Spatial Accuracy
 Contour Simplification with Defined Spatial Accuracy Bulent Cetinkaya, Serdar Aslan, Yavuz Selim Sengun, O. Nuri Cobankaya, Dursun Er Ilgin General Command of Mapping, 06100 Cebeci, Ankara, Turkey bulent.cetinkaya@hgk.mil.tr
Point Lattices in Computer Graphics and Visualization how signal processing may help computer graphics
 Point Lattices in Computer Graphics and Visualization how signal processing may help computer graphics Dimitri Van De Ville Ecole Polytechnique Fédérale de Lausanne Biomedical Imaging Group dimitri.vandeville@epfl.ch
Fall CSCI 420: Computer Graphics. 4.2 Splines. Hao Li.
 Fall 2014 CSCI 420: Computer Graphics 4.2 Splines Hao Li http://cs420.hao-li.com 1 Roller coaster Next programming assignment involves creating a 3D roller coaster animation We must model the 3D curve
Parametric Curves. University of Texas at Austin CS384G - Computer Graphics
 Parametric Curves University of Texas at Austin CS384G - Computer Graphics Fall 2010 Don Fussell Parametric Representations 3 basic representation strategies: Explicit: y = mx + b Implicit: ax + by + c
Interactive Graphics. Lecture 9: Introduction to Spline Curves. Interactive Graphics Lecture 9: Slide 1
 Interactive Graphics Lecture 9: Introduction to Spline Curves Interactive Graphics Lecture 9: Slide 1 Interactive Graphics Lecture 13: Slide 2 Splines The word spline comes from the ship building trade
Boundary Simplification in Slide 5.0 and Phase 2 7.0
 Boundary Simplification in Slide 5.0 and Phase 2 7.0 Often geometry for a two dimensional slope stability or finite element analysis is taken from a slice through a geological model. The resulting two
Chapter 8: Implementation- Clipping and Rasterization
 Chapter 8: Implementation- Clipping and Rasterization Clipping Fundamentals Cohen-Sutherland Parametric Polygons Circles and Curves Text Basic Concepts: The purpose of clipping is to remove objects or
Output Primitives. Dr. S.M. Malaek. Assistant: M. Younesi
 Output Primitives Dr. S.M. Malaek Assistant: M. Younesi Output Primitives Output Primitives: Basic geometric structures (points, straight line segment, circles and other conic sections, quadric surfaces,
The Graph of an Equation Graph the following by using a table of values and plotting points.
 Precalculus - Calculus Preparation - Section 1 Graphs and Models Success in math as well as Calculus is to use a multiple perspective -- graphical, analytical, and numerical. Thanks to Rene Descartes we
03 Vector Graphics. Multimedia Systems. 2D and 3D Graphics, Transformations
 Multimedia Systems 03 Vector Graphics 2D and 3D Graphics, Transformations Imran Ihsan Assistant Professor, Department of Computer Science Air University, Islamabad, Pakistan www.imranihsan.com Lectures
Feature description. IE PŁ M. Strzelecki, P. Strumiłło
 Feature description After an image has been segmented the detected region needs to be described (represented) in a form more suitable for further processing. Representation of an image region can be carried
Splines. Parameterization of a Curve. Curve Representations. Roller coaster. What Do We Need From Curves in Computer Graphics? Modeling Complex Shapes
 CSCI 420 Computer Graphics Lecture 8 Splines Jernej Barbic University of Southern California Hermite Splines Bezier Splines Catmull-Rom Splines Other Cubic Splines [Angel Ch 12.4-12.12] Roller coaster
MATRIX REVIEW PROBLEMS: Our matrix test will be on Friday May 23rd. Here are some problems to help you review.
 MATRIX REVIEW PROBLEMS: Our matrix test will be on Friday May 23rd. Here are some problems to help you review. 1. The intersection of two non-parallel planes is a line. Find the equation of the line. Give
CSCI 4620/8626. Coordinate Reference Frames
 CSCI 4620/8626 Computer Graphics Graphics Output Primitives Last update: 2014-02-03 Coordinate Reference Frames To describe a picture, the world-coordinate reference frame (2D or 3D) must be selected.
COMPUTER GRAPHICS COURSE. Rendering Pipelines
 COMPUTER GRAPHICS COURSE Rendering Pipelines Georgios Papaioannou - 2014 A Rendering Pipeline Rendering or Graphics Pipeline is the sequence of steps that we use to create the final image Many graphics/rendering
Watershed Sciences 4930 & 6920 GEOGRAPHIC INFORMATION SYSTEMS
 HOUSEKEEPING Watershed Sciences 4930 & 6920 GEOGRAPHIC INFORMATION SYSTEMS Quizzes Lab 8? WEEK EIGHT Lecture INTERPOLATION & SPATIAL ESTIMATION Joe Wheaton READING FOR TODAY WHAT CAN WE COLLECT AT POINTS?
SPATIAL DATA MODELS Introduction to GIS Winter 2015
 SPATIAL DATA MODELS Introduction to GIS Winter 2015 GIS Data Organization The basics Data can be organized in a variety of ways Spatial location, content (attributes), frequency of use Come up with a system
Line Drawing. Foundations of Computer Graphics Torsten Möller
 Line Drawing Foundations of Computer Graphics Torsten Möller Rendering Pipeline Hardware Modelling Transform Visibility Illumination + Shading Perception, Interaction Color Texture/ Realism Reading Angel
Interactive Math Glossary Terms and Definitions
 Terms and Definitions Absolute Value the magnitude of a number, or the distance from 0 on a real number line Addend any number or quantity being added addend + addend = sum Additive Property of Area the
CSE 167: Introduction to Computer Graphics Lecture #10: View Frustum Culling
 CSE 167: Introduction to Computer Graphics Lecture #10: View Frustum Culling Jürgen P. Schulze, Ph.D. University of California, San Diego Fall Quarter 2015 Announcements Project 4 due tomorrow Project
Renderer Implementation: Basics and Clipping. Overview. Preliminaries. David Carr Virtual Environments, Fundamentals Spring 2005
 INSTITUTIONEN FÖR SYSTEMTEKNIK LULEÅ TEKNISKA UNIVERSITET Renderer Implementation: Basics and Clipping David Carr Virtual Environments, Fundamentals Spring 2005 Feb-28-05 SMM009, Basics and Clipping 1
More Raster Line Issues. Bresenham Circles. Once More: 8-Pt Symmetry. Only 1 Octant Needed. Spring 2013 CS5600
 Spring 03 Lecture Set 3 Bresenham Circles Intro to Computer Graphics From Rich Riesenfel Spring 03 More Raster Line Issues Fat lines with multiple pixel with Symmetric lines n point geometry how shoul
Scalar Algorithms: Contouring
 Scalar Algorithms: Contouring Computer Animation and Visualisation Lecture tkomura@inf.ed.ac.uk Institute for Perception, Action & Behaviour School of Informatics Contouring Scaler Data Last Lecture...
EE795: Computer Vision and Intelligent Systems
 EE795: Computer Vision and Intelligent Systems Spring 2012 TTh 17:30-18:45 FDH 204 Lecture 10 130221 http://www.ee.unlv.edu/~b1morris/ecg795/ 2 Outline Review Canny Edge Detector Hough Transform Feature-Based
Justify all your answers and write down all important steps. Unsupported answers will be disregarded.
 Numerical Analysis FMN011 2017/05/30 The exam lasts 5 hours and has 15 questions. A minimum of 35 points out of the total 70 are required to get a passing grade. These points will be added to those you
Image Morphing. The user is responsible for defining correspondences between features Very popular technique. since Michael Jackson s clips
 Image Morphing Image Morphing Image Morphing Image Morphing The user is responsible for defining correspondences between features Very popular technique since Michael Jackson s clips Morphing Coordinate
Computer Graphics. Chapter 4 Attributes of Graphics Primitives. Somsak Walairacht, Computer Engineering, KMITL 1
 Computer Graphics Chapter 4 Attributes of Graphics Primitives Somsak Walairacht, Computer Engineering, KMITL 1 Outline OpenGL State Variables Point Attributes Line Attributes Fill-Area Attributes Scan-Line
Parametric Curves. University of Texas at Austin CS384G - Computer Graphics Fall 2010 Don Fussell
 Parametric Curves University of Texas at Austin CS384G - Computer Graphics Fall 2010 Don Fussell Parametric Representations 3 basic representation strategies: Explicit: y = mx + b Implicit: ax + by + c
Spatial Data Structures
 CSCI 420 Computer Graphics Lecture 17 Spatial Data Structures Jernej Barbic University of Southern California Hierarchical Bounding Volumes Regular Grids Octrees BSP Trees [Angel Ch. 8] 1 Ray Tracing Acceleration
9. Three Dimensional Object Representations
 9. Three Dimensional Object Representations Methods: Polygon and Quadric surfaces: For simple Euclidean objects Spline surfaces and construction: For curved surfaces Procedural methods: Eg. Fractals, Particle
Describe Plane Shapes
 Lesson 12.1 Describe Plane Shapes You can use math words to describe plane shapes. point an exact position or location line endpoints line segment ray a straight path that goes in two directions without
EF432. Introduction to spagetti and meatballs
 EF432 Introduction to spagetti and meatballs CSC 418/2504: Computer Graphics Course web site (includes course information sheet): http://www.dgp.toronto.edu/~karan/courses/418/fall2015 Instructor: Karan
Scope and Sequence for the New Jersey Core Curriculum Content Standards
 Scope and Sequence for the New Jersey Core Curriculum Content Standards The following chart provides an overview of where within Prentice Hall Course 3 Mathematics each of the Cumulative Progress Indicators
CSE 167: Introduction to Computer Graphics Lecture #13: Curves. Jürgen P. Schulze, Ph.D. University of California, San Diego Fall Quarter 2017
 CSE 167: Introduction to Computer Graphics Lecture #13: Curves Jürgen P. Schulze, Ph.D. University of California, San Diego Fall Quarter 2017 Announcements Project 4 due Monday Nov 27 at 2pm Next Tuesday:
EECS490: Digital Image Processing. Lecture #23
 Lecture #23 Motion segmentation & motion tracking Boundary tracking Chain codes Minimum perimeter polygons Signatures Motion Segmentation P k Accumulative Difference Image Positive ADI Negative ADI (ADI)
Spatial Data Structures
 CSCI 480 Computer Graphics Lecture 7 Spatial Data Structures Hierarchical Bounding Volumes Regular Grids BSP Trees [Ch. 0.] March 8, 0 Jernej Barbic University of Southern California http://www-bcf.usc.edu/~jbarbic/cs480-s/
Aliasing and Antialiasing. ITCS 4120/ Aliasing and Antialiasing
 Aliasing and Antialiasing ITCS 4120/5120 1 Aliasing and Antialiasing What is Aliasing? Errors and Artifacts arising during rendering, due to the conversion from a continuously defined illumination field
Page 1. Area-Subdivision Algorithms z-buffer Algorithm List Priority Algorithms BSP (Binary Space Partitioning Tree) Scan-line Algorithms
 Scan-line Algorithms") Visible Surface Determination Visibility Culling Area-Subdivision Algorithms z-buffer Algorithm List Priority Algorithms BSP (Binary Space Partitioning Tree) Scan-line Algorithms Divide-and-conquer strategy:
Visible Surface Determination Visibility Culling Area-Subdivision Algorithms z-buffer Algorithm List Priority Algorithms BSP (Binary Space Partitioning Tree) Scan-line Algorithms Divide-and-conquer strategy:
Rasterization, or What is glbegin(gl_lines) really doing?
 really doing?") Rasterization, or What is glbegin(gl_lines) really doing? Course web page: http://goo.gl/eb3aa February 23, 2012 Lecture 4 Outline Rasterizing lines DDA/parametric algorithm Midpoint/Bresenham s algorithm
Rasterization, or What is glbegin(gl_lines) really doing? Course web page: http://goo.gl/eb3aa February 23, 2012 Lecture 4 Outline Rasterizing lines DDA/parametric algorithm Midpoint/Bresenham s algorithm
Surface Modeling. Polygon Tables. Types: Generating models: Polygon Surfaces. Polygon surfaces Curved surfaces Volumes. Interactive Procedural
 Surface Modeling Types: Polygon surfaces Curved surfaces Volumes Generating models: Interactive Procedural Polygon Tables We specify a polygon surface with a set of vertex coordinates and associated attribute
Interpolation and Basis Fns
 CS148: Introduction to Computer Graphics and Imaging Interpolation and Basis Fns Topics Today Interpolation Linear and bilinear interpolation Barycentric interpolation Basis functions Square, triangle,,
Output models Drawing Rasterization Color models
 Output models Drawing Rasterization olor models Fall 2004 6.831 UI Design and Implementation 1 Fall 2004 6.831 UI Design and Implementation 2 omponents Graphical objects arranged in a tree with automatic
GEOGRAPHIC INFORMATION SYSTEMS Lecture 25: 3D Analyst
 GEOGRAPHIC INFORMATION SYSTEMS Lecture 25: 3D Analyst 3D Analyst - 3D Analyst is an ArcGIS extension designed to work with TIN data (triangulated irregular network) - many of the tools in 3D Analyst also
GEOMETRIC TOOLS FOR COMPUTER GRAPHICS
 GEOMETRIC TOOLS FOR COMPUTER GRAPHICS PHILIP J. SCHNEIDER DAVID H. EBERLY MORGAN KAUFMANN PUBLISHERS A N I M P R I N T O F E L S E V I E R S C I E N C E A M S T E R D A M B O S T O N L O N D O N N E W
Homework #2. Shading, Projections, Texture Mapping, Ray Tracing, and Bezier Curves
 Computer Graphics Instructor: Brian Curless CSEP 557 Autumn 2016 Homework #2 Shading, Projections, Texture Mapping, Ray Tracing, and Bezier Curves Assigned: Wednesday, Nov 16 th Due: Wednesday, Nov 30
TI- Nspire Testing Instructions
 TI- Nspire Testing Instructions Table of Contents How to Nsolve How to Check Compositions of Functions How to Verify Compositions of Functions How to Check Factoring How to Use Graphs to Backward Factor
Lesson 5 overview. Concepts. Interpolators. Assessing accuracy Exercise 5
 Interpolation Tools Lesson 5 overview Concepts Sampling methods Creating continuous surfaces Interpolation Density surfaces in GIS Interpolators IDW, Spline,Trend, Kriging,Natural neighbors TopoToRaster
Thoughts on Representing Spatial Objects. William A. Huber Quantitative Decisions Rosemont, PA
 Thoughts on Representing Spatial Objects William A. Huber Quantitative Decisions Rosemont, PA Overview 1. Some Ways to Structure Space 2. What to Put into a Grid 3. Objects and Fields 4. Hybrid Structures
Lecture 25 of 41. Spatial Sorting: Binary Space Partitioning Quadtrees & Octrees
 Spatial Sorting: Binary Space Partitioning Quadtrees & Octrees William H. Hsu Department of Computing and Information Sciences, KSU KSOL course pages: http://bit.ly/hgvxlh / http://bit.ly/evizre Public