11. Image Data Analytics. Jacobs University Visualization and Computer Graphics Lab
|
|
|
- Bertram O’Connor’
- 6 years ago
- Views:
Transcription
1 11. Image Data Analytics
2 Motivation Images (and even videos) have become a popular data format for storing information digitally. Data Analytics 377


3 Motivation Traditionally, scientific and medical imaging techniques were considered. Data Analytics 378

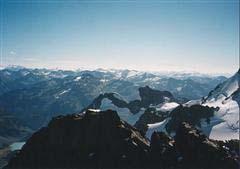
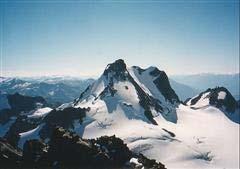
4 Motivation Nowadays, photographs form the majority. 1 pixel Data Analytics 379
5 Image Analytics? Similarity computation is difficult. Similar images may look very different. E.g., two photographs of cars may have completely different colors and shapes. Digital image processing allows for the detection of features in the images. Semantic queries on images is difficult without metadata. Data Analytics 380
6 Semantic gap Image processing allows for the detection of regions of certain properties (typically homogeneous regions). Heuristics can be used to combine homogeneous regions to larger structures. Larger structures can be considered as low-level semantics. E.g., detect human hands. The problem is to bridge the low-level semanstics to high-level semantics as in queries: E.g., show me all images, where presidents are shaking hands. The gap between the low-level and high-level semantics is called the semantic gap. Data Analytics 381
7 11.1 Digital Image Processing
8 Digital Image Processing Image Restoration Morphological Processing Image Enhancement Segmentation Image Acquisition Object Recognition Problem Domain Colour Image Processing Image Compression Representation & Description Data Analytics 383
9 Image Aquisition Image Restoration Morphological Processing Image Enhancement Segmentation Image Acquisition Object Recognition Problem Domain Colour Image Processing Image Compression Representation & Description Data Analytics 384


10 Image Enhancement Image Restoration Morphological Processing Image Enhancement Segmentation Image Acquisition Object Recognition Problem Domain Colour Image Processing Image Compression Representation & Description Data Analytics 385


11 Image Restoration Image Restoration Morphological Processing Image Enhancement Segmentation Image Acquisition Object Recognition Problem Domain Colour Image Processing Image Compression Representation & Description Data Analytics 386

12 Morphological Processing Image Restoration Morphological Processing Image Enhancement Segmentation Image Acquisition Object Recognition Problem Domain Colour Image Processing Image Compression Representation & Description Data Analytics 387

13 Segmentation Image Restoration Morphological Processing Image Enhancement Segmentation Image Acquisition Object Recognition Problem Domain Colour Image Processing Image Compression Representation & Description Data Analytics 388
14 Object Recognition Image Restoration Morphological Processing Image Enhancement Segmentation Image Acquisition Object Recognition Problem Domain Colour Image Processing Image Compression Representation & Description Data Analytics 389
15 Representation & Description Image Restoration Morphological Processing Image Enhancement Segmentation Image Acquisition Object Recognition Problem Domain Colour Image Processing Image Compression Representation & Description Data Analytics 390

16 Image Compression Image Restoration Morphological Processing Image Enhancement Segmentation Image Acquisition Object Recognition Problem Domain Colour Image Processing Image Compression Representation & Description Data Analytics 391

17 Colour Image Processing Image Restoration Morphological Processing Image Enhancement Segmentation Image Acquisition Object Recognition Problem Domain Colour Image Processing Image Compression Representation & Description Data Analytics 392
18 11.2 Image Segmentation Data Analytics 393

19 Definition Image segmentation is the operation of partitioning an image into a collection of connected sets of pixels. Data Analytics 394
20 Definition A segmentation is a partition of an image I into a set of regions S satisfying the following conditions: 1. Partition covers the whole image. 2. No regions intersect. 3. Each region is homogeneous within itself. 4. Adjacent regions form no homogeneous region when united. Data Analytics 395
21 Region Growing Region growing techniques start with one pixel of a potential region and try to grow it by adding adjacent pixels till the pixels being compared are too disimilar. The first pixel selected can be just the first unlabeled pixel in the image or a set of seed pixels can be chosen from the image. Usually a statistical test is used to decide which pixels can be added to a region, e.g., threshold on (N-1) * N T = (y - X) / S (N+1) to decide whether pixel with intensity y is added, where X denotes the mean, S standard deviation, and N is the number of pixels in the region /2 Data Analytics 396

22 Region Growing Result: image segmentation Data Analytics 397
23 Clustering Apply a clustering approach on the pixel intensities. Histogram-based approaches try to automatically split the range of the intensities by looking into minima of the histogram. Data Analytics 398
24 Clustering We can use the clustering methods we have been looking into. For example, we can use k-means with a guessed number of segments k. There exist modifications to k-means that look into local statistics to consider spatial distribution of pixels. Data Analytics 399

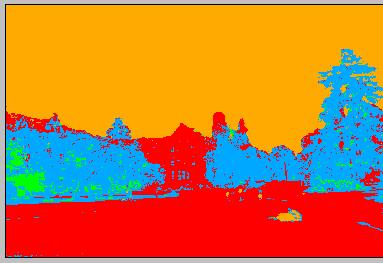
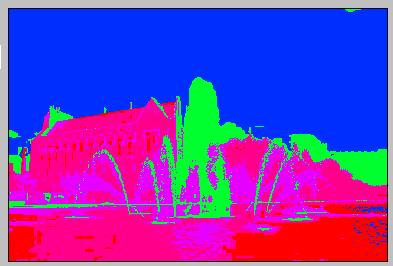
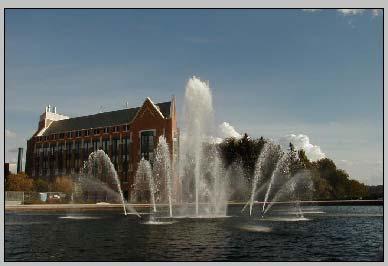
25 Results for k-means: Clustering Data Analytics 400
26 Clustering Graph cut algorithms are widely used. Let G = (V,E) be a graph. The vertices V represent the pixels. Each edge (u,v) has a weight w(u,v) that represents the similarity between u and v. The goal is to partition the vertices into disjoint sets with high similarity within each set and low similarity across sets. Graph G can be broken into 2 disjoint graphs by removing edges that connect these sets. The segmentation is obtained by finding minimal cuts of G. Data Analytics 401
27 Clustering Graph cuts with normalized cut: cut(a,b) = uεa, vεb w(u,v). A cut(a, B) cut(a,b) Ncut(A,B) = asso(a,v) asso(b,v) B asso(a,v) = w(u,t) u A, t V 3 3 Ncut(A,B) = Data Analytics 402

28 Clustering Graph cut results: Data Analytics 403
29 11.3 Image Collection Data Analytics Data Analytics 404
30 Image collections Image segmentation helps to identify certain features in the image. They do not work perfectly. However, if we are trying to perform a data analytics approach on a collection of images, the data segmentation results are only of use for low-level semantics queries. Is there a way to analyze a collection of images on a higher level? Data Analytics 405
31 Data analytics Assume that we can characterize an image by a number of image descriptors, we can try to compute similarities based on those descriptors. Then, we can build a similarity (or distance) matrix of pairwise (dis-)similarities of images. Based on the similarity (or distance) matrix, we can apply the data analytics approaches: Cluster approaches, Classification approaches, Interactive visual analysis based on MDS projections. Data Analytics 406
32 Data analytics example Corel data set includes 1,000 photographs on 10 different themes, described by 150 dimensions (SIFT descriptors). The Medical data set is of magnetic resonance (MRI) images and has 540 objects and 28 dimensions (Fourier descriptors and energies derived from histograms, plus mean intensity and standard deviation). Data Analytics 407

33 Projection-based visualization of labeled data Data Analytics 408
34 11.4 Image Descriptors Data Analytics 409
35 Image descriptors Fourier analysis Wavelet analysis SIFT features Color statistics Data Analytics 410
36 Image Transforms Many times, image processing tasks are best performed in a domain other than the spatial domain. Key steps (1) Transform the image (2) Carry the task(s) in the transformed domain. (3) Apply inverse transform to return to the spatial domain. Data Analytics 411
37 Fourier Series Theorem Any periodic function f(t) can be expressed as a weighted sum (infinite) of sine and cosine functions of varying frequency: is called the fundamental frequency Data Analytics 412
38 Fourier Series α 1 α 2 α 3 Data Analytics 413
39 Continuous Fourier Transform (FT) Transforms a signal (i.e., function) from the spatial (x) domain to the frequency (u) domain. where Data Analytics 414


40 Example: Removing undesirable frequencies noisy signal frequencies To remove certain frequencies, set their corresponding F(u) coefficients to zero! remove high frequencies reconstructed signal Data Analytics 415


41 How do frequencies show up in an image? Low frequencies correspond to slowly varying pixel intensities (e.g., continuous surface). High frequencies correspond to quickly varying pixel intensities (e.g., edges) Original Image Low-passed Data Analytics 416
 Bandreject filter Output image Data")
42 Example of noise reduction using FT Input image Spectrum (frequency domain) Bandreject filter Output image Data Analytics 417
43 Extending FT in 2D Forward FT Inverse FT Data Analytics 418
44 Discrete Fourier Transform Assume that f(x,y) is M x N. Forward DFT Inverse DFT: Data Analytics 419

45 Extending DFT to 2D 2D cos/sin functions Interpretation: Data Analytics 420
")
 magnitude (woman) Data")
46 Magnitude and Phase of DFT only phase only magnitude phase (woman) magnitude (rectangle) phase (rectangle) magnitude (woman) Data Analytics 421
47 Wavelet transform An alternative to Fourier transforms are wavelet transforms. They have the advantage that they represent the image at multiple levels of details. Data Analytics 422

48 B-spline representation coarsening details Data Analytics 423
49 B-spline representation Haar wavelet transform Data Analytics 424


50 Haar wavelets Basis function Wavelet function Data Analytics 425


51 Haar wavelets Data Analytics 426

52 Multiresolution representation Data Analytics 427
53 Multiresolution representation Object is represented as a sequence of resolutions. The resolutions are called levels (levels of detail, LOD) The differences are called detail coefficients. The levels build a multiresolution hierarchy: The level is the base level. The base level does not need to be represented by a regular mesh. All levels use then semi-regular meshes. Data Analytics 428
54 Multiresolution representation with Haar wavelets Data Analytics 429
55 2D Haar wavelet transform 2D basis and wavelet functions are tensor products of 1D basis and wavelet functions. Data Analytics 430

56 2D Haar wavelet transform Basis: Data Analytics 431
57 2D Haar wavelet transform Data Analytics 432
58 2D Haar wavelet transform Alternative construction: Use 2D basis function and three 2D wavelet functions Data Analytics 433

59 2D Haar wavelet transform Basis: Data Analytics 434

60 2D Haar wavelet transform Advantage: One obtains undistorted downscaled versions of the 2D image. Data Analytics 435


61 2D wavelet transform in RGB space Data Analytics 436

62 Image compression Haar wavelets: 100% 21% 4% 1% Error: 0% 5% 10% 15% Data Analytics 437

63 Image compression JPEG 2000: Cohen-Daubechies-Feauveau wavelets Data Analytics 438

64 Image compression JPEG 2000: lossy compression leads to blurring. Data Analytics 439
65 SIFT features The scale-invariant feature transform (SIFT) is another transform that can be used to describe image characteristics. Data Analytics 440


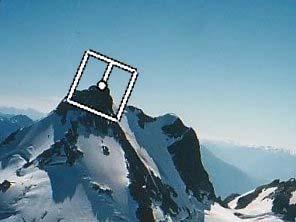

66 Canonical Frames Data Analytics 441

67 Multi-Scale Oriented Patches Extract oriented patches at multiple scales Data Analytics 442
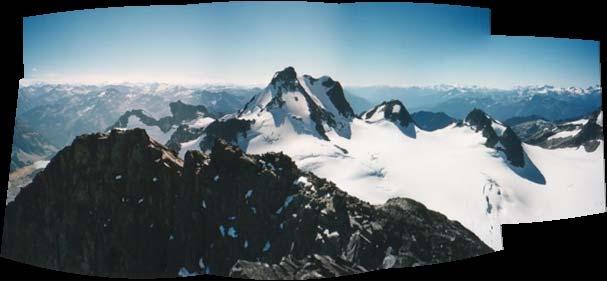
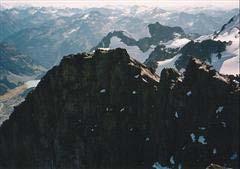
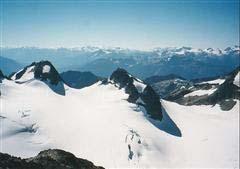

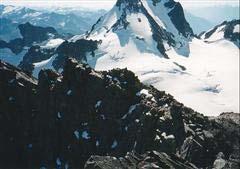

68 Application: Image Stitching Data Analytics 443
69 Multi-Scale Oriented Patches 1. Detect an interesting patch with an interest operator. Patches are translation invariant. 2. Determine its dominant orientation. 3. Rotate the patch so that the dominant orientation points upward. This makes the patches rotation invariant. 4. Do this at multiple scales, converting them all to one scale through sampling. 5. Convert to illumination invariant form Data Analytics 444

70 Idea of SIFT Image content is transformed into local feature coordinates that are invariant to translation, rotation, scale, and other imaging parameters Data Analytics 445
71 Claimed Advantages of SIFT Locality: features are local, so robust to occlusion and clutter (no prior segmentation) Distinctiveness: individual features can be matched to a large database of objects Quantity: many features can be generated for even small objects Efficiency: close to real-time performance Extensibility: can easily be extended to wide range of differing feature types, with each adding robustness Data Analytics 446
72 Overall Procedure at a High Level 1. Scale-space extrema detection Search over multiple scales and image locations. 2. Keypoint localization Fit a model to determine location and scale. Select keypoints based on a measure of stability. 3. Orientation assignment Compute best orientation(s) for each keypoint region. 4. Keypoint description Use local image gradients at selected scale and rotation to describe each keypoint region. Data Analytics 447

73 Using SIFT for Matching Objects 11/15/ Data Analytics 448
74 Color statistics We have been looking at greyscale images (application: medical imaging data). We have been using histograms on color distribution. However, photographs are typically color images. How can we process color statistics? Data Analytics 449
75 11.5 Color Models Data Analytics 450
76 Electromagnetic spectrum purple blue green yellow orange red Data Analytics 451

77 Visible light spectrum Data Analytics 452

78 Relative sensitivity of human eye The ability of the human eye to distinguish colors is based on the sensitivity in the retina to light of different wavelength. Data Analytics 453
79 Tristimulus The retina contains 3 types of receptor cells, which is called tristimulus. The receptors are most responsive to light of wavelengths 420nm, 534nm, and 564nm. Data Analytics 454
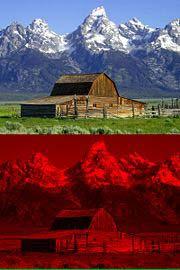
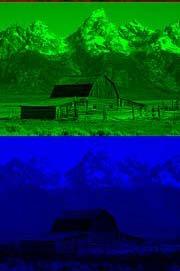
80 RGB color model Idea: Use three wavelengths R, G, and B that reflect monochromatic light and represent a tristimulus. Other colors are obtained by combining/mixing the three components R, G, and B. Data Analytics 455
 G = green (546.")
 Arrange them in a 3D Cartesian")
81 RGB color model Implementation: Choose three colors: R = red (700 nm) G = green (546.1 nm) B = blue (435.8 nm) Arrange them in a 3D Cartesian coordinate system such that Data Analytics 456
82 RGB color model This model allows the generation of colors c with where. Data Analytics 457


83 RGB color cube All colors c that can be generated are represented by the unit cube in the 3D Cartesian coordinate system. green yellow cyan grey white black red blue magenta Data Analytics 458

84 Additive color scheme RGB color model is additive, i.e., adding colors makes the resulting color brighter. Application: color monitors. Data Analytics 459
85 Composition example Data Analytics 460

86 Compositing in the RGB color cube Data Analytics 461
87 Caveat It is often believed that the RGB color model reflects the tristimulus of the human eye. Thisiswrong. In particular, the large wavelength of the human eye s tristimulus is 565 nm, which is not red but rather yellow-green. Data Analytics 462
88 Choice of RGB wavelength The choice of the wavelength in the RGB model has historical and practical reasons. When first monitors were developed, generating monochromatic light was a difficult task. The chosen wavelength were those that could be generated most easily. Data Analytics 463
89 Reconstruction of visible spectral light In order to reconstruct all wavelengths of the visible spectral light, we have to add the R, G, and B components with the following weighting factors: Data Analytics 464


90 Reconstruction of visible spectral light The negative values indicate that not all visible colors can be produced with the RGB color model. Nevertheless, close approximations can be achieved. Data Analytics 465
91 11.6 Assignment
92 Assignment 9 Download and extract the archive of an image collection data set from The data set consists of around 5,000 images of different buildings in Oxford. If processing of the entire data set takes too long, you may use a subset, but make sure the subset contains images of different buildings. Then, convert the color images to grayscale images. Approach 1: Interpreting the grayscale images as 1D vectors of pixel intensities, run a clustering algorithm with an appropriate distance metric. What do the clusters represent? Approach 2: Transform the greyscale images into the space of SIFT descriptors. How many dimensions does this space have? Hint: You may use the Python bindings of OpenCV. Here is a tutorial: py_feature2d/py_sift_intro/py_sift_intro.html. Apply a clustering approach to the SIFT descriptors and visualise the result in an MDS projection (in 2D). What do the clusters represent? p.t.o Data Analytics 467
93 Assignment 9 Approach 3: Exchange the order of the two analysis steps in Approach 2, i.e., first project the SIFT descriptors to a 2D space using an MDS approach and then cluster the 2D points using the same clustering approach as above. Again, visualise the result. What do the discovered clusters represent? How do the three approaches compare? Data Analytics 468
The SIFT (Scale Invariant Feature
 The SIFT (Scale Invariant Feature Transform) Detector and Descriptor developed by David Lowe University of British Columbia Initial paper ICCV 1999 Newer journal paper IJCV 2004 Review: Matt Brown s Canonical
Final Review. Image Processing CSE 166 Lecture 18
 Final Review Image Processing CSE 166 Lecture 18 Topics covered Basis vectors Matrix based transforms Wavelet transform Image compression Image watermarking Morphological image processing Segmentation
SCALE INVARIANT FEATURE TRANSFORM (SIFT)
") 1 SCALE INVARIANT FEATURE TRANSFORM (SIFT) OUTLINE SIFT Background SIFT Extraction Application in Content Based Image Search Conclusion 2 SIFT BACKGROUND Scale-invariant feature transform SIFT: to detect
1 SCALE INVARIANT FEATURE TRANSFORM (SIFT) OUTLINE SIFT Background SIFT Extraction Application in Content Based Image Search Conclusion 2 SIFT BACKGROUND Scale-invariant feature transform SIFT: to detect
Digital Image Processing
 Digital Image Processing Third Edition Rafael C. Gonzalez University of Tennessee Richard E. Woods MedData Interactive PEARSON Prentice Hall Pearson Education International Contents Preface xv Acknowledgments
Color, Texture and Segmentation. CSE 455 Linda Shapiro
 Color, Texture and Segmentation CSE 455 Linda Shapiro Color Spaces RGB HSI/HSV CIE L*a*b YIQ and more standard for cameras hue, saturation, intensity intensity plus 2 color channels color TVs, Y is intensity
Digital Image Processing. Introduction
 Digital Image Processing Introduction Digital Image Definition An image can be defined as a twodimensional function f(x,y) x,y: Spatial coordinate F: the amplitude of any pair of coordinate x,y, which
Example 2: Straight Lines. Image Segmentation. Example 3: Lines and Circular Arcs. Example 1: Regions
 Image Segmentation Image segmentation is the operation of partitioning an image into a collection of connected sets of pixels. 1. into regions, which usually cover the image Example : Straight Lines. into
Example 1: Regions. Image Segmentation. Example 3: Lines and Circular Arcs. Example 2: Straight Lines. Region Segmentation: Segmentation Criteria
 Image Segmentation Image segmentation is the operation of partitioning an image into a collection of connected sets of pixels. 1. into regions, which usually cover the image Example 1: Regions. into linear
Scale Invariant Feature Transform
 Scale Invariant Feature Transform Why do we care about matching features? Camera calibration Stereo Tracking/SFM Image moiaicing Object/activity Recognition Objection representation and recognition Image
Image Segmentation. Selim Aksoy. Bilkent University
 Image Segmentation Selim Aksoy Department of Computer Engineering Bilkent University saksoy@cs.bilkent.edu.tr Examples of grouping in vision [http://poseidon.csd.auth.gr/lab_research/latest/imgs/s peakdepvidindex_img2.jpg]
Image Segmentation. Selim Aksoy. Bilkent University
 Image Segmentation Selim Aksoy Department of Computer Engineering Bilkent University saksoy@cs.bilkent.edu.tr Examples of grouping in vision [http://poseidon.csd.auth.gr/lab_research/latest/imgs/s peakdepvidindex_img2.jpg]
BSB663 Image Processing Pinar Duygulu. Slides are adapted from Selim Aksoy
 BSB663 Image Processing Pinar Duygulu Slides are adapted from Selim Aksoy Image matching Image matching is a fundamental aspect of many problems in computer vision. Object or scene recognition Solving
Scale Invariant Feature Transform
 Why do we care about matching features? Scale Invariant Feature Transform Camera calibration Stereo Tracking/SFM Image moiaicing Object/activity Recognition Objection representation and recognition Automatic
Color and Shading. Color. Shapiro and Stockman, Chapter 6. Color and Machine Vision. Color and Perception
 Color and Shading Color Shapiro and Stockman, Chapter 6 Color is an important factor for for human perception for object and material identification, even time of day. Color perception depends upon both
Lecture 5: Frequency Domain Transformations
 #1 Lecture 5: Frequency Domain Transformations Saad J Bedros sbedros@umn.edu From Last Lecture Spatial Domain Transformation Point Processing for Enhancement Area/Mask Processing Transformations Image
PSD2B Digital Image Processing. Unit I -V
 PSD2B Digital Image Processing Unit I -V Syllabus- Unit 1 Introduction Steps in Image Processing Image Acquisition Representation Sampling & Quantization Relationship between pixels Color Models Basics
Local Feature Detectors
 Local Feature Detectors Selim Aksoy Department of Computer Engineering Bilkent University saksoy@cs.bilkent.edu.tr Slides adapted from Cordelia Schmid and David Lowe, CVPR 2003 Tutorial, Matthew Brown,
IT Digital Image ProcessingVII Semester - Question Bank
 UNIT I DIGITAL IMAGE FUNDAMENTALS PART A Elements of Digital Image processing (DIP) systems 1. What is a pixel? 2. Define Digital Image 3. What are the steps involved in DIP? 4. List the categories of
Lecture 12 Color model and color image processing
 Lecture 12 Color model and color image processing Color fundamentals Color models Pseudo color image Full color image processing Color fundamental The color that humans perceived in an object are determined
Outline 7/2/201011/6/
 Outline Pattern recognition in computer vision Background on the development of SIFT SIFT algorithm and some of its variations Computational considerations (SURF) Potential improvement Summary 01 2 Pattern
EECS150 - Digital Design Lecture 14 FIFO 2 and SIFT. Recap and Outline
 EECS150 - Digital Design Lecture 14 FIFO 2 and SIFT Oct. 15, 2013 Prof. Ronald Fearing Electrical Engineering and Computer Sciences University of California, Berkeley (slides courtesy of Prof. John Wawrzynek)
Features Points. Andrea Torsello DAIS Università Ca Foscari via Torino 155, Mestre (VE)
") Features Points Andrea Torsello DAIS Università Ca Foscari via Torino 155, 30172 Mestre (VE) Finding Corners Edge detectors perform poorly at corners. Corners provide repeatable points for matching, so
Features Points Andrea Torsello DAIS Università Ca Foscari via Torino 155, 30172 Mestre (VE) Finding Corners Edge detectors perform poorly at corners. Corners provide repeatable points for matching, so
Digital Image Processing
 Digital Image Processing Part 9: Representation and Description AASS Learning Systems Lab, Dep. Teknik Room T1209 (Fr, 11-12 o'clock) achim.lilienthal@oru.se Course Book Chapter 11 2011-05-17 Contents
Computer Vision 2. SS 18 Dr. Benjamin Guthier Professur für Bildverarbeitung. Computer Vision 2 Dr. Benjamin Guthier
 Computer Vision 2 SS 18 Dr. Benjamin Guthier Professur für Bildverarbeitung Computer Vision 2 Dr. Benjamin Guthier 1. IMAGE PROCESSING Computer Vision 2 Dr. Benjamin Guthier Content of this Chapter Non-linear
Introduction. Introduction. Related Research. SIFT method. SIFT method. Distinctive Image Features from Scale-Invariant. Scale.
 Distinctive Image Features from Scale-Invariant Keypoints David G. Lowe presented by, Sudheendra Invariance Intensity Scale Rotation Affine View point Introduction Introduction SIFT (Scale Invariant Feature
Local Features Tutorial: Nov. 8, 04
 Local Features Tutorial: Nov. 8, 04 Local Features Tutorial References: Matlab SIFT tutorial (from course webpage) Lowe, David G. Distinctive Image Features from Scale Invariant Features, International
Discovering Visual Hierarchy through Unsupervised Learning Haider Razvi
 Discovering Visual Hierarchy through Unsupervised Learning Haider Razvi hrazvi@stanford.edu 1 Introduction: We present a method for discovering visual hierarchy in a set of images. Automatically grouping
Advanced Video Content Analysis and Video Compression (5LSH0), Module 4
, Module 4") Advanced Video Content Analysis and Video Compression (5LSH0), Module 4 Visual feature extraction Part I: Color and texture analysis Sveta Zinger Video Coding and Architectures Research group, TU/e ( s.zinger@tue.nl
Advanced Video Content Analysis and Video Compression (5LSH0), Module 4 Visual feature extraction Part I: Color and texture analysis Sveta Zinger Video Coding and Architectures Research group, TU/e ( s.zinger@tue.nl
CS 4495 Computer Vision A. Bobick. CS 4495 Computer Vision. Features 2 SIFT descriptor. Aaron Bobick School of Interactive Computing
 CS 4495 Computer Vision Features 2 SIFT descriptor Aaron Bobick School of Interactive Computing Administrivia PS 3: Out due Oct 6 th. Features recap: Goal is to find corresponding locations in two images.
Image Segmentation and Registration
 Image Segmentation and Registration Dr. Christine Tanner (tanner@vision.ee.ethz.ch) Computer Vision Laboratory, ETH Zürich Dr. Verena Kaynig, Machine Learning Laboratory, ETH Zürich Outline Segmentation
An Introduc+on to Mathema+cal Image Processing IAS, Park City Mathema2cs Ins2tute, Utah Undergraduate Summer School 2010
 An Introduc+on to Mathema+cal Image Processing IAS, Park City Mathema2cs Ins2tute, Utah Undergraduate Summer School 2010 Luminita Vese Todd WiCman Department of Mathema2cs, UCLA lvese@math.ucla.edu wicman@math.ucla.edu
Region-based Segmentation
 Region-based Segmentation Image Segmentation Group similar components (such as, pixels in an image, image frames in a video) to obtain a compact representation. Applications: Finding tumors, veins, etc.
SIFT: SCALE INVARIANT FEATURE TRANSFORM SURF: SPEEDED UP ROBUST FEATURES BASHAR ALSADIK EOS DEPT. TOPMAP M13 3D GEOINFORMATION FROM IMAGES 2014
 SIFT: SCALE INVARIANT FEATURE TRANSFORM SURF: SPEEDED UP ROBUST FEATURES BASHAR ALSADIK EOS DEPT. TOPMAP M13 3D GEOINFORMATION FROM IMAGES 2014 SIFT SIFT: Scale Invariant Feature Transform; transform image
HISTOGRAMS OF ORIENTATIO N GRADIENTS
 HISTOGRAMS OF ORIENTATIO N GRADIENTS Histograms of Orientation Gradients Objective: object recognition Basic idea Local shape information often well described by the distribution of intensity gradients
Image Transformation Techniques Dr. Rajeev Srivastava Dept. of Computer Engineering, ITBHU, Varanasi
 Image Transformation Techniques Dr. Rajeev Srivastava Dept. of Computer Engineering, ITBHU, Varanasi 1. Introduction The choice of a particular transform in a given application depends on the amount of
Relationship between Fourier Space and Image Space. Academic Resource Center
 Relationship between Fourier Space and Image Space Academic Resource Center Presentation Outline What is an image? Noise Why do we transform images? What is the Fourier Transform? Examples of images in
SUMMARY: DISTINCTIVE IMAGE FEATURES FROM SCALE- INVARIANT KEYPOINTS
 SUMMARY: DISTINCTIVE IMAGE FEATURES FROM SCALE- INVARIANT KEYPOINTS Cognitive Robotics Original: David G. Lowe, 004 Summary: Coen van Leeuwen, s1460919 Abstract: This article presents a method to extract
Eppur si muove ( And yet it moves )
") Eppur si muove ( And yet it moves ) - Galileo Galilei University of Texas at Arlington Tracking of Image Features CSE 4392-5369 Vision-based Robot Sensing, Localization and Control Dr. Gian Luca Mariottini,
Eppur si muove ( And yet it moves ) - Galileo Galilei University of Texas at Arlington Tracking of Image Features CSE 4392-5369 Vision-based Robot Sensing, Localization and Control Dr. Gian Luca Mariottini,
Operation of machine vision system
 ROBOT VISION Introduction The process of extracting, characterizing and interpreting information from images. Potential application in many industrial operation. Selection from a bin or conveyer, parts
Computer vision: models, learning and inference. Chapter 13 Image preprocessing and feature extraction
 Computer vision: models, learning and inference Chapter 13 Image preprocessing and feature extraction Preprocessing The goal of pre-processing is to try to reduce unwanted variation in image due to lighting,
Image Enhancement in Spatial Domain. By Dr. Rajeev Srivastava
 Image Enhancement in Spatial Domain By Dr. Rajeev Srivastava CONTENTS Image Enhancement in Spatial Domain Spatial Domain Methods 1. Point Processing Functions A. Gray Level Transformation functions for
Patch-based Object Recognition. Basic Idea
 Patch-based Object Recognition 1! Basic Idea Determine interest points in image Determine local image properties around interest points Use local image properties for object classification Example: Interest
Image Processing. Image Features
 Image Processing Image Features Preliminaries 2 What are Image Features? Anything. What they are used for? Some statements about image fragments (patches) recognition Search for similar patches matching
EXAM SOLUTIONS. Image Processing and Computer Vision Course 2D1421 Monday, 13 th of March 2006,
 School of Computer Science and Communication, KTH Danica Kragic EXAM SOLUTIONS Image Processing and Computer Vision Course 2D1421 Monday, 13 th of March 2006, 14.00 19.00 Grade table 0-25 U 26-35 3 36-45
Image Features: Local Descriptors. Sanja Fidler CSC420: Intro to Image Understanding 1/ 58
 Image Features: Local Descriptors Sanja Fidler CSC420: Intro to Image Understanding 1/ 58 [Source: K. Grauman] Sanja Fidler CSC420: Intro to Image Understanding 2/ 58 Local Features Detection: Identify
Reconstruction of Images Distorted by Water Waves
 Reconstruction of Images Distorted by Water Waves Arturo Donate and Eraldo Ribeiro Computer Vision Group Outline of the talk Introduction Analysis Background Method Experiments Conclusions Future Work
Content-Based Image Retrieval Readings: Chapter 8:
 Content-Based Image Retrieval Readings: Chapter 8: 8.1-8.4 Queries Commercial Systems Retrieval Features Indexing in the FIDS System Lead-in to Object Recognition 1 Content-based Image Retrieval (CBIR)
CS4733 Class Notes, Computer Vision
 CS4733 Class Notes, Computer Vision Sources for online computer vision tutorials and demos - http://www.dai.ed.ac.uk/hipr and Computer Vision resources online - http://www.dai.ed.ac.uk/cvonline Vision
Lecture 1 Image Formation.
 Lecture 1 Image Formation peimt@bit.edu.cn 1 Part 3 Color 2 Color v The light coming out of sources or reflected from surfaces has more or less energy at different wavelengths v The visual system responds
Multimedia Databases. 2. Summary. 2 Color-based Retrieval. 2.1 Multimedia Data Retrieval. 2.1 Multimedia Data Retrieval 4/14/2016.
 2. Summary Multimedia Databases Wolf-Tilo Balke Younes Ghammad Institut für Informationssysteme Technische Universität Braunschweig http://www.ifis.cs.tu-bs.de Last week: What are multimedia databases?
Histogram and watershed based segmentation of color images
 Histogram and watershed based segmentation of color images O. Lezoray H. Cardot LUSAC EA 2607 IUT Saint-Lô, 120 rue de l'exode, 50000 Saint-Lô, FRANCE Abstract A novel method for color image segmentation
Lecture 8 Object Descriptors
 Lecture 8 Object Descriptors Azadeh Fakhrzadeh Centre for Image Analysis Swedish University of Agricultural Sciences Uppsala University 2 Reading instructions Chapter 11.1 11.4 in G-W Azadeh Fakhrzadeh
Edge and corner detection
 Edge and corner detection Prof. Stricker Doz. G. Bleser Computer Vision: Object and People Tracking Goals Where is the information in an image? How is an object characterized? How can I find measurements
Content-based Image Retrieval (CBIR)
") Content-based Image Retrieval (CBIR) Content-based Image Retrieval (CBIR) Searching a large database for images that match a query: What kinds of databases? What kinds of queries? What constitutes a match?
Content-based Image Retrieval (CBIR) Content-based Image Retrieval (CBIR) Searching a large database for images that match a query: What kinds of databases? What kinds of queries? What constitutes a match?
Object Recognition with Invariant Features
 Object Recognition with Invariant Features Definition: Identify objects or scenes and determine their pose and model parameters Applications Industrial automation and inspection Mobile robots, toys, user
xv Programming for image analysis fundamental steps
 Programming for image analysis xv http://www.trilon.com/xv/ xv is an interactive image manipulation program for the X Window System grab Programs for: image ANALYSIS image processing tools for writing
Babu Madhav Institute of Information Technology Years Integrated M.Sc.(IT)(Semester - 7)
(Semester - 7)") 5 Years Integrated M.Sc.(IT)(Semester - 7) 060010707 Digital Image Processing UNIT 1 Introduction to Image Processing Q: 1 Answer in short. 1. What is digital image? 1. Define pixel or picture element?
5 Years Integrated M.Sc.(IT)(Semester - 7) 060010707 Digital Image Processing UNIT 1 Introduction to Image Processing Q: 1 Answer in short. 1. What is digital image? 1. Define pixel or picture element?
Unit - I Computer vision Fundamentals
 Unit - I Computer vision Fundamentals It is an area which concentrates on mimicking human vision systems. As a scientific discipline, computer vision is concerned with the theory behind artificial systems
Computer Vision and Graphics (ee2031) Digital Image Processing I
 Digital Image Processing I") Computer Vision and Graphics (ee203) Digital Image Processing I Dr John Collomosse J.Collomosse@surrey.ac.uk Centre for Vision, Speech and Signal Processing University of Surrey Learning Outcomes After
Computer Vision and Graphics (ee203) Digital Image Processing I Dr John Collomosse J.Collomosse@surrey.ac.uk Centre for Vision, Speech and Signal Processing University of Surrey Learning Outcomes After
From Structure-from-Motion Point Clouds to Fast Location Recognition
 From Structure-from-Motion Point Clouds to Fast Location Recognition Arnold Irschara1;2, Christopher Zach2, Jan-Michael Frahm2, Horst Bischof1 1Graz University of Technology firschara, bischofg@icg.tugraz.at
Feature Descriptors. CS 510 Lecture #21 April 29 th, 2013
 Feature Descriptors CS 510 Lecture #21 April 29 th, 2013 Programming Assignment #4 Due two weeks from today Any questions? How is it going? Where are we? We have two umbrella schemes for object recognition
Robotics Programming Laboratory
 Chair of Software Engineering Robotics Programming Laboratory Bertrand Meyer Jiwon Shin Lecture 8: Robot Perception Perception http://pascallin.ecs.soton.ac.uk/challenges/voc/databases.html#caltech car
Medical Image Processing using MATLAB
 Medical Image Processing using MATLAB Emilia Dana SELEŢCHI University of Bucharest, Romania ABSTRACT 2. 3. 2. IMAGE PROCESSING TOOLBOX MATLAB and the Image Processing Toolbox provide a wide range of advanced
Introduction to color science
 Introduction to color science Trichromacy Spectral matching functions CIE XYZ color system xy-chromaticity diagram Color gamut Color temperature Color balancing algorithms Digital Image Processing: Bernd
Cell Clustering Using Shape and Cell Context. Descriptor
 Cell Clustering Using Shape and Cell Context Descriptor Allison Mok: 55596627 F. Park E. Esser UC Irvine August 11, 2011 Abstract Given a set of boundary points from a 2-D image, the shape context captures
Computational Optical Imaging - Optique Numerique. -- Multiple View Geometry and Stereo --
 Computational Optical Imaging - Optique Numerique -- Multiple View Geometry and Stereo -- Winter 2013 Ivo Ihrke with slides by Thorsten Thormaehlen Feature Detection and Matching Wide-Baseline-Matching
Local Patch Descriptors
 Local Patch Descriptors Slides courtesy of Steve Seitz and Larry Zitnick CSE 803 1 How do we describe an image patch? How do we describe an image patch? Patches with similar content should have similar
CHAPTER 3 DIFFERENT DOMAINS OF WATERMARKING. domain. In spatial domain the watermark bits directly added to the pixels of the cover
 38 CHAPTER 3 DIFFERENT DOMAINS OF WATERMARKING Digital image watermarking can be done in both spatial domain and transform domain. In spatial domain the watermark bits directly added to the pixels of the
Image features. Image Features
 Image features Image features, such as edges and interest points, provide rich information on the image content. They correspond to local regions in the image and are fundamental in many applications in
MRI Brain Image Segmentation Using an AM-FM Model
 MRI Brain Image Segmentation Using an AM-FM Model Marios S. Pattichis', Helen Petropoulos2, and William M. Brooks2 1 Department of Electrical and Computer Engineering, The University of New Mexico, Albuquerque,
CHAPTER 1 Introduction 1. CHAPTER 2 Images, Sampling and Frequency Domain Processing 37
 Extended Contents List Preface... xi About the authors... xvii CHAPTER 1 Introduction 1 1.1 Overview... 1 1.2 Human and Computer Vision... 2 1.3 The Human Vision System... 4 1.3.1 The Eye... 5 1.3.2 The
CAP 5415 Computer Vision Fall 2012
 CAP 5415 Computer Vision Fall 01 Dr. Mubarak Shah Univ. of Central Florida Office 47-F HEC Lecture-5 SIFT: David Lowe, UBC SIFT - Key Point Extraction Stands for scale invariant feature transform Patented
Texture. Texture is a description of the spatial arrangement of color or intensities in an image or a selected region of an image.
 Texture Texture is a description of the spatial arrangement of color or intensities in an image or a selected region of an image. Structural approach: a set of texels in some regular or repeated pattern
Low-level Vision Processing Algorithms Speaker: Ito, Dang Supporter: Ishii, Toyama and Y. Murakami
 Low-level Vision Processing Algorithms Speaker: Ito, Dang Supporter: Ishii, Toyama and Y. Murakami Adaptive Systems Lab The University of Aizu Overview Introduction What is Vision Processing? Basic Knowledge
CHAPTER 6. 6 Huffman Coding Based Image Compression Using Complex Wavelet Transform. 6.3 Wavelet Transform based compression technique 106
 CHAPTER 6 6 Huffman Coding Based Image Compression Using Complex Wavelet Transform Page No 6.1 Introduction 103 6.2 Compression Techniques 104 103 6.2.1 Lossless compression 105 6.2.2 Lossy compression
Perception. Autonomous Mobile Robots. Sensors Vision Uncertainties, Line extraction from laser scans. Autonomous Systems Lab. Zürich.
 Autonomous Mobile Robots Localization "Position" Global Map Cognition Environment Model Local Map Path Perception Real World Environment Motion Control Perception Sensors Vision Uncertainties, Line extraction
Lecture 6: Multimedia Information Retrieval Dr. Jian Zhang
 Lecture 6: Multimedia Information Retrieval Dr. Jian Zhang NICTA & CSE UNSW COMP9314 Advanced Database S1 2007 jzhang@cse.unsw.edu.au Reference Papers and Resources Papers: Colour spaces-perceptual, historical
Ulrik Söderström 16 Feb Image Processing. Segmentation
 Ulrik Söderström ulrik.soderstrom@tfe.umu.se 16 Feb 2011 Image Processing Segmentation What is Image Segmentation? To be able to extract information from an image it is common to subdivide it into background
Content-Based Image Retrieval Readings: Chapter 8:
 Content-Based Image Retrieval Readings: Chapter 8: 8.1-8.4 Queries Commercial Systems Retrieval Features Indexing in the FIDS System Lead-in to Object Recognition 1 Content-based Image Retrieval (CBIR)
Introduction to Medical Imaging (5XSA0)
") 1 Introduction to Medical Imaging (5XSA0) Visual feature extraction Color and texture analysis Sveta Zinger ( s.zinger@tue.nl ) Introduction (1) Features What are features? Feature a piece of information
1 Introduction to Medical Imaging (5XSA0) Visual feature extraction Color and texture analysis Sveta Zinger ( s.zinger@tue.nl ) Introduction (1) Features What are features? Feature a piece of information
1.Some Basic Gray Level Transformations
 1.Some Basic Gray Level Transformations We begin the study of image enhancement techniques by discussing gray-level transformation functions.these are among the simplest of all image enhancement techniques.the
Analysis of Planar Anisotropy of Fibre Systems by Using 2D Fourier Transform
 Maroš Tunák, Aleš Linka Technical University in Liberec Faculty of Textile Engineering Department of Textile Materials Studentská 2, 461 17 Liberec 1, Czech Republic E-mail: maros.tunak@tul.cz ales.linka@tul.cz
SURF. Lecture6: SURF and HOG. Integral Image. Feature Evaluation with Integral Image
 SURF CSED441:Introduction to Computer Vision (2015S) Lecture6: SURF and HOG Bohyung Han CSE, POSTECH bhhan@postech.ac.kr Speed Up Robust Features (SURF) Simplified version of SIFT Faster computation but
Image Compression using Discrete Wavelet Transform Preston Dye ME 535 6/2/18
 Image Compression using Discrete Wavelet Transform Preston Dye ME 535 6/2/18 Introduction Social media is an essential part of an American lifestyle. Latest polls show that roughly 80 percent of the US
Local invariant features
 Local invariant features Tuesday, Oct 28 Kristen Grauman UT-Austin Today Some more Pset 2 results Pset 2 returned, pick up solutions Pset 3 is posted, due 11/11 Local invariant features Detection of interest
Designing Applications that See Lecture 7: Object Recognition
 stanford hci group / cs377s Designing Applications that See Lecture 7: Object Recognition Dan Maynes-Aminzade 29 January 2008 Designing Applications that See http://cs377s.stanford.edu Reminders Pick up
Harder case. Image matching. Even harder case. Harder still? by Diva Sian. by swashford
 Image matching Harder case by Diva Sian by Diva Sian by scgbt by swashford Even harder case Harder still? How the Afghan Girl was Identified by Her Iris Patterns Read the story NASA Mars Rover images Answer
Digital Image Processing COSC 6380/4393
 Digital Image Processing COSC 6380/4393 Lecture 21 Nov 16 th, 2017 Pranav Mantini Ack: Shah. M Image Processing Geometric Transformation Point Operations Filtering (spatial, Frequency) Input Restoration/
Image Analysis - Lecture 5
 Texture Segmentation Clustering Review Image Analysis - Lecture 5 Texture and Segmentation Magnus Oskarsson Lecture 5 Texture Segmentation Clustering Review Contents Texture Textons Filter Banks Gabor
School of Computing University of Utah
 School of Computing University of Utah Presentation Outline 1 2 3 4 Main paper to be discussed David G. Lowe, Distinctive Image Features from Scale-Invariant Keypoints, IJCV, 2004. How to find useful keypoints?
Content Based Image Retrieval (CBIR) Using Segmentation Process
 Using Segmentation Process") Content Based Image Retrieval (CBIR) Using Segmentation Process R.Gnanaraja 1, B. Jagadishkumar 2, S.T. Premkumar 3, B. Sunil kumar 4 1, 2, 3, 4 PG Scholar, Department of Computer Science and Engineering,
Content Based Image Retrieval (CBIR) Using Segmentation Process R.Gnanaraja 1, B. Jagadishkumar 2, S.T. Premkumar 3, B. Sunil kumar 4 1, 2, 3, 4 PG Scholar, Department of Computer Science and Engineering,
Comparison of Feature Detection and Matching Approaches: SIFT and SURF
 GRD Journals- Global Research and Development Journal for Engineering Volume 2 Issue 4 March 2017 ISSN: 2455-5703 Comparison of Detection and Matching Approaches: SIFT and SURF Darshana Mistry PhD student
Ulrik Söderström 17 Jan Image Processing. Introduction
 Ulrik Söderström ulrik.soderstrom@tfe.umu.se 17 Jan 2017 Image Processing Introduction Image Processsing Typical goals: Improve images for human interpretation Image processing Processing of images for
Physical Color. Color Theory - Center for Graphics and Geometric Computing, Technion 2
 Color Theory Physical Color Visible energy - small portion of the electro-magnetic spectrum Pure monochromatic colors are found at wavelengths between 380nm (violet) and 780nm (red) 380 780 Color Theory
Wikipedia - Mysid
 Wikipedia - Mysid Erik Brynjolfsson, MIT Filtering Edges Corners Feature points Also called interest points, key points, etc. Often described as local features. Szeliski 4.1 Slides from Rick Szeliski,
Color. making some recognition problems easy. is 400nm (blue) to 700 nm (red) more; ex. X-rays, infrared, radio waves. n Used heavily in human vision
 to 700 nm (red) more; ex. X-rays, infrared, radio waves. n Used heavily in human vision") Color n Used heavily in human vision n Color is a pixel property, making some recognition problems easy n Visible spectrum for humans is 400nm (blue) to 700 nm (red) n Machines can see much more; ex. X-rays,
Color n Used heavily in human vision n Color is a pixel property, making some recognition problems easy n Visible spectrum for humans is 400nm (blue) to 700 nm (red) n Machines can see much more; ex. X-rays,
Content-Based Image Retrieval. Queries Commercial Systems Retrieval Features Indexing in the FIDS System Lead-in to Object Recognition
 Content-Based Image Retrieval Queries Commercial Systems Retrieval Features Indexing in the FIDS System Lead-in to Object Recognition 1 Content-based Image Retrieval (CBIR) Searching a large database for
Fundamentals of Digital Image Processing
 \L\.6 Gw.i Fundamentals of Digital Image Processing A Practical Approach with Examples in Matlab Chris Solomon School of Physical Sciences, University of Kent, Canterbury, UK Toby Breckon School of Engineering,
Computer Graphics. Sampling Theory & Anti-Aliasing. Philipp Slusallek
 Computer Graphics Sampling Theory & Anti-Aliasing Philipp Slusallek Dirac Comb (1) Constant & δ-function flash Comb/Shah function 2 Dirac Comb (2) Constant & δ-function Duality f(x) = K F(ω) = K (ω) And
Automatic Image Alignment (feature-based)
") Automatic Image Alignment (feature-based) Mike Nese with a lot of slides stolen from Steve Seitz and Rick Szeliski 15-463: Computational Photography Alexei Efros, CMU, Fall 2006 Today s lecture Feature
Automatic Image Alignment (feature-based) Mike Nese with a lot of slides stolen from Steve Seitz and Rick Szeliski 15-463: Computational Photography Alexei Efros, CMU, Fall 2006 Today s lecture Feature