Introduction to Scientific Visualization
|
|
|
- Job Heath
- 6 years ago
- Views:
Transcription

1 Introduction to Scientific Visualization Erik Brisson
2 Topics Introduction Visualization techniques Scientific data domains Software packages and workflow Conclusion
 Combination of 3-D graphics technology and")
3 What is sci-vis? Could mean many things (e.g., plotting, illustration) Combination of 3-D graphics technology and human perception of objects in space


4 The Visualization Pipeline Math Proc Scientific visualization Computer Graphics
5 The Visualization Pipeline - Hardware Field instruments Scientists/programmers Supercomputers Graphics machines Publications, movies/dvds, web Demos, educational software

6 The Visualization Pipeline - Software Data acquisition and preparation Sci-vis tools Geometric Representation Rendering Post-processing

7 Scalar data in 3D: As points
8 Scalar data: Cutplanes

9 Scalar data: Regions of Interest
10 Scalar data: Isosurface w/roi
11 Transparent isosurface w/cutplanes
12 Colored isosurface w/cutplanes
13 Colored transp isosurface w/cutplanes
14 Multi isosurfaces w/cutplanes

15 Technique: Mapping onto isosurface

16 Technique: Volume Visualization

17 Vector data in 3D: Vector glyphs
18 Technique: Vector field streaklines

19 Technique: Vector field ribbons
20 Scientific data domains
21 Regular grid topology
22 Irregular grid topology
23 Software Tools and the Pipeline Data Matlab VTK OSG Maya IDL Paraview Performer OpenGL Gnuplot DAFFIE Display Wall Xmgrace Web Excel Photoshop Premier
24 Visualization Packages Matlab for visualization IDL VTK Paraview OpenGL OpenSceneGraph Maya DAFFIE and the display wall
25 MATLAB and IDL General purpose numeric packages Data analysis, simulation, mathematics Include plotting and graphics Command line / scripting Commercial software (no source available) Widely used and well supported Available on SCF machines
26 VTK and ParaView Scientific visualization packages Open source Widely used Available on SCF machines VTK is a library, many language bindings Paraview GUI based, built on VTK
27 OpenGL Widely supported at hardware level Access to all graphics card features Program from scratch Only option for some large applications
28 OpenGL primitives
29 OpenSceneGraph Program using scene graph paradigm Lots of utility functions Open source OpenGL based Similar to SGI Performer Many utility functions Notably, 3-D file readers
30 OpenSceneGraph
31 Maya screenshot
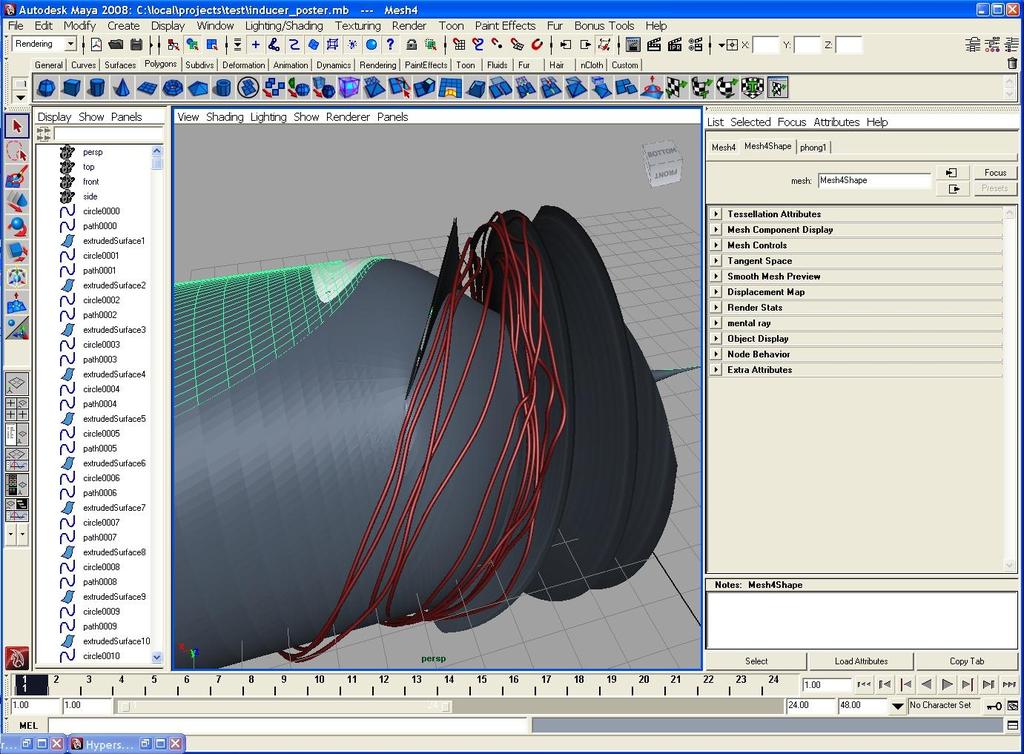
32 Maya screenshot

33 The BU DVD Wall 24 projectors 24 Linux machines Passive stereo One head node Localized sound Wireless navigation
34 Your Project Describe your work in visual / geometric way? What is goal, e.g., web, publication, presentation? What is the time line? How much learning time can you invest? How much do you expect to use?
35 Many possible workflows Data Matlab VTK OpenGL Maya IDL Paraview OSG Photoshop Gnuplot DAFFIE Performer Premier Xmgrace Excel
 Electron density as volume data isosurfaces (IDL).")
36 Example workflow molecular dynamics Simulation creates data files Molecule x,y,z + type colored spheres (C program) Electron density as volume data isosurfaces (IDL).obj files Rendered in Maya

37 Example workflow pressure on turbine Simulation run on supercomputer Produced many Plot3d files C code transforms data to.obj files Rendered in Maya Processed using Imagemagick for DVD Wall movies

38 Example workflow showing entropy Isosurfaces in IDL Convert output into.obj Render in Maya, with transparency View in 3D on Wall

39 Example workflow stretched water Given positions of atoms in water How to show holes? Construct volume data of distance Use volume visualization

40 Example workflow CISM Researchers used OpenDX SCV staff modified OpenDX networks Produced wall movies and demos

41 Example workflow Corporate Connections Researchers provided data SCV staff wrote custom viewing code

42 Artworld family portrait
43 Visualization Tutorials Introduction to Scientific Visualization Scientific Visualization Using ParaView Scientific Visualization Using VTK Scientific Visualization Using MATLAB Graphics Programming in C/C++: OpenGL and OpenSceneGraph Introduction to Maya [CAS 327] Graphics and Images for Publication and Presentation
44 Conclusion Contact me: Erik Brisson Tutorial presentations and examples online: Online evaluation:
Scientific Visualization. Katia Oleinik:
 Scientific Visualization Katia Oleinik: koleinik@bu.edu Scientific Visualization (or SciVis) is a branch of computer science which is concerned with graphical representation of real-world objects and scientific
Visualization Plugin for ParaView
 Alexey I. Baranov Visualization Plugin for ParaView version 2.0 Springer Contents 1 Visualization with ParaView..................................... 5 1.1 ParaView plugin installation.................................
Scalable and Distributed Visualization using ParaView
 Scalable and Distributed Visualization using ParaView Eric A. Wernert, Ph.D. Senior Manager & Scientist, Advanced Visualization Lab Pervasive Technology Institute, Indiana University Big Data for Science
Raycast Rendering Maya 2013
 2000 2012 Michael O'Rourke Raycast Rendering Maya 2013 (See also the Intro to Lights and Rendering tutorial for an introduction to the basics of rendering an image) Concept There are several algorithms
Introduction to Python and VTK
 Introduction to Python and VTK Scientific Visualization, HT 2013 Lecture 2 Johan Nysjö Centre for Image analysis Swedish University of Agricultural Sciences Uppsala University 2 About me PhD student in
amira 5 Visualize Analyze Present
 amira 5 Visualize Analyze Present Visioneering Your Ideas Engineering Your Vision Your research is inspired by knowledge, intuition, and a powerful vision. Yet you are facing many challenges when moving
Introduction to Visualization on Stampede
 Introduction to Visualization on Stampede Aaron Birkland Cornell CAC With contributions from TACC visualization training materials Parallel Computing on Stampede June 11, 2013 From data to Insight Data
Introduction to Python and VTK
 Introduction to Python and VTK Scientific Visualization, HT 2014 Lecture 2 Johan Nysjö Centre for Image analysis Swedish University of Agricultural Sciences Uppsala University About me PhD student in Computerized
Visualization Systems. Ronald Peikert SciVis Visualization Systems 11-1
 Visualization Systems Ronald Peikert SciVis 2008 - Visualization Systems 11-1 Modular visualization environments Many popular visualization software are designed as socalled modular visualization environments
Computer Graphics CS 543 Lecture 1 (Part I) Prof Emmanuel Agu. Computer Science Dept. Worcester Polytechnic Institute (WPI)
 Prof Emmanuel Agu. Computer Science Dept. Worcester Polytechnic Institute (WPI)") Computer Graphics CS 543 Lecture 1 (Part I) Prof Emmanuel Agu Computer Science Dept. Worcester Polytechnic Institute (WPI) About This Course Computer graphics: algorithms, mathematics, data structures..
Computer Graphics CS 543 Lecture 1 (Part I) Prof Emmanuel Agu Computer Science Dept. Worcester Polytechnic Institute (WPI) About This Course Computer graphics: algorithms, mathematics, data structures..
Lecture Topic Projects
 Lecture Topic Projects 1 Intro, schedule, and logistics 2 Applications of visual analytics, data types 3 Data sources and preparation Project 1 out 4 Data reduction, similarity & distance, data augmentation
Introduction to scientific visualization with ParaView
 Introduction to scientific visualization with ParaView Tijs de Kler SURFsara Visualization group Tijs.dekler@surfsara.nl (some slides courtesy of Robert Belleman, UvA) Outline Pipeline and data model (10
Creation of 360 videos from volumetric datasets
 Creation of 360 videos from volumetric datasets Use cases: Excitons in lithium fluoride Adsorption of carbon dioxide on calcium oxide Rubén Jesús García-Hernández (LRZ) SuperMUC Status and Results Workshop
Insight VisREU Site. Agenda. Introduction to Scientific Visualization Using 6/16/2015. The purpose of visualization is insight, not pictures.
 2015 VisREU Site Introduction to Scientific Visualization Using Vetria L. Byrd, Director Advanced Visualization VisREU Site Coordinator REU Site Sponsored by NSF ACI Award 1359223 Introduction to SciVis(High
Large Scale Visualization on the Cray XT3 Using ParaView
 Large Scale Visualization on the Cray XT3 Using ParaView Cray User s Group 2008 May 8, 2008 Kenneth Moreland David Rogers John Greenfield Sandia National Laboratories Alexander Neundorf Technical University
CSE528 Computer Graphics: Theory, Algorithms, and Applications
 CSE528 Computer Graphics: Theory, Algorithms, and Applications Hong Qin State University of New York at Stony Brook (Stony Brook University) Stony Brook, New York 11794--4400 Tel: (631)632-8450; Fax: (631)632-8334
Introduction to scientific visualization with ParaView
 Introduction to scientific visualization with ParaView Paul Melis SURFsara Visualization group paul.melis@surfsara.nl (some slides courtesy of Robert Belleman, UvA) Outline Introduction, pipeline and data
SCIENTIFIC VISUALIZATION ON GPU CLUSTERS PETER MESSMER, NVIDIA
 SCIENTIFIC VISUALIZATION ON GPU CLUSTERS PETER MESSMER, NVIDIA Visualization Rendering Visualization Isosurfaces, Isovolumes Field Operators (Gradient, Curl,.. ) Coordinate transformations Feature extraction
Visualization. Images are used to aid in understanding of data. Height Fields and Contours Scalar Fields Volume Rendering Vector Fields [chapter 26]
![Visualization. Images are used to aid in understanding of data. Height Fields and Contours Scalar Fields Volume Rendering Vector Fields [chapter 26]](/thumbs/74/70771954.jpg "Visualization. Images are used to aid in understanding of data. Height Fields and Contours Scalar Fields Volume Rendering Vector Fields [chapter 26]") Visualization Images are used to aid in understanding of data Height Fields and Contours Scalar Fields Volume Rendering Vector Fields [chapter 26] Tumor SCI, Utah Scientific Visualization Visualize large
Visualization Images are used to aid in understanding of data Height Fields and Contours Scalar Fields Volume Rendering Vector Fields [chapter 26] Tumor SCI, Utah Scientific Visualization Visualize large
Visualization on TeraGrid at TACC
 Visualization on TeraGrid at TACC Drew Dolgert Cornell Center for Advanced Computing TeraGrid-Scale Visualization at Texas Advanced Computing Center Ranger: Sun cluster, 3936 nodes, 62976 cores Spur: Sun
VRX: Virtual Reality explorer Toolkit v A brief system specification -
 VRX: Virtual Reality explorer Toolkit v. 2.0 - A brief system specification - Michal Koutek, Email: M.Koutek@ewi.tudelft.nl VR and Visualization Group, Faculty of Electrical Engineering, Mathematics and
11/1/13. Visualization. Scientific Visualization. Types of Data. Height Field. Contour Curves. Meshes
 CSCI 420 Computer Graphics Lecture 26 Visualization Height Fields and Contours Scalar Fields Volume Rendering Vector Fields [Angel Ch. 2.11] Jernej Barbic University of Southern California Scientific Visualization
Visualization. CSCI 420 Computer Graphics Lecture 26
 CSCI 420 Computer Graphics Lecture 26 Visualization Height Fields and Contours Scalar Fields Volume Rendering Vector Fields [Angel Ch. 11] Jernej Barbic University of Southern California 1 Scientific Visualization
Lecture overview. Visualisatie BMT. Fundamental algorithms. Visualization pipeline. Structural classification - 1. Structural classification - 2
 Visualisatie BMT Fundamental algorithms Arjan Kok a.j.f.kok@tue.nl Lecture overview Classification of algorithms Scalar algorithms Vector algorithms Tensor algorithms Modeling algorithms 1 2 Visualization
A Broad Overview of Scientific Visualization with a Focus on Geophysical Turbulence Simulation Data (SciVis
 A Broad Overview of Scientific Visualization with a Focus on Geophysical Turbulence Simulation Data (SciVis 101 for Turbulence Researchers) John Clyne clyne@ucar.edu Examples: Medicine Examples: Biology
Visualization with ParaView
 Visualization with Before we begin Make sure you have 3.10.1 installed so you can follow along in the lab section http://paraview.org/paraview/resources/software.html http://www.paraview.org/ Background
Introduction to Computer Graphics. Knowledge basic concepts 2D and 3D computer graphics
 Introduction to Computer Graphics Knowledge basic concepts 2D and 3D computer graphics 1 Introduction 2 Basic math 3 2D transformations 4 3D transformations 5 Viewing 6 Primitives 7 Geometry 8 Shading
Lecture Topic Projects 1 Intro, schedule, and logistics 2 Applications of visual analytics, basic tasks, data types 3 Introduction to D3, basic vis
 Lecture Topic Projects 1 Intro, schedule, and logistics 2 Applications of visual analytics, basic tasks, data types 3 Introduction to D3, basic vis techniques for non-spatial data Project #1 out 4 Data
Scientific Visualization An Introduction
 Scientific Visualization An Introduction Featuring Vetria L. Byrd, PhD Assistant Professor Research and Technology Development Conference Missouri S&T September 13, 2016 RTD 2016 Thank You! Missouri S&T
EXPLORER, A VISUALIZATION SYSTEM FOR RESERVOIR SIMULATIONS
 INTERNATIONAL JOURNAL OF NUMERICAL ANALYSIS AND MODELING Volume 2, Supp, Pages 169 176 c 2005 Institute for Scientific Computing and Information EXPLORER, A VISUALIZATION SYSTEM FOR RESERVOIR SIMULATIONS
Advanced Graphics: NOMAD Summer. Interactive analysis and visualization of complex datasets
 NOMAD Summer A hands-on course on tools for novel-materials discovery September 25-29, 2017, Berlin Advanced Graphics: Interactive analysis and visualization of complex datasets Michele Compostella Markus
Data analysis with ParaView CSMP Workshop 2009 Gillian Gruen
 Data analysis with ParaView 3.4.0 CSMP Workshop 2009 Gillian Gruen How to...... display a data set ( Contour, Glyph, Clip, Slice) be efficient in displaying similar data sets ( work with Lookmarks )...
Visualization Support at RZG
 Visualization Support at RZG Markus Rampp (RZG) mjr@rzg.mpg.de MPA Computer Seminar, Jan 14, 2009 Outline Topics Overview Existing services Some example projects Software overview & demo Remote visualization
Visualization and VR for the Grid
 Visualization and VR for the Grid Chris Johnson Scientific Computing and Imaging Institute University of Utah Computational Science Pipeline Construct a model of the physical domain (Mesh Generation, CAD)
Paraview: A (novice) user perspective
 user perspective") PARAVIEW Copenhagen 2008-1 Paraview: A (novice) user perspective Rony Keppens Centre for Plasma-Astrophysics, K.U.Leuven (Belgium) & FOM-Institute for Plasma Physics Rijnhuizen & Astronomical Institute,
PARAVIEW Copenhagen 2008-1 Paraview: A (novice) user perspective Rony Keppens Centre for Plasma-Astrophysics, K.U.Leuven (Belgium) & FOM-Institute for Plasma Physics Rijnhuizen & Astronomical Institute,
Introduction to Visualization: ParaView. Dan Mazur, McGill HPC Aug 20, 2013
 Introduction to Visualization: ParaView Dan Mazur, McGill HPC daniel.mazur@mcgill.ca Aug 20, 2013 1 Outline What is scientific visualization? ParaView and visualization pipelines data import 1D, 2D, 3D
Phonons and Spectroscopy Tutorial
 Phonons and Spectroscopy Tutorial The aims of this tutorial session is to introduce you to running larger-scale CASTEP jobs on supercomputer clusters, creation of input files for and setup of CASTEP jobs,
MATLAB 7. The Language of Technical Computing KEY FEATURES
 MATLAB 7 The Language of Technical Computing MATLAB is a high-level technical computing language and interactive environment for algorithm development, data visualization, data analysis, and numerical
CS GPU and GPGPU Programming Lecture 2: Introduction; GPU Architecture 1. Markus Hadwiger, KAUST
 CS 380 - GPU and GPGPU Programming Lecture 2: Introduction; GPU Architecture 1 Markus Hadwiger, KAUST Reading Assignment #2 (until Feb. 17) Read (required): GLSL book, chapter 4 (The OpenGL Programmable
mjb March 9, 2015 Chuck Evans
 Vector Visualization What is a Vector Visualization Problem? A vector has direction and magnitude. Typically science and engineering problems that work this way are those involving fluid flow through a
Introduction to Scientific Visualization
 CS53000 - Spring 2018 Introduction to Scientific Visualization Introduction to January 11, 2018 The Visualization Toolkit Open source library for Visualization Computer Graphics Imaging Written in C++
ACGV 2008, Lecture 1 Tuesday January 22, 2008
 Advanced Computer Graphics and Visualization Spring 2008 Ch 1: Introduction Ch 4: The Visualization Pipeline Ch 5: Basic Data Representation Organization, Spring 2008 Stefan Seipel Filip Malmberg Mats
Introduction to Scientific Visualization
 Introduction to Scientific Visualization Aaron Birkland Cornell Center for Advanced Computing Data Analysis on Ranger January 2012 A lab-intensive workshop Start off with basic concepts Data, transformations,
Tips and Tricks using Discovery Studio
 Tips and Tricks using Discovery Studio Allister J. Maynard, Ph.D. Senior Manager, R&D July 31 st, 2008 New Science and Customized Workflows for Drug Discovery Research Webinar Series June 12, 2008 - Advances
RZG Visualisation Infrastructure
 Visualisation of Large Data Sets on Supercomputers RZG Visualisation Infrastructure Markus Rampp Computing Centre (RZG) of the Max-Planck-Society and IPP markus.rampp@rzg.mpg.de LRZ/RZG Course on Visualisation
VisIt Overview. VACET: Chief SW Engineer ASC: V&V Shape Char. Lead. Hank Childs. Supercomputing 2006 Tampa, Florida November 13, 2006
 VisIt Overview Hank Childs VACET: Chief SW Engineer ASC: V&V Shape Char. Lead Supercomputing 2006 Tampa, Florida November 13, 2006 27B element Rayleigh-Taylor Instability (MIRANDA, BG/L) This is UCRL-PRES-226373
Welcome! Roberto Mucci SuperComputing Applications and Innovation Department
 Welcome! Roberto Mucci r.mucci@cineca.it SuperComputing Applications and Innovation Department OUTLINE School presentation Introduction to Scientific Visualization Remote visualization @ Cineca ABOUT CINECA
Computer Graphics (CS 543) Lecture 1 (Part 1): Introduction to Computer Graphics
 Lecture 1 (Part 1): Introduction to Computer Graphics") Computer Graphics (CS 543) Lecture 1 (Part 1): Introduction to Computer Graphics Prof Emmanuel Agu Computer Science Dept. Worcester Polytechnic Institute (WPI) What is Computer Graphics (CG)? Computer
Computer Graphics (CS 543) Lecture 1 (Part 1): Introduction to Computer Graphics Prof Emmanuel Agu Computer Science Dept. Worcester Polytechnic Institute (WPI) What is Computer Graphics (CG)? Computer
Cinematic Scientific Visualization in Houdini
 Cinematic Scientific Visualization in Houdini Kalina Borkiewicz + AJ Christensen Advanced Visualization Lab National Center for Supercomputing Applications University of Illinois at Urbana-Champaign Vocabulary
Visualization Computer Graphics I Lecture 20
 15-462 Computer Graphics I Lecture 20 Visualization Height Fields and Contours Scalar Fields Volume Rendering Vector Fields [Angel Ch. 12] November 20, 2003 Doug James Carnegie Mellon University http://www.cs.cmu.edu/~djames/15-462/fall03
Maya tutorial. 1 Camera calibration
 Maya tutorial In this tutorial we will augment a real scene with virtual objects. This tutorial assumes that you have downloaded the file Maya.zip from the course web page and extracted it somewhere. 1
1 Motorbike with ParaFoam
 Motorbike with ParaFoam Leon Kos, University of Ljubljana, Slovenia University of Ljubljana PRACE Summer of HPC 2017 Training Week 7 July 2017, Ostrava 1 Motorbike with ParaFoam Learning outcome After
KNIME Enalos+ Modelling nodes
 KNIME Enalos+ Modelling nodes A Brief Tutorial Novamechanics Ltd Contact: info@novamechanics.com Version 1, June 2017 Table of Contents Introduction... 1 Step 1-Workbench overview... 1 Step 2-Building
Introduction to 3D Scientific Visualization. Training in Visualization for PRACE Summer of HPC 2013 Leon Kos, University of Ljubljana, Slovenia
 Introduction to 3D Scientific Visualization Training in Visualization for PRACE Summer of HPC 2013 Leon Kos, University of Ljubljana, Slovenia Motto Few correctly put words is worth hundreds of images.
WWW home page:
 alexander.pletzer@noaa.gov, WWW home page: http://ncvtk.sf.net/ 1 Ncvtk: A program for visualizing planetary data Alexander Pletzer 1,4, Remik Ziemlinski 2,4, and Jared Cohen 3,4 1 RS Information Systems
CIS 467/602-01: Data Visualization
 CIS 467/60-01: Data Visualization Isosurfacing and Volume Rendering Dr. David Koop Fields and Grids Fields: values come from a continuous domain, infinitely many values - Sampled at certain positions to
Post-processing utilities in Elmer
 Post-processing utilities in Elmer Peter Råback ElmerTeam CSC IT Center for Science PATC course on parallel workflows Stockholm, 4-6.12.2013 Alternative postprocessors for Elmer Open source ElmerPost Postprocessor
KNIME Enalos+ Molecular Descriptor nodes
 KNIME Enalos+ Molecular Descriptor nodes A Brief Tutorial Novamechanics Ltd Contact: info@novamechanics.com Version 1, June 2017 Table of Contents Introduction... 1 Step 1-Workbench overview... 1 Step
Challenges and Opportunities in using Software-Defined Visualization in MegaMol
 Challenges and Opportunities in using Software-Defined Visualization in MegaMol Tobias Rau, Patrick Gralka, Michael Krone, Guido Reina, Thomas Ertl IXPUG Bologna 2018-03-06 The MegaMol Visualization Framework
3D Visualization for Matlab
 3D Visualization for Matlab Erich Birngruber, René Donner, Georg Langs Computational Image Analysis and Radiology Lab Medical University of Vienna, Austria http://www.cir.meduniwien.ac.at/ CSAIL, Massachusetts
VISUALIZING DATA AT NORTHWESTERN UNIVERSITY. Matt McCrory Lead Visualization Engineer
 VISUALIZING DATA AT NORTHWESTERN UNIVERSITY Matt McCrory Lead Visualization Engineer MATT MCCRORY Lead Visualization Engineer - Lighting Artist/Tech Director at DreamWorks Animation - Visualization Engineer
Local and Remote Visualisation Techniques
 Local and Remote Visualisation Techniques UvA High Performance Computing course Robert Belleman, Informatics Institute (II), UvA Paul Melis, SURFsara Casper van Leeuwen, SURFsara Thijs de Boer, Institute
Scalar Algorithms: Contouring
 Scalar Algorithms: Contouring Computer Animation and Visualisation Lecture tkomura@inf.ed.ac.uk Institute for Perception, Action & Behaviour School of Informatics Contouring Scaler Data Last Lecture...
Tools Menu (Frequently Used Features)
") Tools Menu (Frequently Used Features) Exit VoxelCalc Shop for features Show VoxelCalc User Guide (right click on oither icons shows user guide for that function) Region of Interest (ROI) tool with beam
Tools Menu (Frequently Used Features) Exit VoxelCalc Shop for features Show VoxelCalc User Guide (right click on oither icons shows user guide for that function) Region of Interest (ROI) tool with beam
Scientific Visualization
 Scientific Visualization University of Houston, Fall 2012 Instructor: GuoningChen Course Information Location: PGH 376 Time: 10am~11:30am Tuesday and Thursday Office Hours: TBA Course webpage: http://www2.cs.uh.edu/~chengu/teaching/sci
A Chromium Based Viewer for CUMULVS
 A Chromium Based Viewer for CUMULVS Submitted to PDPTA 06 Dan Bennett Corresponding Author Department of Mathematics and Computer Science Edinboro University of PA Edinboro, Pennsylvania 16444 Phone: (814)
CS 543: Computer Graphics. Introduction
 CS 543: Computer Graphics Introduction Robert W. Lindeman Associate Professor Department of Computer Science Worcester Polytechnic Institute gogo@wpi.edu (with lots of help from Prof. Emmanuel Agu :-)
Scientific Visualization
 Scientific Visualization Topics Motivation Color InfoVis vs. SciVis VisTrails Core Techniques Advanced Techniques 1 Check Assumptions: Why Visualize? Problem: How do you apprehend 100k tuples? when your
Visualization. Christopher Fluke. & David Barnes. Gas and Stars in Galaxies A Multi-Wavelength 3D Perspective. THINGS datacubes courtesy Erwin De Blok
 Visualization Christopher Fluke & David Barnes THINGS datacubes courtesy Erwin De Blok Gas and Stars in Galaxies A Multi-Wavelength 3D Perspective Astronomy Datasets Increasingly multi-dimensional (N 3)
ay/bi199: methods of computational science visualization jumpstart+tools+techniques santiago v lombeyda center for advanced computing research caltech
 ay/bi199: methods of computational science visualization jumpstart+tools+techniques santiago v lombeyda center for advanced computing research caltech analytical answers new questions data questions visual
Ing. Mario Valle CSCS Data Analysis Group
 Ing. Mario Valle CSCS Data Analysis Group An introduction to the molecular visualization toolkit STM4 Agenda Why STM4? STM4 architecture AVS/Express concepts STM4 modules overview STM4 quick tour Agenda
University of California, Riverside. Computing and Communications. Computational UCR. March 28, Introduction 2
 University of California, Riverside Computing and Communications Computational Clusters @ UCR March 28, 2008 1 Introduction 2 2 Campus Datacenter Co-Location Facility 2 3 Three Cluster Models 2 3.1 Departmentally
The Industry Standard in 3D Ion and Electron Optics Simulations. Scientific Instrument Services, Inc.
 SIMION Version 8.1 The Industry Standard in 3D Ion and Electron Optics Simulations www.simion.com TM Scientific Instument Services, Inc Scientific Instrument Services, Inc. 1027 Old York Rd, Ringoes, NJ
HPC Computer Aided CINECA
 HPC Computer Aided Engineering @ CINECA Raffaele Ponzini Ph.D. CINECA SuperComputing Applications and Innovation Department SCAI 16-18 June 2014 Segrate (MI), Italy Outline Open-source CAD and Meshing
Visualization Computer Graphics I Lecture 20
 15-462 Computer Graphics I Lecture 20 Visualization Height Fields and Contours Scalar Fields Volume Rendering Vector Fields [Angel Ch. 12] April 15, 2003 Frank Pfenning Carnegie Mellon University http://www.cs.cmu.edu/~fp/courses/graphics/
Height Fields and Contours Scalar Fields Volume Rendering Vector Fields [Angel Ch. 12] April 23, 2002 Frank Pfenning Carnegie Mellon University
![Height Fields and Contours Scalar Fields Volume Rendering Vector Fields [Angel Ch. 12] April 23, 2002 Frank Pfenning Carnegie Mellon University](/thumbs/90/102611276.jpg "Height Fields and Contours Scalar Fields Volume Rendering Vector Fields [Angel Ch. 12] April 23, 2002 Frank Pfenning Carnegie Mellon University") 15-462 Computer Graphics I Lecture 21 Visualization Height Fields and Contours Scalar Fields Volume Rendering Vector Fields [Angel Ch. 12] April 23, 2002 Frank Pfenning Carnegie Mellon University http://www.cs.cmu.edu/~fp/courses/graphics/
15-462 Computer Graphics I Lecture 21 Visualization Height Fields and Contours Scalar Fields Volume Rendering Vector Fields [Angel Ch. 12] April 23, 2002 Frank Pfenning Carnegie Mellon University http://www.cs.cmu.edu/~fp/courses/graphics/
Cindy3D Project Documentation
 Cindy3D Project Documentation Matthias Reitinger Jan Sommer March 13, 2012 2 Contents 1. Project overview 4 1.1. Cinderella & CindyScript........................... 4 1.2. Cindy3D.....................................
Scientific Visualization
 High Performance Computing: Concepts, Methods & Means Scientific Visualization Prof. Thomas Sterling Department of Computer Science Louisiana State University April 12 th, 2007 Topics Introduction Application
CIS 467/602-01: Data Visualization
 CIS 467/602-01: Data Visualization Vector Field Visualization Dr. David Koop Fields Tables Networks & Trees Fields Geometry Clusters, Sets, Lists Items Items (nodes) Grids Items Items Attributes Links
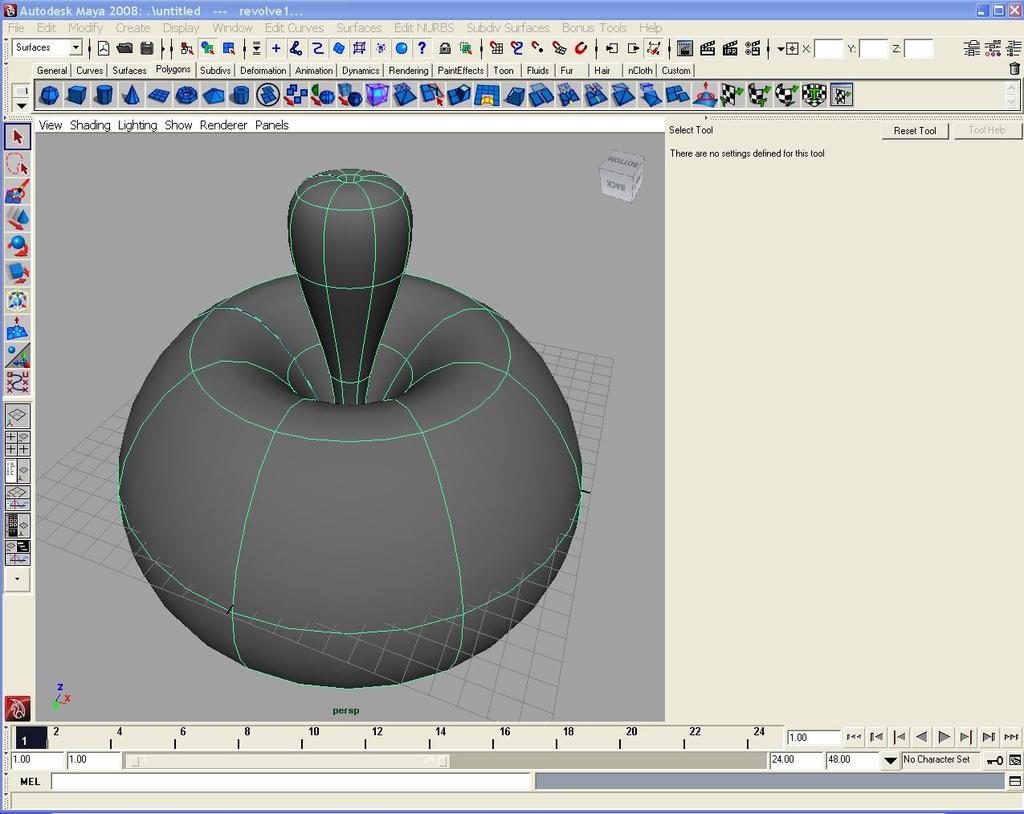
4. Scaled extrusion: a cylinder that is wide at one end and narrow at the other, for example.
 Chapter 18 Three Dimensions 18.1 Three-Dimensional Drawing Three-dimensional illustration programs are rather like their two-dimensional counterparts except that the range of tools and options is necessarily
3D PDF Plug-ins for Autodesk products Version 2.0
 Axes 3D PDF Plug-ins for Autodesk products Version 2.0 User Guide This end user manual provides instructions for the tetra4d - 3D PDF Plug-ins for Autodesk 203/204 applications. It includes a getting started
Basis Sets, Electronic Properties, and Visualization
 Basis Sets, Electronic Properties, and Visualization Goals of the Exercise - Perform common quantum chemical calculations using the Gaussian package. - Practice preparation, monitoring, and analysis of
Scientific Visualization
 Scientific Visualization Dr. Ronald Peikert Summer 2007 Ronald Peikert SciVis 2007 - Introduction 1-1 Introduction to Scientific Visualization Ronald Peikert SciVis 2007 - Introduction 1-2 What is Scientific
CSE 167: Introduction to Computer Graphics. Jürgen P. Schulze, Ph.D. University of California, San Diego Fall Quarter 2013
 CSE 167: Introduction to Computer Graphics Jürgen P. Schulze, Ph.D. University of California, San Diego Fall Quarter 2013 Today Course organization Course overview 2 Course Staff Instructor Jürgen Schulze,
Introduction to Scientific Visualization in the WestGrid Environment
 Introduction to Scientific Visualization in the WestGrid Environment Jon Johansson Academic Information and Communication Technologies University of Alberta Slide 1 of 75 What is Scientific Visualization?
Overview and Introduction to Scientific Visualization. Texas Advanced Computing Center The University of Texas at Austin
 Overview and Introduction to Scientific Visualization Texas Advanced Computing Center The University of Texas at Austin Scientific Visualization The purpose of computing is insight not numbers. -- R. W.
Lecture overview. Visualisatie BMT. Goal. Summary (1) Summary (3) Summary (2) Goal Summary Study material
 Summary (3) Summary (2) Goal Summary Study material") Visualisatie BMT Introduction, visualization, visualization pipeline Arjan Kok a.j.f.kok@tue.nl Lecture overview Goal Summary Study material What is visualization Examples Visualization pipeline 1 2 Goal
Visualisatie BMT Introduction, visualization, visualization pipeline Arjan Kok a.j.f.kok@tue.nl Lecture overview Goal Summary Study material What is visualization Examples Visualization pipeline 1 2 Goal
VisIt. Hank Childs October 10, IEEE Visualization Tutorial
 VisIt IEEE Visualization Tutorial Hank Childs October 10, 2004 The VisIt Team: Eric Brugger (project leader), Kathleen Bonnell, Hank Childs, Jeremy Meredith, Mark Miller, and Brad Gas bubble subjected
Systems Architecture for Visualisation
 Systems Architecture for Visualisation Visualisation Lecture 4 Taku Komura Institute for Perception, Action & Behaviour School of Informatics Taku Komura Systems Architecture 1 Last lecture... Basics of
Part 3: Chromium in Practice
 Part 3: Chromium in Practice 71 72 Chromium Configuration Tool (1) A graphical click and drag interface for creating Chromium's Python config files. Written in Python, using wxpython GUI toolkit, so it
Integrating Data Acquisition and Instrument Control with Your Scilab Scripts
 Integrating Data Acquisition and Instrument Control with Your Scilab Scripts Darcy Dement Marketing Director National Instruments France darcy.dement@ni.com Who We Are 800 Leaders in Computer-based Measurement
Analysis and Visualization Tools for Lattice QCD
 Analysis and Visualization Tools for Lattice QCD School of Computing - DePaul University - Chicago, IL - USA E-mail: mdipierro@cs.depaul.edu Yaoqian Zhong School of Computing - DePaul University - Chicago,
INTRODUCTION. Computer Graphics
 INTRODUCTION Computer Graphics 1 INTRODUCTION: THE OUTLINE I. Image Processing / Computer Graphics II. Advantages III. Representative Uses IV. Classification of Applications V. History VI. Conceptual Framework
Some Resources. What won t I learn? What will I learn? Topics
 CSC 706 Computer Graphics Course basics: Instructor Dr. Natacha Gueorguieva MW, 8:20 pm-10:00 pm Materials will be available at www.cs.csi.cuny.edu/~natacha 1 midterm, 2 projects, 1 presentation, homeworks,
Getting Started Guide Visicon Smart BIM Tools
 Getting Started Guide Visicon Smart BIM Tools Visicon is a collection of practical tools created to enhance your ability to visualize, interact with, extract data, quality control, quantify, analyze, and
Dr. Shahanawaj Ahamad. Dr. S.Ahamad, SWE-423, Unit-04
 Dr. Shahanawaj Ahamad Dr. S.Ahamad, SWE-423, Unit-04 1 Dr. S.Ahamad, SWE-423, Unit-04 2 Nowadays small multimedia features are included in all desktop software that you can use to create documents. The
What is visualization? Why is it important?
 What is visualization? Why is it important? What does visualization do? What is the difference between scientific data and information data Visualization Pipeline Visualization Pipeline Overview Data acquisition
The PowerVR Insider SDK. PowerVR Developer Technology
 The PowerVR Insider SDK PowerVR Developer Technology Nov 2012 First, An Introduction! Who Am I? Who? Guillem Vinals Developer Technology Engineer, PowerVR Graphics What? An introduction to our PowerVR
Managing the Evolution of Dataflows with VisTrails
 Managing the Evolution of Dataflows with VisTrails Juliana Freire http://www.cs.utah.edu/~juliana University of Utah Joint work with: Steven P. Callahan, Emanuele Santos, Carlos E. Scheidegger, Claudio
Introduction and Overview
 CS 523: Computer Graphics, Spring 2009 Shape Modeling Introduction and Overview 1/28/2009 1 Geometric Modeling To describe any reallife object on the computer must start with shape (2D/3D) Geometry processing