Section 2.2 Normal Distributions
|
|
|
- Cathleen Stephens
- 5 years ago
- Views:
Transcription
1 Section 2.2 Mrs. Daniel AP Statistics We abbreviate the Normal distribution with mean µ and standard deviation σ as N(µ,σ). Any particular Normal distribution is completely specified by two numbers: its mean µ and standard deviation σ. The mean of a Normal distribution is the center of the symmetric Normal curve. The standard deviation is the distance from the center to the change of curvature points on either side. Section 2.2 After this section, you should be able to DESCRIBE and APPLY the Rule DESCRIBE the standard Normal Distribution are Useful Normal distributions are good descriptions for some distributions of real data. Normal distributions are good approximations of the results of many kinds of chance outcomes. Many statistical inference procedures are based on Normal distributions. PERFORM Normal distribution calculations ASSESS Normality All Normal curves are symmetric, single peaked, and bellshaped A Specific Normal curve is described by giving its mean µ and standard deviation σ. Two Normal curves, showing the mean µ and standard deviation σ. The Rule Although there are many different sizes and shapes of Normal curves, they all have properties in common. The Rule ( The Empirical Rule ) In the Normal distribution with mean µ and standard deviation σ: Approximately 68% of the observations fall within σ of µ. Approximately 95% of the observations fall within 2σ of µ. Approximately 99.7% of the observations fall within 3σ of µ.
 Using the Empirical Rule, what percent of ITBS vocabulary scores are less than 3.74? Normal.")
 Sketch the Normal density curve for this distribution.")
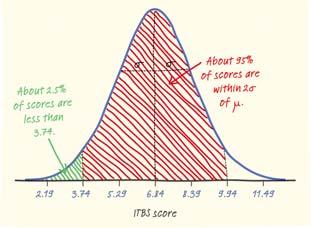
2 Normal. Suppose the distribution is N(6.84, 1.55). b) Using the Empirical Rule, what percent of ITBS vocabulary scores are less than 3.74? Normal. Suppose the distribution is N(6.84, 1.55) and the range is between 0 and 12. a) Sketch the Normal density curve for this distribution. Normal. Suppose the distribution is N(6.84, 1.55). b) Using the Empirical Rule, what percent of ITBS vocabulary scores are less than 3.74? Normal. Suppose the distribution is N(6.84, 1.55) and the range is between 0 and 12. a) Sketch the Normal density curve for this distribution. Normal. Suppose the distribution is N(6.84, 1.55).? c) Using the Empirical Rule, what percent of the scores are between 5.29 and 9.94?


3 Normal. Suppose the distribution is N(6.84, 1.55).? c) Using the Empirical Rule, What percent of the scores are between 5.29 and 9.94? How to Standardize a Variable: 1. Draw and label an Normal curve with the mean and standard deviation. 2. Calculate the z score x= variable µ= mean σ= standard deviation 3. Determine the p value by looking up the z score in the Standard Normal table. 4. Conclude in context. Importance of Standardizing There are infinitely many different Normal distributions; all with unique standard deviations and means. In order to more effectively compare different Normal distributions we standardize. Standardizing allows us to compare apples to apples. We can compare SAT and ACT scores by standardizing. The Standardized Normal Distribution All Normal distributions are the same if we measure in units of size σ from the mean µ as center. The standardized Normal distribution is the Normal distribution with mean 0 and standard deviation 1. The Standard Normal Table Because all Normal distributions are the same when we standardize, we can find areas under any Normal curve from a single table. The Standard Normal table is a table of the areas under the standard normal curve. The table entry for each value z is area under the curve to the LEFT of z. The area to left is called the p value Probability Percent

 =.7910 2.23 1.")
 on his first serves.")

4 Using the Standard Normal Table Row: Ones and tenths digits Column: Hundredths digit Practice: What is the p value for a z score of 2.33? 1. Draw and label an Normal curve with the mean and standard deviation. 2. Calculate the z score x= variable µ= mean σ= standard deviation Using the Standard Normal Table Using the Standard Normal Table, find the following: 3. Determine the p value by looking up the z score in the Standard Normal table. P(z < 0.81) = Z Score P value Z Let s Practice In the 2008 Wimbledon tennis tournament, Rafael Nadal averaged 115 miles per hour (mph) on his first serves. Assume that the distribution of his first serve speeds is Normal with a mean of 115 mph and a standard deviation of 6.2 mph. About what proportion of his first serves would you expect to be less than 120 mph? Greater than? 4. Conclude in context. We expect that 79.1% of Nadal s first serves will be less than 120 mph. We expect that 20.9% of Nadal s first serves will be greater than 120 mps.

5 Let s Practice When Tiger Woods hits his driver, the distance the ball travels can be described by N(304, 8). What percent of Tiger s drives travel between 305 and 325 yards? Normal Calculations on Calculator NormalCDF NormalPDF InvNorm Calculates Probability of obtaining a value BETWEEN two values Probability of obtaining PRECISELY or EXACTLY a specific x value X value given probability or percentile Example What percent of students scored between 70 and 95 on the test? What is the probability that Suzy scored a 75 on the test? Tommy scored a 92 on the test; what proportion of students did he score better than? When Tiger Woods hits his driver, the distance the ball travels can be described by N(304, 8). What percent of Tiger s drives travel between 305 and 325 yards? Step 1: Draw Distribution Step 2: Z Scores When x = 325, z = When x = 305, z = TI Nspire: NormalCDF Normalcdf Area under the curve between two points 1. Select Calculator (on home screen), press center button. 2. Press menu, press enter. 3. Select 6: Statistics, press enter. 4. Select 5: Distributions, press enter. 5. Select 2: Normal Cdf, press enter. 6. Enter the following information: 1. Lower: (the lower bound of the region OR 1^ 99) 2. Upper: (the upper band of the region OR 1,000,000) 3. µ: (mean) 4. Ơ: (standard deviation) 7. Press enter, number that appears is the p value Step 3: P values TI Nspire: NormalPDF Normalpdf Exact percentile/probability of a specific event occurring Using Table A, we can find the area to the left of z=2.63 and the area to the left of z= = Step 4: Conclude In Context 1. Select Calculator (on home screen), press center button. 2. Press menu, press enter. 3. Select 6: Statistics, press enter. 4. Select 5: Distributions, press enter. 5. Select 1: Normal Pdf press enter. 6. Enter the following information: 1. Xvalue (not a percent) 2. µ: (mean) 3. Ơ: (standard deviation) 7. Press enter, number that appears is the p value About 44% of Tiger s drives travel between 305 and 325 yards.
 2. µ: (mean) 3. Ơ: (standard deviation) 7.")
6 TI Nspire: InvNorm invnorm Exact x value at which something occurred 1. Select Calculator (on home screen), press center button. 2. Press menu, press enter. 3. Select 6: Statistics, press enter. 4. Select 5: Distributions, press enter. 5. Select 3: Inverse Norm press enter. 6. Enter the following information: 1. Area (enter as a decimal) 2. µ: (mean) 3. Ơ: (standard deviation) 7. Press enter, number that appears is the p value Suzy bombed her recent AP Stats exam; she scored at the 25 th percentile. The class average was a 170 with a standard deviation of 30. Assuming the scores are normally distributed, what score did Suzy earn of the exam? When Tiger Woods hits his driver, the distance the ball travels can be described by N(304, 8). What percent of Tiger s drives travel between 305 and 325 yards? Suzy bombed her recent AP Stats exam; she scored at the 25 th percentile. The class average was a 170 with a standard deviation of 30. Assuming the scores are normally distributed, what score did Suzy earn of the exam? When Tiger Woods hits his driver, the distance the ball travels can be described by N(304, 8). What percent of Tiger s drives travel between 305 and 325 yards? When Can I Use Normal Calculations?! Whenever the distribution is Normal. Ways to Assess Normality: Plot the data. Make a dotplot, stemplot, or histogram and see if the graph is approximately symmetric and bell shaped. Check whether the data follow the rule. Construct a Normal probability plot.


. The mean is the center of the curve, and σ is the distance from µ to the change ofcurvature points on either side.")

7 Normal Probability Plot These plots are constructed by plotting each observation in a data set against its corresponding percentile s z score. Additional Help Interpreting Normal Probability Plot If the points on a Normal probability plot lie close to a straight line, the plot indicates that the data are Normal. Systematic deviations from a straight line indicate a non Normal distribution. Outliers appear as points that are far away from the overall pattern of the plot. Finding Areas Under the Standard Normal Curve Find the proportion of observations from the standard Normal distribution that are between 1.25 and Step 1: Look up area to the left of 0.81 using table A. Step 2: Find the area to the left of 1.25 Summary: The are described by a special family of bell shaped, symmetric density curves called Normal curves. The mean µ and standard deviation σ completely specify a Normal distribution N(µ,σ). The mean is the center of the curve, and σ is the distance from µ to the change ofcurvature points on either side. All Normal distributions obey the Rule, which describes what percent of observations lie within one, two, and three standard deviations of the mean. All Normal distributions are the same when measurements are standardized. The standard Normal distribution has mean µ=0 and standard deviation σ=1. Table A gives percentiles for the standard Normal curve. By standardizing, we can use Table A to determine the percentile for a given z score or the z score corresponding to a given percentile in any Normal distribution. To assess Normality for a given set of data, we first observe its shape. We then check how well the data fits the rule. Finding Areas Under the Standard Normal Curve Find the proportion of observations from the standard Normal distribution that are between 1.25 and Step 3: Subtract.
Chapter 2: Modeling Distributions of Data
 Chapter 2: Modeling Distributions of Data Section 2.2 The Practice of Statistics, 4 th edition - For AP* STARNES, YATES, MOORE Chapter 2 Modeling Distributions of Data 2.1 Describing Location in a Distribution
Section 2.2 Normal Distributions. Normal Distributions
 Section 2.2 Normal Distributions Normal Distributions One particularly important class of density curves are the Normal curves, which describe Normal distributions. All Normal curves are symmetric, single-peaked,
Chapter 2 Modeling Distributions of Data
 Chapter 2 Modeling Distributions of Data Section 2.1 Describing Location in a Distribution Describing Location in a Distribution Learning Objectives After this section, you should be able to: FIND and
CHAPTER 2 Modeling Distributions of Data
 CHAPTER 2 Modeling Distributions of Data 2.2 Density Curves and Normal Distributions The Practice of Statistics, 5th Edition Starnes, Tabor, Yates, Moore Bedford Freeman Worth Publishers Density Curves
CHAPTER 2 Modeling Distributions of Data
 CHAPTER 2 Modeling Distributions of Data 2.2 Density Curves and Normal Distributions The Practice of Statistics, 5th Edition Starnes, Tabor, Yates, Moore Bedford Freeman Worth Publishers Density Curves
CHAPTER 2 Modeling Distributions of Data
 CHAPTER 2 Modeling Distributions of Data 2.2 Density Curves and Normal Distributions The Practice of Statistics, 5th Edition Starnes, Tabor, Yates, Moore Bedford Freeman Worth Publishers HW 34. Sketch
Key: 5 9 represents a team with 59 wins. (c) The Kansas City Royals and Cleveland Indians, who both won 65 games.
 The Kansas City Royals and Cleveland Indians, who both won 65 games.") AP statistics Chapter 2 Notes Name Modeling Distributions of Data Per Date 2.1A Distribution of a variable is the a variable takes and it takes that value. When working with quantitative data we can calculate
AP statistics Chapter 2 Notes Name Modeling Distributions of Data Per Date 2.1A Distribution of a variable is the a variable takes and it takes that value. When working with quantitative data we can calculate
Data Analysis & Probability
 Unit 5 Probability Distributions Name: Date: Hour: Section 7.2: The Standard Normal Distribution (Area under the curve) Notes By the end of this lesson, you will be able to Find the area under the standard
Learning Objectives. Continuous Random Variables & The Normal Probability Distribution. Continuous Random Variable
 Learning Objectives Continuous Random Variables & The Normal Probability Distribution 1. Understand characteristics about continuous random variables and probability distributions 2. Understand the uniform
Lecture 3 Questions that we should be able to answer by the end of this lecture:
 Lecture 3 Questions that we should be able to answer by the end of this lecture: Which is the better exam score? 67 on an exam with mean 50 and SD 10 or 62 on an exam with mean 40 and SD 12 Is it fair
Chapter 2: Statistical Models for Distributions
 Chapter 2: Statistical Models for Distributions 2.2 Normal Distributions In Chapter 2 of YMS, we learn that distributions of data can be approximated by a mathematical model known as a density curve. In
MAT 102 Introduction to Statistics Chapter 6. Chapter 6 Continuous Probability Distributions and the Normal Distribution
 MAT 102 Introduction to Statistics Chapter 6 Chapter 6 Continuous Probability Distributions and the Normal Distribution 6.2 Continuous Probability Distributions Characteristics of a Continuous Probability
Lecture 3 Questions that we should be able to answer by the end of this lecture:
 Lecture 3 Questions that we should be able to answer by the end of this lecture: Which is the better exam score? 67 on an exam with mean 50 and SD 10 or 62 on an exam with mean 40 and SD 12 Is it fair
STA Module 4 The Normal Distribution
 STA 2023 Module 4 The Normal Distribution Learning Objectives Upon completing this module, you should be able to 1. Explain what it means for a variable to be normally distributed or approximately normally
STA /25/12. Module 4 The Normal Distribution. Learning Objectives. Let s Look at Some Examples of Normal Curves
 STA 2023 Module 4 The Normal Distribution Learning Objectives Upon completing this module, you should be able to 1. Explain what it means for a variable to be normally distributed or approximately normally
CHAPTER 2: Describing Location in a Distribution
 CHAPTER 2: Describing Location in a Distribution 2.1 Goals: 1. Compute and use z-scores given the mean and sd 2. Compute and use the p th percentile of an observation 3. Intro to density curves 4. More
The Normal Distribution
 The Normal Distribution Lecture 20 Section 6.3.1 Robb T. Koether Hampden-Sydney College Wed, Sep 28, 2011 Robb T. Koether (Hampden-Sydney College) The Normal Distribution Wed, Sep 28, 2011 1 / 41 Outline
6-1 THE STANDARD NORMAL DISTRIBUTION
 6-1 THE STANDARD NORMAL DISTRIBUTION The major focus of this chapter is the concept of a normal probability distribution, but we begin with a uniform distribution so that we can see the following two very
Chapter 2: The Normal Distribution
 Chapter 2: The Normal Distribution 2.1 Density Curves and the Normal Distributions 2.2 Standard Normal Calculations 1 2 Histogram for Strength of Yarn Bobbins 15.60 16.10 16.60 17.10 17.60 18.10 18.60
Normal Distribution. 6.4 Applications of Normal Distribution
 Normal Distribution 6.4 Applications of Normal Distribution 1 /20 Homework Read Sec 6-4. Discussion question p316 Do p316 probs 1-10, 16-22, 31, 32, 34-37, 39 2 /20 3 /20 Objective Find the probabilities
Chapter 6. THE NORMAL DISTRIBUTION
 Chapter 6. THE NORMAL DISTRIBUTION Introducing Normally Distributed Variables The distributions of some variables like thickness of the eggshell, serum cholesterol concentration in blood, white blood cells
The Normal Distribution
 Chapter 6 The Normal Distribution Continuous random variables are used to approximate probabilities where there are many possibilities or an infinite number of possibilities on a given trial. One of the
Density Curve (p52) Density curve is a curve that - is always on or above the horizontal axis.
 Density curve is a curve that - is always on or above the horizontal axis.") 1.3 Density curves p50 Some times the overall pattern of a large number of observations is so regular that we can describe it by a smooth curve. It is easier to work with a smooth curve, because the histogram
1.3 Density curves p50 Some times the overall pattern of a large number of observations is so regular that we can describe it by a smooth curve. It is easier to work with a smooth curve, because the histogram
Chapter 2: The Normal Distributions
 Chapter 2: The Normal Distributions Measures of Relative Standing & Density Curves Z-scores (Measures of Relative Standing) Suppose there is one spot left in the University of Michigan class of 2014 and
So..to be able to make comparisons possible, we need to compare them with their respective distributions.
 Unit 3 ~ Modeling Distributions of Data 1 ***Section 2.1*** Measures of Relative Standing and Density Curves (ex) Suppose that a professional soccer team has the money to sign one additional player and
Chapter 6. THE NORMAL DISTRIBUTION
 Chapter 6. THE NORMAL DISTRIBUTION Introducing Normally Distributed Variables The distributions of some variables like thickness of the eggshell, serum cholesterol concentration in blood, white blood cells
Name: Date: Period: Chapter 2. Section 1: Describing Location in a Distribution
 Name: Date: Period: Chapter 2 Section 1: Describing Location in a Distribution Suppose you earned an 86 on a statistics quiz. The question is: should you be satisfied with this score? What if it is the
Introduction to the Practice of Statistics Fifth Edition Moore, McCabe
 Introduction to the Practice of Statistics Fifth Edition Moore, McCabe Section 1.3 Homework Answers Assignment 5 1.80 If you ask a computer to generate "random numbers between 0 and 1, you uniform will
Chapter 5: The standard deviation as a ruler and the normal model p131
 Chapter 5: The standard deviation as a ruler and the normal model p131 Which is the better exam score? 67 on an exam with mean 50 and SD 10 62 on an exam with mean 40 and SD 12? Is it fair to say: 67 is
Section 10.4 Normal Distributions
 Section 10.4 Normal Distributions Random Variables Suppose a bank is interested in improving its services to customers. The manager decides to begin by finding the amount of time tellers spend on each
Lecture 21 Section Fri, Oct 3, 2008
 Lecture 21 Section 6.3.1 Hampden-Sydney College Fri, Oct 3, 2008 Outline 1 2 3 4 5 6 Exercise 6.15, page 378. A young woman needs a 15-ampere fuse for the electrical system in her apartment and has decided
7.2. The Standard Normal Distribution
 7.2 The Standard Normal Distribution Standard Normal The standard normal curve is the one with mean μ = 0 and standard deviation σ = 1 We have related the general normal random variable to the standard
Distributions of random variables
 Chapter 3 Distributions of random variables 31 Normal distribution Among all the distributions we see in practice, one is overwhelmingly the most common The symmetric, unimodal, bell curve is ubiquitous
appstats6.notebook September 27, 2016
 Chapter 6 The Standard Deviation as a Ruler and the Normal Model Objectives: 1.Students will calculate and interpret z scores. 2.Students will compare/contrast values from different distributions using
Unit 7 Statistics. AFM Mrs. Valentine. 7.1 Samples and Surveys
 Unit 7 Statistics AFM Mrs. Valentine 7.1 Samples and Surveys v Obj.: I will understand the different methods of sampling and studying data. I will be able to determine the type used in an example, and
AP Statistics. Study Guide
 Measuring Relative Standing Standardized Values and z-scores AP Statistics Percentiles Rank the data lowest to highest. Counting up from the lowest value to the select data point we discover the percentile
Prepare a stem-and-leaf graph for the following data. In your final display, you should arrange the leaves for each stem in increasing order.
 Chapter 2 2.1 Descriptive Statistics A stem-and-leaf graph, also called a stemplot, allows for a nice overview of quantitative data without losing information on individual observations. It can be a good
MAT 110 WORKSHOP. Updated Fall 2018
 MAT 110 WORKSHOP Updated Fall 2018 UNIT 3: STATISTICS Introduction Choosing a Sample Simple Random Sample: a set of individuals from the population chosen in a way that every individual has an equal chance
Lecture 6: Chapter 6 Summary
 1 Lecture 6: Chapter 6 Summary Z-score: Is the distance of each data value from the mean in standard deviation Standardizes data values Standardization changes the mean and the standard deviation: o Z
Chapter 6 The Standard Deviation as Ruler and the Normal Model
 ST 305 Chapter 6 Reiland The Standard Deviation as Ruler and the Normal Model Chapter Objectives: At the end of this chapter you should be able to: 1) describe how adding or subtracting the same value
Normal Data ID1050 Quantitative & Qualitative Reasoning
 Normal Data ID1050 Quantitative & Qualitative Reasoning Histogram for Different Sample Sizes For a small sample, the choice of class (group) size dramatically affects how the histogram appears. Say we
UNIT 1A EXPLORING UNIVARIATE DATA
 A.P. STATISTICS E. Villarreal Lincoln HS Math Department UNIT 1A EXPLORING UNIVARIATE DATA LESSON 1: TYPES OF DATA Here is a list of important terms that we must understand as we begin our study of statistics
What s Normal Anyway?
 Name Class Problem 1 A Binomial Experiment 1. When rolling a die, what is the theoretical probability of rolling a 3? 2. When a die is rolled 100 times, how many times do you expect that a 3 will be rolled?
3.5 Applying the Normal Distribution: Z-Scores
 3.5 Applying the Normal Distribution: Z-Scores In the previous section, you learned about the normal curve and the normal distribution. You know that the area under any normal curve is 1, and that 68%
Chapter 6 Normal Probability Distributions
 Chapter 6 Normal Probability Distributions 6-1 Review and Preview 6-2 The Standard Normal Distribution 6-3 Applications of Normal Distributions 6-4 Sampling Distributions and Estimators 6-5 The Central
23.2 Normal Distributions
 1_ Locker LESSON 23.2 Normal Distributions Common Core Math Standards The student is expected to: S-ID.4 Use the mean and standard deviation of a data set to fit it to a normal distribution and to estimate
Unit 5: Estimating with Confidence
 Unit 5: Estimating with Confidence Section 8.3 The Practice of Statistics, 4 th edition For AP* STARNES, YATES, MOORE Unit 5 Estimating with Confidence 8.1 8.2 8.3 Confidence Intervals: The Basics Estimating
BIOL Gradation of a histogram (a) into the normal curve (b)
 into the normal curve (b)") (التوزيع الطبيعي ( Distribution Normal (Gaussian) One of the most important distributions in statistics is a continuous distribution called the normal distribution or Gaussian distribution. Consider the
(التوزيع الطبيعي ( Distribution Normal (Gaussian) One of the most important distributions in statistics is a continuous distribution called the normal distribution or Gaussian distribution. Consider the
Lecture Slides. Elementary Statistics Twelfth Edition. by Mario F. Triola. and the Triola Statistics Series. Section 6.2-1
 Lecture Slides Elementary Statistics Twelfth Edition and the Triola Statistics Series by Mario F. Triola Section 6.2-1 Chapter 6 Normal Probability Distributions 6-1 Review and Preview 6-2 The Standard
No. of blue jelly beans No. of bags
 Math 167 Ch5 Review 1 (c) Janice Epstein CHAPTER 5 EXPLORING DATA DISTRIBUTIONS A sample of jelly bean bags is chosen and the number of blue jelly beans in each bag is counted. The results are shown in
CHAPTER 2: SAMPLING AND DATA
 CHAPTER 2: SAMPLING AND DATA This presentation is based on material and graphs from Open Stax and is copyrighted by Open Stax and Georgia Highlands College. OUTLINE 2.1 Stem-and-Leaf Graphs (Stemplots),
Normal Curves and Sampling Distributions
 Normal Curves and Sampling Distributions 6 Copyright Cengage Learning. All rights reserved. Section 6.2 Standard Units and Areas Under the Standard Normal Distribution Copyright Cengage Learning. All rights
Probability & Statistics Chapter 6. Normal Distribution
 I. Graphs of Normal Probability Distributions Normal Distribution Studied by French mathematician Abraham de Moivre and German mathematician Carl Friedrich Gauss. Gauss work was so important that the normal
Math 120 Introduction to Statistics Mr. Toner s Lecture Notes 3.1 Measures of Central Tendency
 Math 1 Introduction to Statistics Mr. Toner s Lecture Notes 3.1 Measures of Central Tendency lowest value + highest value midrange The word average: is very ambiguous and can actually refer to the mean,
Continuous Improvement Toolkit. Normal Distribution. Continuous Improvement Toolkit.
 Continuous Improvement Toolkit Normal Distribution The Continuous Improvement Map Managing Risk FMEA Understanding Performance** Check Sheets Data Collection PDPC RAID Log* Risk Analysis* Benchmarking***
AP Statistics Summer Assignment:
 AP Statistics Summer Assignment: Read the following and use the information to help answer your summer assignment questions. You will be responsible for knowing all of the information contained in this
Section 7.2: Applications of the Normal Distribution
 Section 7.2: Applications of the Normal Distribution Objectives By the end of this lesson, you will be able to... 1. find and interpret the area under a normal curve 2. find the value of a normal random
Section 1.2. Displaying Quantitative Data with Graphs. Mrs. Daniel AP Stats 8/22/2013. Dotplots. How to Make a Dotplot. Mrs. Daniel AP Statistics
 Section. Displaying Quantitative Data with Graphs Mrs. Daniel AP Statistics Section. Displaying Quantitative Data with Graphs After this section, you should be able to CONSTRUCT and INTERPRET dotplots,
CHAPTER 1. Introduction. Statistics: Statistics is the science of collecting, organizing, analyzing, presenting and interpreting data.
 1 CHAPTER 1 Introduction Statistics: Statistics is the science of collecting, organizing, analyzing, presenting and interpreting data. Variable: Any characteristic of a person or thing that can be expressed
Chapter 6: Continuous Random Variables & the Normal Distribution. 6.1 Continuous Probability Distribution
 Chapter 6: Continuous Random Variables & the Normal Distribution 6.1 Continuous Probability Distribution and the Normal Probability Distribution 6.2 Standardizing a Normal Distribution 6.3 Applications
TI-83 Users Guide. to accompany. Statistics: Unlocking the Power of Data by Lock, Lock, Lock, Lock, and Lock
 TI-83 Users Guide to accompany by Lock, Lock, Lock, Lock, and Lock TI-83 Users Guide- 1 Getting Started Entering Data Use the STAT menu, then select EDIT and hit Enter. Enter data for a single variable
Distributions of Continuous Data
 C H A P T ER Distributions of Continuous Data New cars and trucks sold in the United States average about 28 highway miles per gallon (mpg) in 2010, up from about 24 mpg in 2004. Some of the improvement
1. The Normal Distribution, continued
 Math 1125-Introductory Statistics Lecture 16 10/9/06 1. The Normal Distribution, continued Recall that the standard normal distribution is symmetric about z = 0, so the area to the right of zero is 0.5000.
Ch6: The Normal Distribution
 Ch6: The Normal Distribution Introduction Review: A continuous random variable can assume any value between two endpoints. Many continuous random variables have an approximately normal distribution, which
The first few questions on this worksheet will deal with measures of central tendency. These data types tell us where the center of the data set lies.
 Instructions: You are given the following data below these instructions. Your client (Courtney) wants you to statistically analyze the data to help her reach conclusions about how well she is teaching.
Chapter 3: Data Description - Part 3. Homework: Exercises 1-21 odd, odd, odd, 107, 109, 118, 119, 120, odd
 Chapter 3: Data Description - Part 3 Read: Sections 1 through 5 pp 92-149 Work the following text examples: Section 3.2, 3-1 through 3-17 Section 3.3, 3-22 through 3.28, 3-42 through 3.82 Section 3.4,
4.3 The Normal Distribution
 4.3 The Normal Distribution Objectives. Definition of normal distribution. Standard normal distribution. Specialties of the graph of the standard normal distribution. Percentiles of the standard normal
Student Learning Objectives
 Student Learning Objectives A. Understand that the overall shape of a distribution of a large number of observations can be summarized by a smooth curve called a density curve. B. Know that an area under
How individual data points are positioned within a data set.
 Section 3.4 Measures of Position Percentiles How individual data points are positioned within a data set. P k is the value such that k% of a data set is less than or equal to P k. For example if we said
height VUD x = x 1 + x x N N 2 + (x 2 x) 2 + (x N x) 2. N
 2 + (x N x) 2. N") Math 3: CSM Tutorial: Probability, Statistics, and Navels Fall 2 In this worksheet, we look at navel ratios, means, standard deviations, relative frequency density histograms, and probability density functions.
Math 3: CSM Tutorial: Probability, Statistics, and Navels Fall 2 In this worksheet, we look at navel ratios, means, standard deviations, relative frequency density histograms, and probability density functions.
Measures of Position
 Measures of Position In this section, we will learn to use fractiles. Fractiles are numbers that partition, or divide, an ordered data set into equal parts (each part has the same number of data entries).
Chapter 2: Descriptive Statistics
 Chapter 2: Descriptive Statistics Student Learning Outcomes By the end of this chapter, you should be able to: Display data graphically and interpret graphs: stemplots, histograms and boxplots. Recognize,
Chapter 2 Describing, Exploring, and Comparing Data
 Slide 1 Chapter 2 Describing, Exploring, and Comparing Data Slide 2 2-1 Overview 2-2 Frequency Distributions 2-3 Visualizing Data 2-4 Measures of Center 2-5 Measures of Variation 2-6 Measures of Relative
The Normal Distribution
 14-4 OBJECTIVES Use the normal distribution curve. The Normal Distribution TESTING The class of 1996 was the first class to take the adjusted Scholastic Assessment Test. The test was adjusted so that the
Introductory Applied Statistics: A Variable Approach TI Manual
 Introductory Applied Statistics: A Variable Approach TI Manual John Gabrosek and Paul Stephenson Department of Statistics Grand Valley State University Allendale, MI USA Version 1.1 August 2014 2 Copyright
Averages and Variation
 Averages and Variation 3 Copyright Cengage Learning. All rights reserved. 3.1-1 Section 3.1 Measures of Central Tendency: Mode, Median, and Mean Copyright Cengage Learning. All rights reserved. 3.1-2 Focus
10.4 Measures of Central Tendency and Variation
 10.4 Measures of Central Tendency and Variation Mode-->The number that occurs most frequently; there can be more than one mode ; if each number appears equally often, then there is no mode at all. (mode
10.4 Measures of Central Tendency and Variation
 10.4 Measures of Central Tendency and Variation Mode-->The number that occurs most frequently; there can be more than one mode ; if each number appears equally often, then there is no mode at all. (mode
MATH 1070 Introductory Statistics Lecture notes Descriptive Statistics and Graphical Representation
 MATH 1070 Introductory Statistics Lecture notes Descriptive Statistics and Graphical Representation Objectives: 1. Learn the meaning of descriptive versus inferential statistics 2. Identify bar graphs,
Stat 528 (Autumn 2008) Density Curves and the Normal Distribution. Measures of center and spread. Features of the normal distribution
 Density Curves and the Normal Distribution. Measures of center and spread. Features of the normal distribution") Stat 528 (Autumn 2008) Density Curves and the Normal Distribution Reading: Section 1.3 Density curves An example: GRE scores Measures of center and spread The normal distribution Features of the normal
Stat 528 (Autumn 2008) Density Curves and the Normal Distribution Reading: Section 1.3 Density curves An example: GRE scores Measures of center and spread The normal distribution Features of the normal
Parents Names Mom Cell/Work # Dad Cell/Work # Parent List the Math Courses you have taken and the grade you received 1 st 2 nd 3 rd 4th
 Full Name Phone # Parents Names Birthday Mom Cell/Work # Dad Cell/Work # Parent email: Extracurricular Activities: List the Math Courses you have taken and the grade you received 1 st 2 nd 3 rd 4th Turn
Chapter 6: DESCRIPTIVE STATISTICS
 Chapter 6: DESCRIPTIVE STATISTICS Random Sampling Numerical Summaries Stem-n-Leaf plots Histograms, and Box plots Time Sequence Plots Normal Probability Plots Sections 6-1 to 6-5, and 6-7 Random Sampling
Vocabulary. 5-number summary Rule. Area principle. Bar chart. Boxplot. Categorical data condition. Categorical variable.
 5-number summary 68-95-99.7 Rule Area principle Bar chart Bimodal Boxplot Case Categorical data Categorical variable Center Changing center and spread Conditional distribution Context Contingency table
Goals. The Normal Probability Distribution. A distribution. A Discrete Probability Distribution. Results of Tossing Two Dice. Probabilities involve
 Goals The Normal Probability Distribution Chapter 7 Dr. Richard Jerz Understand the difference between discrete and continuous distributions. Compute the mean, standard deviation, and probabilities for
CHAPTER 2 DESCRIPTIVE STATISTICS
 CHAPTER 2 DESCRIPTIVE STATISTICS 1. Stem-and-Leaf Graphs, Line Graphs, and Bar Graphs The distribution of data is how the data is spread or distributed over the range of the data values. This is one of
Chapter 5snow year.notebook March 15, 2018
 Chapter 5: Statistical Reasoning Section 5.1 Exploring Data Measures of central tendency (Mean, Median and Mode) attempt to describe a set of data by identifying the central position within a set of data
MATH NATION SECTION 9 H.M.H. RESOURCES
 MATH NATION SECTION 9 H.M.H. RESOURCES SPECIAL NOTE: These resources were assembled to assist in student readiness for their upcoming Algebra 1 EOC. Although these resources have been compiled for your
a. divided by the. 1) Always round!! a) Even if class width comes out to a, go up one.
 Always round!! a) Even if class width comes out to a, go up one.") Probability and Statistics Chapter 2 Notes I Section 2-1 A Steps to Constructing Frequency Distributions 1 Determine number of (may be given to you) a Should be between and classes 2 Find the Range a The
Probability and Statistics Chapter 2 Notes I Section 2-1 A Steps to Constructing Frequency Distributions 1 Determine number of (may be given to you) a Should be between and classes 2 Find the Range a The
MEASURES OF CENTRAL TENDENCY
 11.1 Find Measures of Central Tendency and Dispersion STATISTICS Numerical values used to summarize and compare sets of data MEASURE OF CENTRAL TENDENCY A number used to represent the center or middle
The Normal Probability Distribution. Goals. A distribution 2/27/16. Chapter 7 Dr. Richard Jerz
 The Normal Probability Distribution Chapter 7 Dr. Richard Jerz 1 2016 rjerz.com Goals Understand the difference between discrete and continuous distributions. Compute the mean, standard deviation, and
MAT 142 College Mathematics. Module ST. Statistics. Terri Miller revised July 14, 2015
 MAT 142 College Mathematics Statistics Module ST Terri Miller revised July 14, 2015 2 Statistics Data Organization and Visualization Basic Terms. A population is the set of all objects under study, a sample
Chapter2 Description of samples and populations. 2.1 Introduction.
 Chapter2 Description of samples and populations. 2.1 Introduction. Statistics=science of analyzing data. Information collected (data) is gathered in terms of variables (characteristics of a subject that
STA Rev. F Learning Objectives. Learning Objectives (Cont.) Module 3 Descriptive Measures
 Module 3 Descriptive Measures") STA 2023 Module 3 Descriptive Measures Learning Objectives Upon completing this module, you should be able to: 1. Explain the purpose of a measure of center. 2. Obtain and interpret the mean, median, and
STA 2023 Module 3 Descriptive Measures Learning Objectives Upon completing this module, you should be able to: 1. Explain the purpose of a measure of center. 2. Obtain and interpret the mean, median, and
IT 403 Practice Problems (1-2) Answers
 Answers") IT 403 Practice Problems (1-2) Answers #1. Using Tukey's Hinges method ('Inclusionary'), what is Q3 for this dataset? 2 3 5 7 11 13 17 a. 7 b. 11 c. 12 d. 15 c (12) #2. How do quartiles and percentiles
IT 403 Practice Problems (1-2) Answers #1. Using Tukey's Hinges method ('Inclusionary'), what is Q3 for this dataset? 2 3 5 7 11 13 17 a. 7 b. 11 c. 12 d. 15 c (12) #2. How do quartiles and percentiles
Chapter 3 - Displaying and Summarizing Quantitative Data
 Chapter 3 - Displaying and Summarizing Quantitative Data 3.1 Graphs for Quantitative Data (LABEL GRAPHS) August 25, 2014 Histogram (p. 44) - Graph that uses bars to represent different frequencies or relative
STANDARDS OF LEARNING CONTENT REVIEW NOTES ALGEBRA I. 4 th Nine Weeks,
 STANDARDS OF LEARNING CONTENT REVIEW NOTES ALGEBRA I 4 th Nine Weeks, 2016-2017 1 OVERVIEW Algebra I Content Review Notes are designed by the High School Mathematics Steering Committee as a resource for
The Normal Curve. June 20, Bryan T. Karazsia, M.A.
 The Normal Curve June 20, 2006 Bryan T. Karazsia, M.A. Overview Hand-in Homework Why are distributions so important (particularly the normal distribution)? What is the normal distribution? Z-scores Using
Today s Topics. Percentile ranks and percentiles. Standardized scores. Using standardized scores to estimate percentiles
 Today s Topics Percentile ranks and percentiles Standardized scores Using standardized scores to estimate percentiles Using µ and σ x to learn about percentiles Percentiles, standardized scores, and the
Chapter 1. Looking at Data-Distribution
 Chapter 1. Looking at Data-Distribution Statistics is the scientific discipline that provides methods to draw right conclusions: 1)Collecting the data 2)Describing the data 3)Drawing the conclusions Raw
Univariate Statistics Summary
 Further Maths Univariate Statistics Summary Types of Data Data can be classified as categorical or numerical. Categorical data are observations or records that are arranged according to category. For example: