CHAPTER 2 Modeling Distributions of Data
|
|
|
- Angelina Gray
- 5 years ago
- Views:
Transcription


1 CHAPTER 2 Modeling Distributions of Data 2.2 Density Curves and Normal Distributions The Practice of Statistics, 5th Edition Starnes, Tabor, Yates, Moore Bedford Freeman Worth Publishers
2 Density Curves and Normal Distributions Learning Objectives After this section, you should be able to: FIND the proportion of z-values in a specified interval, or a z-score from a percentile in the standard Normal distribution. FIND the proportion of values in a specified interval, or the value that corresponds to a given percentile in any Normal distribution. DETERMINE whether a distribution of data is approximately Normal from graphical and numerical evidence. The Practice of Statistics, 5 th Edition 2

 with mean µ and standard deviation σ, then the standardized")
3 The Standard Normal Distribution All Normal distributions are the same if we measure in units of size σ from the mean µ as center. The standard Normal distribution is the Normal distribution with mean 0 and standard deviation 1. If a variable x has any Normal distribution N(µ,σ) with mean µ and standard deviation σ, then the standardized variable z = x - m s has the standard Normal distribution, N(0,1). The Practice of Statistics, 5 th Edition 3

 =.7910 Z.00.01.02 0.7.7580.7611.7642 0.8.7881.7910.7939 0.")
4 The Standard Normal Table The standard Normal Table (Table A) is a table of areas under the standard Normal curve. The table entry for each value z is the area under the curve to the left of z. Suppose we want to find the proportion of observations from the standard Normal distribution that are less than 0.81 standard deviations above the mean. We can use Table A: P(z < 0.81) =.7910 Z The Practice of Statistics, 5 th Edition 4
5 Normal Distribution Calculations We can answer a question about areas in any Normal distribution by standardizing and using Table A or by using technology. How To Find Areas In Any Normal Distribution Step 1: State the distribution and the values of interest. Draw a Normal curve with the area of interest shaded and the mean, standard deviation, and boundary value(s) clearly identified. Step 2: Perform calculations show your work! Do one of the following: (i) Compute a z-score for each boundary value and use Table A or technology to find the desired area under the standard Normal curve; or (ii) use the normalcdf command and label each of the inputs. Step 3: Answer the question. The Practice of Statistics, 5 th Edition 5

6 Finding area to the right Suppose we wanted to find the proportion of observations in a Normal distribution that were more than 1.53 standard deviations above the mean. That is, we want to know what proportion of observations in the standard Normal distribution are greater than z = To find this proportion, locate the value 1.5 in the left-hand column of Table A, then locate the remaining digit 3 as.03 in the top row. The corresponding entry is This is the area to the left of z = To find the area above z = 1.53, subtract from 1 to get The Practice of Statistics, 5 th Edition 6

7 Finding areas under the standard Normal curve Problem: Find the proportion of observations from the standard Normal distribution that are between 0.58 and Solution: To find this proportion, we must find the proportion of values that are less than z = 1.79 and then subtract the proportion of values that are less than z = The difference in these proportions is the proportion of observations that are between z = 0.58 and z = The Practice of Statistics, 5 th Edition 7

8 Working Backwards In a standard Normal distribution, 20% of the observations are above what value? Using Table A, we should look up an area of because the table always lists area to the left of a boundary. The closest area to is , which corresponds to a z-score of z = Thus, approximately 20% of the observations in a standard Normal distribution are above z = The Practice of Statistics, 5 th Edition 8
9 Working Backwards: Normal Distribution Calculations Sometimes, we may want to find the observed value that corresponds to a given percentile. There are again three steps. How To Find Values From Areas In Any Normal Distribution Step 1: State the distribution and the values of interest. Draw a Normal curve with the area of interest shaded and the mean, standard deviation, and unknown boundary value clearly identified. Step 2: Perform calculations show your work! Do one of the following: (i) Use Table A or technology to find the value of z with the indicated area under the standard Normal curve, then unstandardize to transform back to the original distribution; or (ii) Use the invnorm command and label each of the inputs. Step 3: Answer the question. The Practice of Statistics, 5 th Edition 9


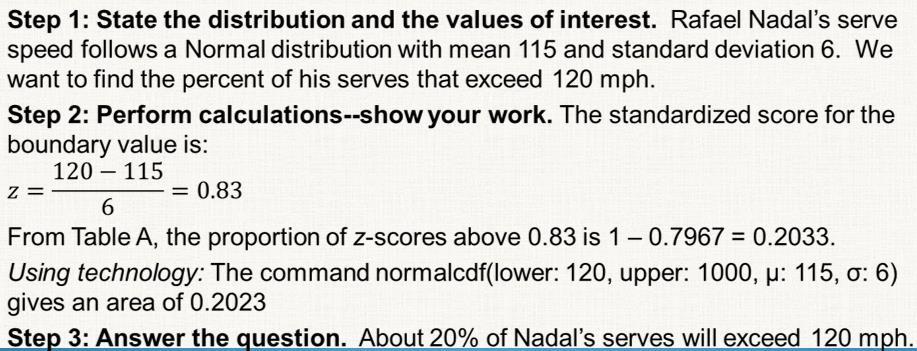
10 Serving speed The Practice of Statistics, 5 th Edition 10


11 Serving speed (continued) Problem: What percent of Rafael Nadal s serves are between 100 and 110 mph? Step 1: State the distribution and the values of interest. Rafael Nadal s serve speed follows a Normal distribution with mean 115 and standard deviation 6. We want to find the percent of his serves that are between 100 and 110 mph. The Practice of Statistics, 5 th Edition 11


12 Heights of three-year-old females The Practice of Statistics, 5 th Edition 12
13 Assessing Normality The Normal distributions provide good models for some distributions of real data. Many statistical inference procedures are based on the assumption that the population is approximately Normally distributed. A Normal probability plot provides a good assessment of whether a data set follows a Normal distribution. Interpreting Normal Probability Plots If the points on a Normal probability plot lie close to a straight line, the plot indicates that the data are Normal. Systematic deviations from a straight line indicate a non-normal distribution. Outliers appear as points that are far away from the overall pattern of the plot. The Practice of Statistics, 5 th Edition 13
 of a sample of 36 side-by-side refrigerators (Consumer Reports, May 2010).")

14 No space in the fridge? The measurements listed below describe the usable capacity (in cubic feet) of a sample of 36 side-by-side refrigerators (Consumer Reports, May 2010).Are the data close to Normal? These percents are quite close to what we would expect based on the rule. Combined with the graph, this gives good evidence that this distribution is close to Normal. The Practice of Statistics, 5 th Edition 14
15 No space in the fridge? (continued) Here is a Normal probability plot (also called a Normal quantile plot) of the refrigerator data from the previous page. It is quite linear, supporting our earlier decision that the distribution is close to Normal. Go to stat plot, and choose the sixth graph. Enter you data list and x for the axis. The Practice of Statistics, 5 th Edition 15
16 Density Curves and Normal Distributions Section Summary In this section, we learned how to ESTIMATE the relative locations of the median and mean on a density curve. ESTIMATE areas (proportions of values) in a Normal distribution. FIND the proportion of z-values in a specified interval, or a z-score from a percentile in the standard Normal distribution. FIND the proportion of values in a specified interval, or the value that corresponds to a given percentile in any Normal distribution. DETERMINE whether a distribution of data is approximately Normal from graphical and numerical evidence. The Practice of Statistics, 5 th Edition 16


17 PAGE , 48, 50, 52, 54 Homework The Practice of Statistics, 5 th Edition 17
CHAPTER 2 Modeling Distributions of Data
 CHAPTER 2 Modeling Distributions of Data 2.2 Density Curves and Normal Distributions The Practice of Statistics, 5th Edition Starnes, Tabor, Yates, Moore Bedford Freeman Worth Publishers HW 34. Sketch
CHAPTER 2 Modeling Distributions of Data
 CHAPTER 2 Modeling Distributions of Data 2.2 Density Curves and Normal Distributions The Practice of Statistics, 5th Edition Starnes, Tabor, Yates, Moore Bedford Freeman Worth Publishers Density Curves
Chapter 2 Modeling Distributions of Data
 Chapter 2 Modeling Distributions of Data Section 2.1 Describing Location in a Distribution Describing Location in a Distribution Learning Objectives After this section, you should be able to: FIND and
Chapter 2: Modeling Distributions of Data
 Chapter 2: Modeling Distributions of Data Section 2.2 The Practice of Statistics, 4 th edition - For AP* STARNES, YATES, MOORE Chapter 2 Modeling Distributions of Data 2.1 Describing Location in a Distribution
Section 2.2 Normal Distributions
 Section 2.2 Mrs. Daniel AP Statistics We abbreviate the Normal distribution with mean µ and standard deviation σ as N(µ,σ). Any particular Normal distribution is completely specified by two numbers: its
Key: 5 9 represents a team with 59 wins. (c) The Kansas City Royals and Cleveland Indians, who both won 65 games.
 The Kansas City Royals and Cleveland Indians, who both won 65 games.") AP statistics Chapter 2 Notes Name Modeling Distributions of Data Per Date 2.1A Distribution of a variable is the a variable takes and it takes that value. When working with quantitative data we can calculate
AP statistics Chapter 2 Notes Name Modeling Distributions of Data Per Date 2.1A Distribution of a variable is the a variable takes and it takes that value. When working with quantitative data we can calculate
Unit 5: Estimating with Confidence
 Unit 5: Estimating with Confidence Section 8.3 The Practice of Statistics, 4 th edition For AP* STARNES, YATES, MOORE Unit 5 Estimating with Confidence 8.1 8.2 8.3 Confidence Intervals: The Basics Estimating
Normal Distribution. 6.4 Applications of Normal Distribution
 Normal Distribution 6.4 Applications of Normal Distribution 1 /20 Homework Read Sec 6-4. Discussion question p316 Do p316 probs 1-10, 16-22, 31, 32, 34-37, 39 2 /20 3 /20 Objective Find the probabilities
Introduction to the Practice of Statistics Fifth Edition Moore, McCabe
 Introduction to the Practice of Statistics Fifth Edition Moore, McCabe Section 1.3 Homework Answers Assignment 5 1.80 If you ask a computer to generate "random numbers between 0 and 1, you uniform will
Section 2.2 Normal Distributions. Normal Distributions
 Section 2.2 Normal Distributions Normal Distributions One particularly important class of density curves are the Normal curves, which describe Normal distributions. All Normal curves are symmetric, single-peaked,
Data Analysis & Probability
 Unit 5 Probability Distributions Name: Date: Hour: Section 7.2: The Standard Normal Distribution (Area under the curve) Notes By the end of this lesson, you will be able to Find the area under the standard
Chapter 6. THE NORMAL DISTRIBUTION
 Chapter 6. THE NORMAL DISTRIBUTION Introducing Normally Distributed Variables The distributions of some variables like thickness of the eggshell, serum cholesterol concentration in blood, white blood cells
So..to be able to make comparisons possible, we need to compare them with their respective distributions.
 Unit 3 ~ Modeling Distributions of Data 1 ***Section 2.1*** Measures of Relative Standing and Density Curves (ex) Suppose that a professional soccer team has the money to sign one additional player and
Chapter 6. THE NORMAL DISTRIBUTION
 Chapter 6. THE NORMAL DISTRIBUTION Introducing Normally Distributed Variables The distributions of some variables like thickness of the eggshell, serum cholesterol concentration in blood, white blood cells
CHAPTER 2: Describing Location in a Distribution
 CHAPTER 2: Describing Location in a Distribution 2.1 Goals: 1. Compute and use z-scores given the mean and sd 2. Compute and use the p th percentile of an observation 3. Intro to density curves 4. More
7.2. The Standard Normal Distribution
 7.2 The Standard Normal Distribution Standard Normal The standard normal curve is the one with mean μ = 0 and standard deviation σ = 1 We have related the general normal random variable to the standard
Chapter 2: The Normal Distribution
 Chapter 2: The Normal Distribution 2.1 Density Curves and the Normal Distributions 2.2 Standard Normal Calculations 1 2 Histogram for Strength of Yarn Bobbins 15.60 16.10 16.60 17.10 17.60 18.10 18.60
IT 403 Practice Problems (1-2) Answers
 Answers") IT 403 Practice Problems (1-2) Answers #1. Using Tukey's Hinges method ('Inclusionary'), what is Q3 for this dataset? 2 3 5 7 11 13 17 a. 7 b. 11 c. 12 d. 15 c (12) #2. How do quartiles and percentiles
IT 403 Practice Problems (1-2) Answers #1. Using Tukey's Hinges method ('Inclusionary'), what is Q3 for this dataset? 2 3 5 7 11 13 17 a. 7 b. 11 c. 12 d. 15 c (12) #2. How do quartiles and percentiles
STA Module 4 The Normal Distribution
 STA 2023 Module 4 The Normal Distribution Learning Objectives Upon completing this module, you should be able to 1. Explain what it means for a variable to be normally distributed or approximately normally
STA /25/12. Module 4 The Normal Distribution. Learning Objectives. Let s Look at Some Examples of Normal Curves
 STA 2023 Module 4 The Normal Distribution Learning Objectives Upon completing this module, you should be able to 1. Explain what it means for a variable to be normally distributed or approximately normally
Chapter 5: The standard deviation as a ruler and the normal model p131
 Chapter 5: The standard deviation as a ruler and the normal model p131 Which is the better exam score? 67 on an exam with mean 50 and SD 10 62 on an exam with mean 40 and SD 12? Is it fair to say: 67 is
Lecture 6: Chapter 6 Summary
 1 Lecture 6: Chapter 6 Summary Z-score: Is the distance of each data value from the mean in standard deviation Standardizes data values Standardization changes the mean and the standard deviation: o Z
Lecture 3 Questions that we should be able to answer by the end of this lecture:
 Lecture 3 Questions that we should be able to answer by the end of this lecture: Which is the better exam score? 67 on an exam with mean 50 and SD 10 or 62 on an exam with mean 40 and SD 12 Is it fair
Chapter 2: Statistical Models for Distributions
 Chapter 2: Statistical Models for Distributions 2.2 Normal Distributions In Chapter 2 of YMS, we learn that distributions of data can be approximated by a mathematical model known as a density curve. In
Lecture 3 Questions that we should be able to answer by the end of this lecture:
 Lecture 3 Questions that we should be able to answer by the end of this lecture: Which is the better exam score? 67 on an exam with mean 50 and SD 10 or 62 on an exam with mean 40 and SD 12 Is it fair
The Normal Distribution
 The Normal Distribution Lecture 20 Section 6.3.1 Robb T. Koether Hampden-Sydney College Wed, Sep 28, 2011 Robb T. Koether (Hampden-Sydney College) The Normal Distribution Wed, Sep 28, 2011 1 / 41 Outline
MAT 102 Introduction to Statistics Chapter 6. Chapter 6 Continuous Probability Distributions and the Normal Distribution
 MAT 102 Introduction to Statistics Chapter 6 Chapter 6 Continuous Probability Distributions and the Normal Distribution 6.2 Continuous Probability Distributions Characteristics of a Continuous Probability
Chapter 5snow year.notebook March 15, 2018
 Chapter 5: Statistical Reasoning Section 5.1 Exploring Data Measures of central tendency (Mean, Median and Mode) attempt to describe a set of data by identifying the central position within a set of data
Stat 528 (Autumn 2008) Density Curves and the Normal Distribution. Measures of center and spread. Features of the normal distribution
 Density Curves and the Normal Distribution. Measures of center and spread. Features of the normal distribution") Stat 528 (Autumn 2008) Density Curves and the Normal Distribution Reading: Section 1.3 Density curves An example: GRE scores Measures of center and spread The normal distribution Features of the normal
Stat 528 (Autumn 2008) Density Curves and the Normal Distribution Reading: Section 1.3 Density curves An example: GRE scores Measures of center and spread The normal distribution Features of the normal
Learning Objectives. Continuous Random Variables & The Normal Probability Distribution. Continuous Random Variable
 Learning Objectives Continuous Random Variables & The Normal Probability Distribution 1. Understand characteristics about continuous random variables and probability distributions 2. Understand the uniform
Probability Distributions
 Unit 5 Probability Distributions Section 7.3A: Applications of the Normal Distribution Notes By the end of this lesson, you will be able to Find and interpret the area under a normal curve Find the value
Unit 7 Statistics. AFM Mrs. Valentine. 7.1 Samples and Surveys
 Unit 7 Statistics AFM Mrs. Valentine 7.1 Samples and Surveys v Obj.: I will understand the different methods of sampling and studying data. I will be able to determine the type used in an example, and
Name: Date: Period: Chapter 2. Section 1: Describing Location in a Distribution
 Name: Date: Period: Chapter 2 Section 1: Describing Location in a Distribution Suppose you earned an 86 on a statistics quiz. The question is: should you be satisfied with this score? What if it is the
6-1 THE STANDARD NORMAL DISTRIBUTION
 6-1 THE STANDARD NORMAL DISTRIBUTION The major focus of this chapter is the concept of a normal probability distribution, but we begin with a uniform distribution so that we can see the following two very
Sections 4.3 and 4.4
 Sections 4.3 and 4.4 Timothy Hanson Department of Statistics, University of South Carolina Stat 205: Elementary Statistics for the Biological and Life Sciences 1 / 32 4.3 Areas under normal densities Every
Density Curve (p52) Density curve is a curve that - is always on or above the horizontal axis.
 Density curve is a curve that - is always on or above the horizontal axis.") 1.3 Density curves p50 Some times the overall pattern of a large number of observations is so regular that we can describe it by a smooth curve. It is easier to work with a smooth curve, because the histogram
1.3 Density curves p50 Some times the overall pattern of a large number of observations is so regular that we can describe it by a smooth curve. It is easier to work with a smooth curve, because the histogram
appstats6.notebook September 27, 2016
 Chapter 6 The Standard Deviation as a Ruler and the Normal Model Objectives: 1.Students will calculate and interpret z scores. 2.Students will compare/contrast values from different distributions using
Chapter 2: The Normal Distributions
 Chapter 2: The Normal Distributions Measures of Relative Standing & Density Curves Z-scores (Measures of Relative Standing) Suppose there is one spot left in the University of Michigan class of 2014 and
Chapter 6 Normal Probability Distributions
 Chapter 6 Normal Probability Distributions 6-1 Review and Preview 6-2 The Standard Normal Distribution 6-3 Applications of Normal Distributions 6-4 Sampling Distributions and Estimators 6-5 The Central
Lecture 21 Section Fri, Oct 3, 2008
 Lecture 21 Section 6.3.1 Hampden-Sydney College Fri, Oct 3, 2008 Outline 1 2 3 4 5 6 Exercise 6.15, page 378. A young woman needs a 15-ampere fuse for the electrical system in her apartment and has decided
Ch6: The Normal Distribution
 Ch6: The Normal Distribution Introduction Review: A continuous random variable can assume any value between two endpoints. Many continuous random variables have an approximately normal distribution, which
The Normal Distribution
 Chapter 6 The Normal Distribution Continuous random variables are used to approximate probabilities where there are many possibilities or an infinite number of possibilities on a given trial. One of the
Chapter 3: Data Description - Part 3. Homework: Exercises 1-21 odd, odd, odd, 107, 109, 118, 119, 120, odd
 Chapter 3: Data Description - Part 3 Read: Sections 1 through 5 pp 92-149 Work the following text examples: Section 3.2, 3-1 through 3-17 Section 3.3, 3-22 through 3.28, 3-42 through 3.82 Section 3.4,
Chapter 6: DESCRIPTIVE STATISTICS
 Chapter 6: DESCRIPTIVE STATISTICS Random Sampling Numerical Summaries Stem-n-Leaf plots Histograms, and Box plots Time Sequence Plots Normal Probability Plots Sections 6-1 to 6-5, and 6-7 Random Sampling
Chapter 6. The Normal Distribution. McGraw-Hill, Bluman, 7 th ed., Chapter 6 1
 Chapter 6 The Normal Distribution McGraw-Hill, Bluman, 7 th ed., Chapter 6 1 Bluman, Chapter 6 2 Chapter 6 Overview Introduction 6-1 Normal Distributions 6-2 Applications of the Normal Distribution 6-3
Unit 8: Normal Calculations
 Unit 8: Normal Calculations Prerequisites This unit requires familiarity with basic facts about normal distributions, which are covered in Unit 7, Normal Curves. In addition, students need some background
Lecture Slides. Elementary Statistics Twelfth Edition. by Mario F. Triola. and the Triola Statistics Series. Section 6.2-1
 Lecture Slides Elementary Statistics Twelfth Edition and the Triola Statistics Series by Mario F. Triola Section 6.2-1 Chapter 6 Normal Probability Distributions 6-1 Review and Preview 6-2 The Standard
The first few questions on this worksheet will deal with measures of central tendency. These data types tell us where the center of the data set lies.
 Instructions: You are given the following data below these instructions. Your client (Courtney) wants you to statistically analyze the data to help her reach conclusions about how well she is teaching.
Confidence Intervals. Dennis Sun Data 301
 Dennis Sun Data 301 Statistical Inference probability Population / Box Sample / Data statistics The goal of statistics is to infer the unknown population from the sample. We ve already seen one mode of
BIOL Gradation of a histogram (a) into the normal curve (b)
 into the normal curve (b)") (التوزيع الطبيعي ( Distribution Normal (Gaussian) One of the most important distributions in statistics is a continuous distribution called the normal distribution or Gaussian distribution. Consider the
(التوزيع الطبيعي ( Distribution Normal (Gaussian) One of the most important distributions in statistics is a continuous distribution called the normal distribution or Gaussian distribution. Consider the
1. The Normal Distribution, continued
 Math 1125-Introductory Statistics Lecture 16 10/9/06 1. The Normal Distribution, continued Recall that the standard normal distribution is symmetric about z = 0, so the area to the right of zero is 0.5000.
DAY 52 BOX-AND-WHISKER
 DAY 52 BOX-AND-WHISKER VOCABULARY The Median is the middle number of a set of data when the numbers are arranged in numerical order. The Range of a set of data is the difference between the highest and
Measures of Position
 Measures of Position In this section, we will learn to use fractiles. Fractiles are numbers that partition, or divide, an ordered data set into equal parts (each part has the same number of data entries).
MAT 110 WORKSHOP. Updated Fall 2018
 MAT 110 WORKSHOP Updated Fall 2018 UNIT 3: STATISTICS Introduction Choosing a Sample Simple Random Sample: a set of individuals from the population chosen in a way that every individual has an equal chance
Chapter 1. Looking at Data-Distribution
 Chapter 1. Looking at Data-Distribution Statistics is the scientific discipline that provides methods to draw right conclusions: 1)Collecting the data 2)Describing the data 3)Drawing the conclusions Raw
The Normal Distribution & z-scores
 & z-scores Distributions: Who needs them? Why are we interested in distributions? Important link between distributions and probabilities of events If we know the distribution of a set of events, then we
The Normal Distribution & z-scores
 & z-scores Distributions: Who needs them? Why are we interested in distributions? Important link between distributions and probabilities of events If we know the distribution of a set of events, then we
Chapter 2. Frequency distribution. Summarizing and Graphing Data
 Frequency distribution Chapter 2 Summarizing and Graphing Data Shows how data are partitioned among several categories (or classes) by listing the categories along with the number (frequency) of data values
Econ 3790: Business and Economics Statistics. Instructor: Yogesh Uppal
 Econ 3790: Business and Economics Statistics Instructor: Yogesh Uppal Email: yuppal@ysu.edu Chapter 8: Interval Estimation Population Mean: Known Population Mean: Unknown Margin of Error and the Interval
Example 1. Find the x value that has a left tail area of.1131 P ( x <??? ) =. 1131
 =. 1131") Section 6 4D: Finding a Value of x with a Given tail arae Label the shaded area for both graphs. Find the value for z and label the z axis. Find the value for x for the given area under the normal curve
Section 6 4D: Finding a Value of x with a Given tail arae Label the shaded area for both graphs. Find the value for z and label the z axis. Find the value for x for the given area under the normal curve
Vocabulary. 5-number summary Rule. Area principle. Bar chart. Boxplot. Categorical data condition. Categorical variable.
 5-number summary 68-95-99.7 Rule Area principle Bar chart Bimodal Boxplot Case Categorical data Categorical variable Center Changing center and spread Conditional distribution Context Contingency table
3.5 Applying the Normal Distribution: Z-Scores
 3.5 Applying the Normal Distribution: Z-Scores In the previous section, you learned about the normal curve and the normal distribution. You know that the area under any normal curve is 1, and that 68%
Prepare a stem-and-leaf graph for the following data. In your final display, you should arrange the leaves for each stem in increasing order.
 Chapter 2 2.1 Descriptive Statistics A stem-and-leaf graph, also called a stemplot, allows for a nice overview of quantitative data without losing information on individual observations. It can be a good
Section 7.2: Applications of the Normal Distribution
 Section 7.2: Applications of the Normal Distribution Objectives By the end of this lesson, you will be able to... 1. find and interpret the area under a normal curve 2. find the value of a normal random
Distributions of random variables
 Chapter 3 Distributions of random variables 31 Normal distribution Among all the distributions we see in practice, one is overwhelmingly the most common The symmetric, unimodal, bell curve is ubiquitous
2.1: Frequency Distributions and Their Graphs
 2.1: Frequency Distributions and Their Graphs Frequency Distribution - way to display data that has many entries - table that shows classes or intervals of data entries and the number of entries in each
3.5 Applying the Normal Distribution: Z - Scores
 3.5 Applying the Normal Distribution: Z - Scores Objective: Today s lesson will answer the following questions: 1. How can you use the normal curve to accurately determine the percent of data that lies
Statistics Lecture 6. Looking at data one variable
 Statistics 111 - Lecture 6 Looking at data one variable Chapter 1.1 Moore, McCabe and Craig Probability vs. Statistics Probability 1. We know the distribution of the random variable (Normal, Binomial)
AP Statistics. Study Guide
 Measuring Relative Standing Standardized Values and z-scores AP Statistics Percentiles Rank the data lowest to highest. Counting up from the lowest value to the select data point we discover the percentile
Normal Data ID1050 Quantitative & Qualitative Reasoning
 Normal Data ID1050 Quantitative & Qualitative Reasoning Histogram for Different Sample Sizes For a small sample, the choice of class (group) size dramatically affects how the histogram appears. Say we
The Normal Distribution & z-scores
 & z-scores Distributions: Who needs them? Why are we interested in distributions? Important link between distributions and probabilities of events If we know the distribution of a set of events, then we
Let s go through some examples of applying the normal distribution in practice.
 Let s go through some examples of applying the normal distribution in practice. 1 We will work with gestation period of domestic cats. Suppose that the length of pregnancy in cats (which we will denote
Using Large Data Sets Workbook Version A (MEI)
") Using Large Data Sets Workbook Version A (MEI) 1 Index Key Skills Page 3 Becoming familiar with the dataset Page 3 Sorting and filtering the dataset Page 4 Producing a table of summary statistics with
Using Large Data Sets Workbook Version A (MEI) 1 Index Key Skills Page 3 Becoming familiar with the dataset Page 3 Sorting and filtering the dataset Page 4 Producing a table of summary statistics with
Part I, Chapters 4 & 5. Data Tables and Data Analysis Statistics and Figures
 Part I, Chapters 4 & 5 Data Tables and Data Analysis Statistics and Figures Descriptive Statistics 1 Are data points clumped? (order variable / exp. variable) Concentrated around one value? Concentrated
STA Rev. F Learning Objectives. Learning Objectives (Cont.) Module 3 Descriptive Measures
 Module 3 Descriptive Measures") STA 2023 Module 3 Descriptive Measures Learning Objectives Upon completing this module, you should be able to: 1. Explain the purpose of a measure of center. 2. Obtain and interpret the mean, median, and
STA 2023 Module 3 Descriptive Measures Learning Objectives Upon completing this module, you should be able to: 1. Explain the purpose of a measure of center. 2. Obtain and interpret the mean, median, and
Today s Topics. Percentile ranks and percentiles. Standardized scores. Using standardized scores to estimate percentiles
 Today s Topics Percentile ranks and percentiles Standardized scores Using standardized scores to estimate percentiles Using µ and σ x to learn about percentiles Percentiles, standardized scores, and the
15 Wyner Statistics Fall 2013
 15 Wyner Statistics Fall 2013 CHAPTER THREE: CENTRAL TENDENCY AND VARIATION Summary, Terms, and Objectives The two most important aspects of a numerical data set are its central tendencies and its variation.
How individual data points are positioned within a data set.
 Section 3.4 Measures of Position Percentiles How individual data points are positioned within a data set. P k is the value such that k% of a data set is less than or equal to P k. For example if we said
TI-83 Users Guide. to accompany. Statistics: Unlocking the Power of Data by Lock, Lock, Lock, Lock, and Lock
 TI-83 Users Guide to accompany by Lock, Lock, Lock, Lock, and Lock TI-83 Users Guide- 1 Getting Started Entering Data Use the STAT menu, then select EDIT and hit Enter. Enter data for a single variable
Chapter 3. Bootstrap. 3.1 Introduction. 3.2 The general idea
 Chapter 3 Bootstrap 3.1 Introduction The estimation of parameters in probability distributions is a basic problem in statistics that one tends to encounter already during the very first course on the subject.
Continuous Improvement Toolkit. Normal Distribution. Continuous Improvement Toolkit.
 Continuous Improvement Toolkit Normal Distribution The Continuous Improvement Map Managing Risk FMEA Understanding Performance** Check Sheets Data Collection PDPC RAID Log* Risk Analysis* Benchmarking***
Measures of Central Tendency
 Page of 6 Measures of Central Tendency A measure of central tendency is a value used to represent the typical or average value in a data set. The Mean The sum of all data values divided by the number of
LAB 1 INSTRUCTIONS DESCRIBING AND DISPLAYING DATA
 LAB 1 INSTRUCTIONS DESCRIBING AND DISPLAYING DATA This lab will assist you in learning how to summarize and display categorical and quantitative data in StatCrunch. In particular, you will learn how to
Statistics I Practice 2 Notes Probability and probabilistic models; Introduction of the statistical inference
 Statistics I Practice 2 Notes Probability and probabilistic models; Introduction of the statistical inference 1. Simulation of random variables In Excel we can simulate values from random variables (discrete
MEASURES OF CENTRAL TENDENCY
 11.1 Find Measures of Central Tendency and Dispersion STATISTICS Numerical values used to summarize and compare sets of data MEASURE OF CENTRAL TENDENCY A number used to represent the center or middle
STANDARDS OF LEARNING CONTENT REVIEW NOTES ALGEBRA I. 4 th Nine Weeks,
 STANDARDS OF LEARNING CONTENT REVIEW NOTES ALGEBRA I 4 th Nine Weeks, 2016-2017 1 OVERVIEW Algebra I Content Review Notes are designed by the High School Mathematics Steering Committee as a resource for
CHAPTER 1. Introduction. Statistics: Statistics is the science of collecting, organizing, analyzing, presenting and interpreting data.
 1 CHAPTER 1 Introduction Statistics: Statistics is the science of collecting, organizing, analyzing, presenting and interpreting data. Variable: Any characteristic of a person or thing that can be expressed
Chapter 3 - Displaying and Summarizing Quantitative Data
 Chapter 3 - Displaying and Summarizing Quantitative Data 3.1 Graphs for Quantitative Data (LABEL GRAPHS) August 25, 2014 Histogram (p. 44) - Graph that uses bars to represent different frequencies or relative
CHAPTER 2: SAMPLING AND DATA
 CHAPTER 2: SAMPLING AND DATA This presentation is based on material and graphs from Open Stax and is copyrighted by Open Stax and Georgia Highlands College. OUTLINE 2.1 Stem-and-Leaf Graphs (Stemplots),
Sec 6.3. Bluman, Chapter 6 1
 Sec 6.3 Bluman, Chapter 6 1 Bluman, Chapter 6 2 Review: Find the z values; the graph is symmetrical. z = ±1. 96 z 0 z the total area of the shaded regions=5% Bluman, Chapter 6 3 Review: Find the z values;
QQ normality plots Harvey Motulsky, GraphPad Software Inc. July 2013
 QQ normality plots Harvey Motulsky, GraphPad Software Inc. July 213 Introduction Many statistical tests assume that data (or residuals) are sampled from a Gaussian distribution. Normality tests are often
MAT 142 College Mathematics. Module ST. Statistics. Terri Miller revised July 14, 2015
 MAT 142 College Mathematics Statistics Module ST Terri Miller revised July 14, 2015 2 Statistics Data Organization and Visualization Basic Terms. A population is the set of all objects under study, a sample
CHAPTER 2 DESCRIPTIVE STATISTICS
 CHAPTER 2 DESCRIPTIVE STATISTICS 1. Stem-and-Leaf Graphs, Line Graphs, and Bar Graphs The distribution of data is how the data is spread or distributed over the range of the data values. This is one of
a. divided by the. 1) Always round!! a) Even if class width comes out to a, go up one.
 Always round!! a) Even if class width comes out to a, go up one.") Probability and Statistics Chapter 2 Notes I Section 2-1 A Steps to Constructing Frequency Distributions 1 Determine number of (may be given to you) a Should be between and classes 2 Find the Range a The
Probability and Statistics Chapter 2 Notes I Section 2-1 A Steps to Constructing Frequency Distributions 1 Determine number of (may be given to you) a Should be between and classes 2 Find the Range a The
Probability and Statistics. Copyright Cengage Learning. All rights reserved.
 Probability and Statistics Copyright Cengage Learning. All rights reserved. 14.6 Descriptive Statistics (Graphical) Copyright Cengage Learning. All rights reserved. Objectives Data in Categories Histograms
Chapter 6 The Standard Deviation as Ruler and the Normal Model
 ST 305 Chapter 6 Reiland The Standard Deviation as Ruler and the Normal Model Chapter Objectives: At the end of this chapter you should be able to: 1) describe how adding or subtracting the same value
IQR = number. summary: largest. = 2. Upper half: Q3 =
 Step by step box plot Height in centimeters of players on the 003 Women s Worldd Cup soccer team. 157 1611 163 163 164 165 165 165 168 168 168 170 170 170 171 173 173 175 180 180 Determine the 5 number
Math 120 Introduction to Statistics Mr. Toner s Lecture Notes 3.1 Measures of Central Tendency
 Math 1 Introduction to Statistics Mr. Toner s Lecture Notes 3.1 Measures of Central Tendency lowest value + highest value midrange The word average: is very ambiguous and can actually refer to the mean,
Using Excel for Graphical Analysis of Data
 Using Excel for Graphical Analysis of Data Introduction In several upcoming labs, a primary goal will be to determine the mathematical relationship between two variable physical parameters. Graphs are
Written by Donna Hiestand-Tupper CCBC - Essex TI 83 TUTORIAL. Version 3.0 to accompany Elementary Statistics by Mario Triola, 9 th edition
 TI 83 TUTORIAL Version 3.0 to accompany Elementary Statistics by Mario Triola, 9 th edition Written by Donna Hiestand-Tupper CCBC - Essex 1 2 Math 153 - Introduction to Statistical Methods TI 83 (PLUS)