Uttam Kumar and Ramachandra T.V. Energy & Wetlands Research Group, Centre for Ecological Sciences, Indian Institute of Science, Bangalore
|
|
|
- Adam Hopkins
- 5 years ago
- Views:
Transcription
1 Remote Sensing and GIS for Monitoring Urban Dynamics Uttam Kumar and Ramachandra T.V. Energy & Wetlands Research Group, Centre for Ecological Sciences, Indian Institute of Science, Bangalore

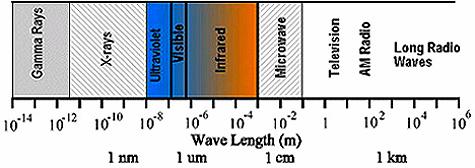
2 Remote Sensing is a widely used technology for providing surface information in the form of image data. These images of the earth s surface are acquired by space borne sensors in different spatial, spectral, temporal and radiometric resolutions. Introduction

3 What is Remote Sensing?

4 Remote Sensing Processes Atmosphere Sensor System Onboard calibration And Preprocessing Data to earth station Preprocessing -Radiometric -Geometric Information Extraction Distribution & use of information Incorporation of ancillary data
5

6 Spectra of Surface Materials Bare soil Reflectance Water Vegetation Wavelength
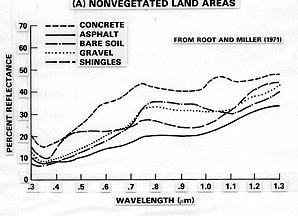
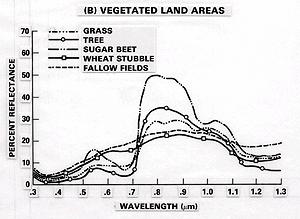
7 Reflectance from various materials


8 Cartosat-1 Chandigarh Manasarovar Lake IRS P6 Kuwait LISS-IV IRS-P6 South India and Sri Lanka AWIFS Source: NRSA, Hyderabad
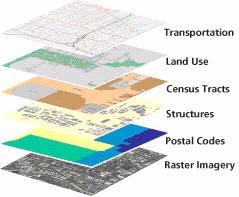
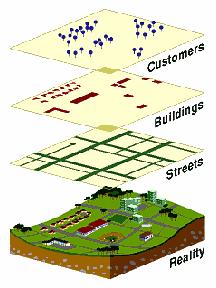
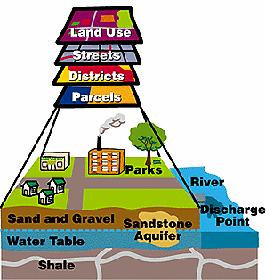
9 GIS Remote sensing data when integrated with Geographic Information and other attribute data (such as data obtained from ground, other measurements and observations) can yield better results in terms of interpretability and easier understanding.
10 GIS A geographic information System (GIS) is a system for capturing, storing, analyzing and managing data and associated attributes which are spatially referenced to the earth. It is a computer system capable of integrating, storing, editing, analyzing, sharing, and displaying geographically- referenced information.
11 1. Cartographic Irrigation Land evaluation Crop Analysis Air Quality Traffic patterns Planning and facilities management 2. Digital Terrain Modeling Earth science resources Civil Engineering & Military Evaluation Soil Surveys Pollution Studies Flood Control 3. Geographic objects Car navigation systems Utility distribution and consumption Consumer product and services

12 Digital Numbers Raster Data
13 Vector data Types: Basic Shapes, Multi- Shapes, Derived Shapes, Alternate Shapes, Any possible Shape, User- Defined Shapes Basic Shapes Alternate Shapes Multi-Shapes Any Possible Shape N 0, N * Derived Shapes User Defined Shape!

14 Lines Polygons

15
16 Land cover and Land use Land cover refers to what is actually present on the ground. It provides the ground cover information for baseline thematic maps. Land use refers to the various applications and the context of its use. Land use itself is the human employment of a land-cover type. Thematic spatial outputs aid planners and policy makers to take holistic decisions.
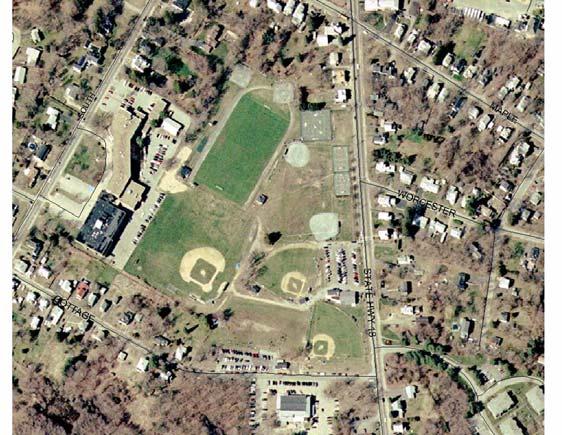
17 Study Area Kolar District, Karnataka state, India Area sq. km. Location to E to N
18 Data Used 1. LISS-3 MSS (23.5 m) 2. MODIS data a) MODIS Bands 1 to 7 - MOD 09 Surface Reflectance 8-day L3 global (Spatial resolution - Band 1 and m, Band 3 to m) b) MODIS Bands 1 to 36 - MOD 02 Level-1B Calibrated Geolocation Data Set (Spatial resolution - 1 km) 3. The main sources of primary data were from field (using GPS), the Survey of India (SOI) topographic maps of 1:50,000, 1:250,000 scale. 4. The secondary data were collected from the Government agencies (Directorate of census, Agriculture department and Forest department) etc.
19 Data Used Satellite/ Sensor Resolution Swath IRS 1C LISS 3 IRS 1D LISS m (visible and near IR region) 70.5 m (shortwave IR region) 141 km (visible and near IR region) 148 km (shortwave IR region) 23.5 m Repetitivity 24 days 25 days Spectral Bands Primary Application microns (B2) microns (B3) microns (B4) microns (B5) 127 km (bands 2, 3, 4) 134 km (band 5 MIR) microns (B2) microns (B3) microns (B4) microns (B5) These data have a diverse range of applications such as land use and land cover mapping, urban planning, biodiversity characterisation, forest survey, wetland mapping, environmental impact, crop acreage and production estimation of major crops, drought monitoring and assessment based on vegetation condition, snowmelt run-off estimation, mineral prospecting, coastal studies and so on. Band Number Spectral Range Bands 1 19 nm Bands µm Spatial Resolution Primary Application 250 m Land / Cloud / Aerosols Boundaries 500 m Land / Cloud / Aerosols Properties 1000 m Ocean Colour / Phytoplankton Biochemistry 1000 m Atmospheric Water Vapour 1000 m Surface / Cloud Temperature 1000 m Atmospheric Temperature 1000 m Cirrus Clouds Water Vapour m Cloud Properties m Ozone m Surface / Cloud Temperature 1000 m Cloud Top Altitude
20 LISS-3 3 classification IRS 1C/1D LISS-3 MSS (23.5 m) Georeferencing / Geo-correction FCC Generation Classification Ground Truth Unsupervised Classification Supervised Classification High resolution Classified Map

21 Land Cover Analysis using NDVI Vegetation Non-vegetation % % (LISS-3)
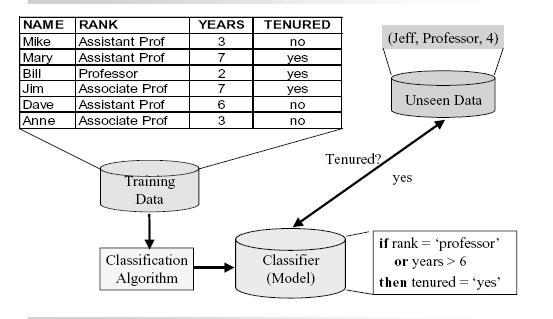
22 Supervised Classification
23 Unsupervised Classification (Clustering) Types of Clustering Algorithms K- Means Density Based (DBSCAN) Balance Iterative reducing and Clustering using Hierarchies (BIRCH) K- Mediod Grid Based Model based
24 Comparison of classes and clusters Class 1 Cluster 1 Cluster 2 A A A A A A A A A A A A A A A A B B A x 2 One possible cluster assignment B B B B B B B B BBB B A A B B A A B B B Another possible cluster assignment A A B B Class 2 Cluster 4 cluster 3 x 1
25 Evaluation of Accuracy of Classifiers

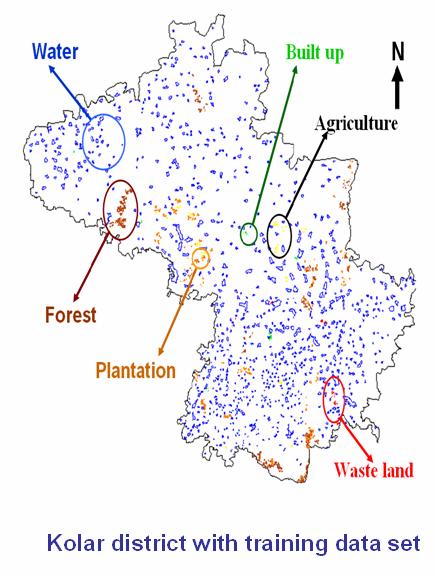
26 FCC and Training data


27 Overall Accuracy of LISS-3 MSS Supervised Classified map %

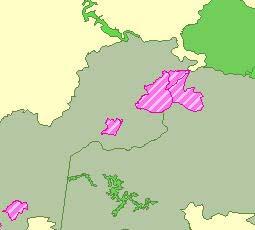
28 Landuse classification of Kolar district Year 1998 Year 2002 N N Built up Built up
29 Landuse details of Kolar district Categories Area (in ha) Area (%) Area (in ha) Area (%) Agriculture Built up Forest Plantation Waste land Categories Non vegetation Vegetation

30 Classified MSS and PAN fused image 1998 Chikballapur taluk 2002 N
31 Types of Classification Algorithms Maximum likelihood classification Neural network Genetic algorithms Decision tree K-nearest neighbor Bayesian classification Support vector machines
32 MODIS preprocessing MODIS Data B1, B2 250m B3 -B7 500m B1-B36 1Km Reprojection of all MODIS Bands Georeferencing of all MODIS Bands Georeferenced MODIS Band 1and 2 Georeferenced MODIS Bands B3 to B7 (500m) B1 to B36 (1 Km) Resampling to 250m INPUT B1, B2, B3, B4, B5, B6 and B7 (all 250m) B1 to B36 (all 250m) Hard Classification Soft Classification
33 Classification of MODIS data INPUT I MODIS Bands 1 to 7 (MOD 09 Surface Reflectance Product) MODIS Bands 1 to 36 (MOD 02 Level-1B Product) Principal Component Analysis (PCA) Minimum Noise Fraction (MNF) INPUT II PC of MODIS INPUT - III MNFComponents of MODIS C L A S S I F I C A T I O N A L G O R I T H M S
34 PCA and MNF Output PC Eigenvalue PCA MNF Components Eigenvalue MNF
35 Classification of MODIS data Hard Classification B1,B2,B3,B4,B5,B6,B7 PCA (B 1 to Band 36) Selection of appropriate Bands MNF (B1 to B36) Selection of appropriate Bands NDVI (B1, B2) K-Means Clustering Maximum Likelihood Classification (M LC) Spectral Angle Mapper (SAM) Neural Network (NN) Decision Tree Approach (DTA)

36 Land Cover Analysis using NDVI Vegetation Non-vegetation % % (MODIS)


37 Maximum Likelihood Neural Network K-Means Clustering Decision Tree
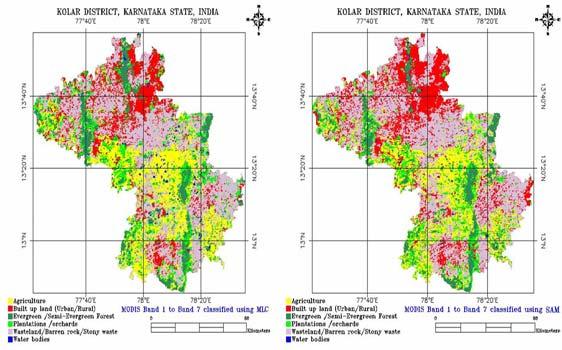
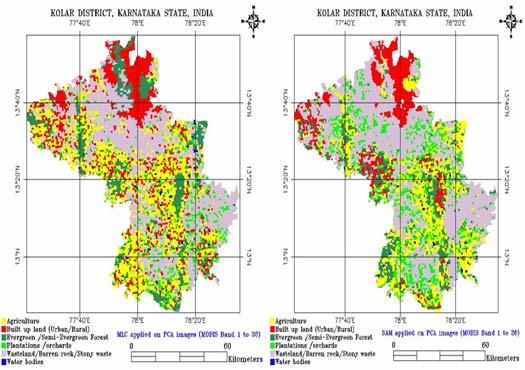
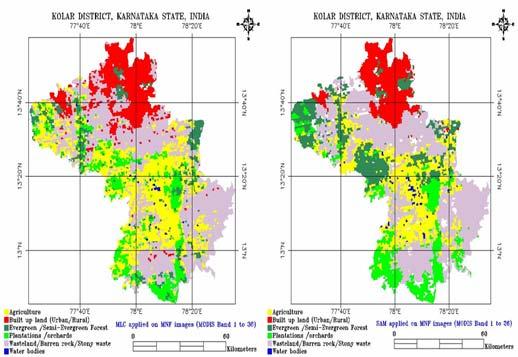
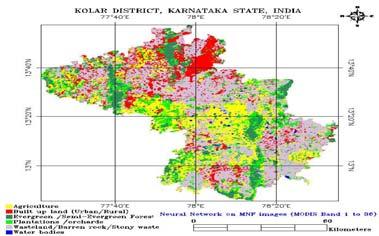
38 MODIS classified maps
39 Accuracy Assessment Using Error matrix Algorithms Overall Accuracy NN (MNF) MLC (B1 to B7) DTA (MNF) DTA (B1 to B7) NN (PCA) DTA (PCA) SAM (B1 to B7) NN (B1 to B7) K-Means (B1 to B7) SAM (MNF) MLC (MNF) SAM (PCA) MLC (PCA) 30.44
40 Discussions 1. Hard classification technique performs well with high spatial resolution (LISS-3) with the use of training sites and ancillary data having minimum difference between the date of acquisition and date of ground truth. 2. MODIS classified image with coarse spatial resolution had many misclassified pixels. 3. Further, within the land cover parameter, errors were generated when the classification algorithm selected the wrong class. The errors (errors of omission & errors of commission) occured when the signal of a pixel is ambiguous, as a result of spectral mixing, or when the signal is produced by a cover type is not accounted for in the training process. 4. As the pixel size increases, the chances of high accuracies in hard classifications being product of random assignment of values declined.
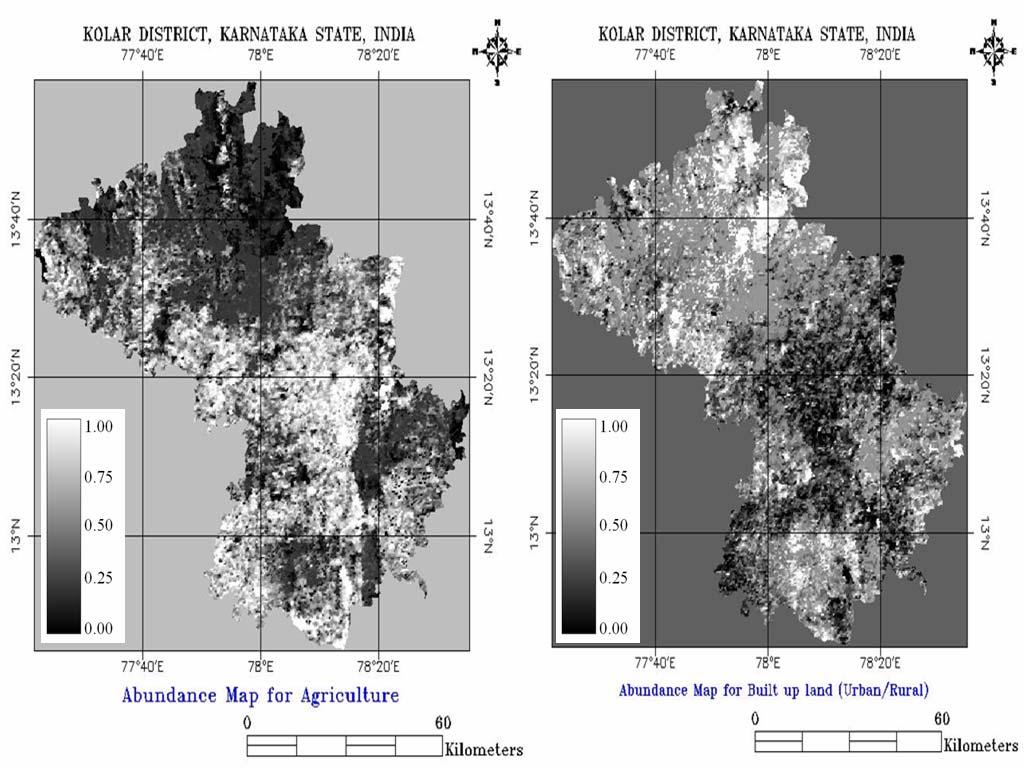
41 Linear Unmixing Natural surfaces are rarely composed of a single uniform category. For example, each pixel produced by MODIS instrument covers approximately 250 m to 1 Km square area on the ground, which is larger than the surface expression of interesting features.

42 Thus the problem of mixed pixel classification is a major issue in remote sensing. B C
43 Spectral unmixing contd Hence, it is possible to model each pixel spectrum of this image as a linear combination of a finite set of components: r 1 = a 11 * x 1 + a 12 * x a 1n * x n + e 1 r 2 = a 21 * x 1 + a 22 * x a 2n * x n + e 2 : : r m = a m1 * x 1 + a m2 * x a mn * x n + e m where, r i = Spectral response of the pixel in ith spectral band. a ij = Spectral response of the jth component in the pixel for ith spectral band. x j = Proportion value of the jth component in the pixel; e i = Error term for the ith spectral band.
44 Spectral unmixing contd This error is due to the assumption made that the response of each pixel in any spectral wavelength is a linear combination of the proportional responses of each component. j = 1, 2, 3... n (Number of components assumed for the problem) i = 1, 2, 3... m (Number of Spectral bands used in problem) A linear constraint is added, since the sum of the proportions for any pixel must be one. Also, the proportion values must be non-negative.
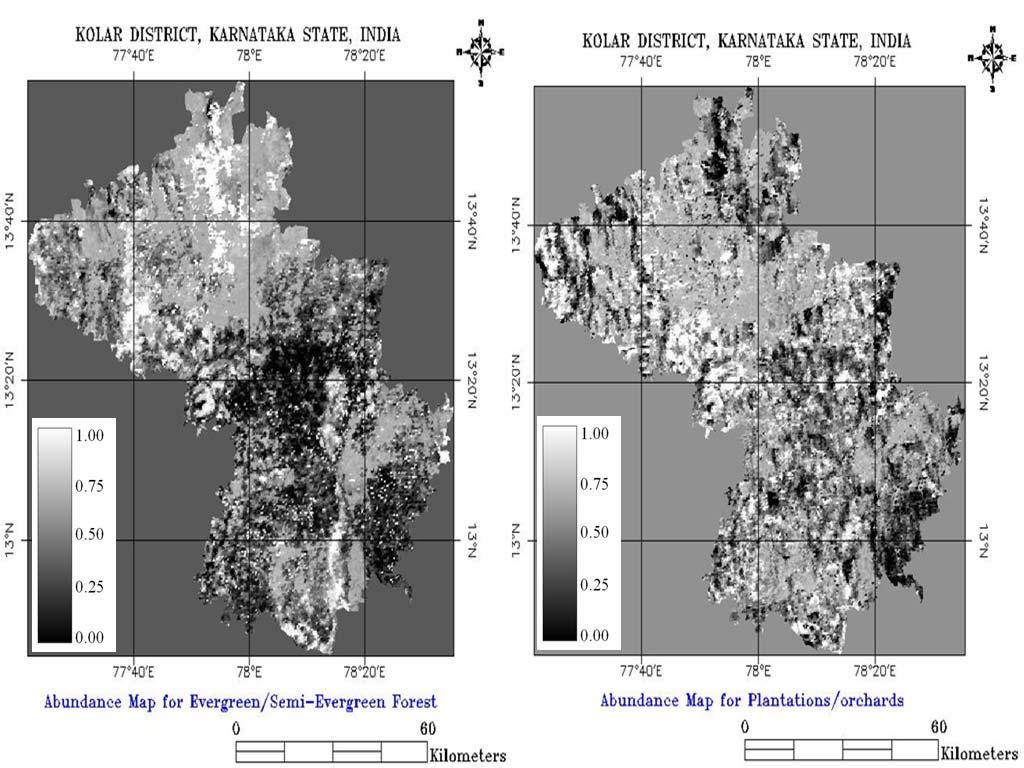
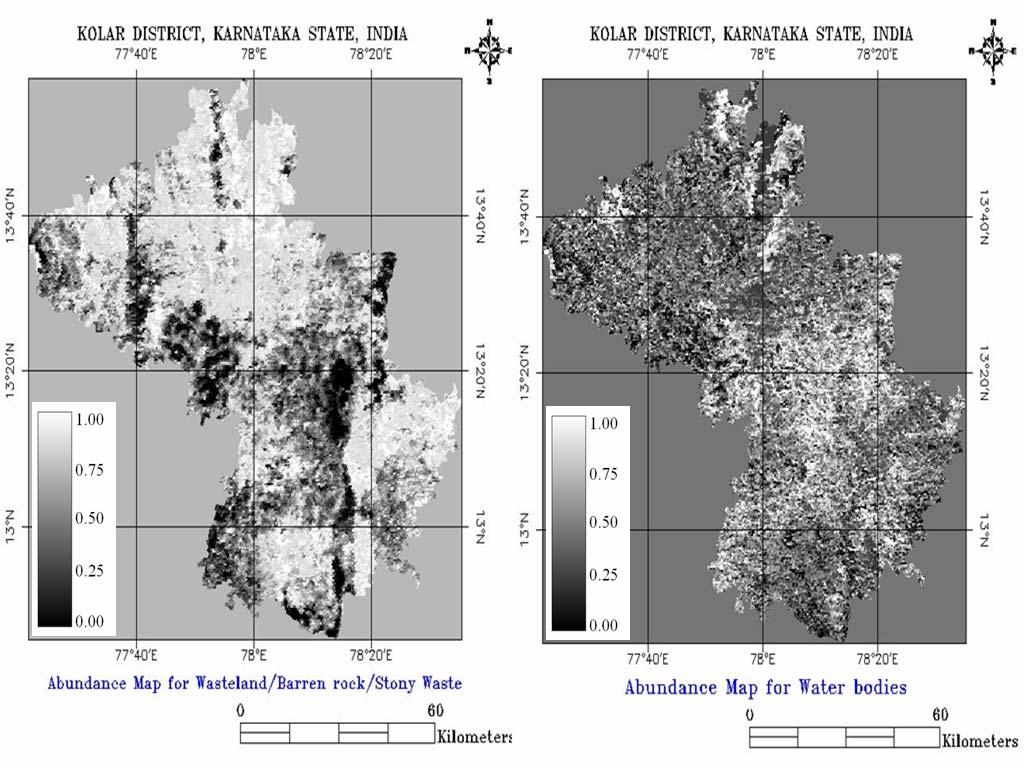
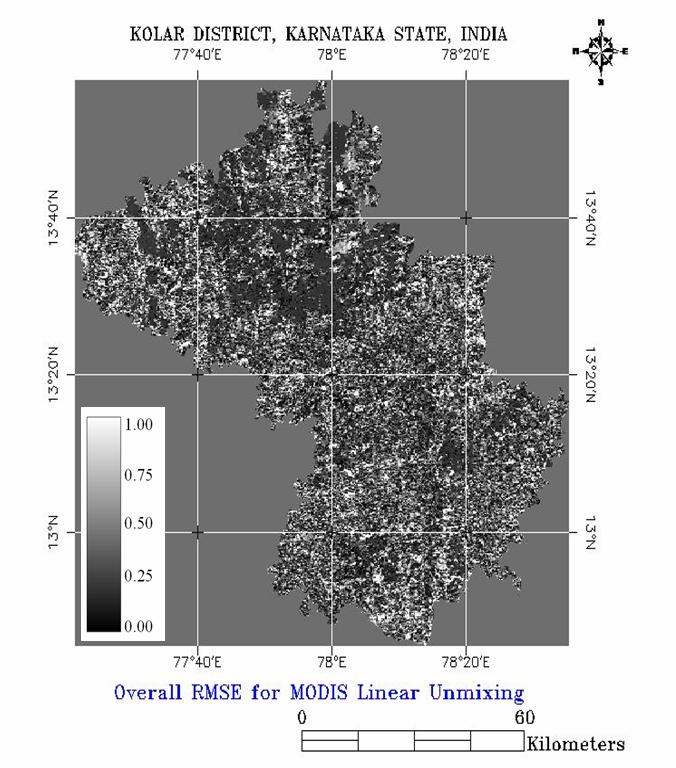
45 Linear Unmixing Soft Classification MODIS Bands (B1, B2, B3, B4, B5, B6, B7) MNF Transformation Endmemeber Selection Estimation of Proportion of each Endmember Abundance Maps 5 6
46 LMM: Endmember Collection Pixel Purity Index (PPI) - This is generated by randomly generating lines in the N-dimensional space comprising the scatter plot. All of the points in the space are then projected on to the line. The pixels falling at the extremes of the lines are counted above a certain threshold are declared pure. Scatter Plot N-Dimensional Visualization Training sites obtained from Ground Truths


47 LMM: Endmember selection Class spectral characteristics of the Endmembers 3-Dimensional visualisation of the Endmembers showing their separability
48
49 Accuracy Assessment Using Error matrix - Ground truths collected from the study area with the GPS. - Computation of User s, Producer s and Overall accuracy.
50 Comparison on the basis of on land cover class % area with LISS-3 MSS % of class A = A % of class B = B % of class C = C % of class D = D % of class E = E Administrative boundary % of class F = F Algorithms Agriculture Built up Forest Plantation Waste land Water bodies MLC (LISS3) K-Means (B1 to B7) MLC (B1 to B7) SAM (B1 to B7) NN (B1 to B7) DTA (B1 to B7) MLC (PCA) SAM (PCA) NN (PCA) DTA (PCA) MLC (MNF) SAM (MNF) NN (MNF) DTA (MNF)
51 Pixel to pixel analysis with LISS-3 MSS classified image 11 x 11 1 x 1 LISS3 (23.5 m) F A P B W 1 PIXEL OF MODIS (250 m) A W W AGRICULTURE BUILTUP FOREST PLANTATION WASTELAND WATER MIXED
52 Accuracy Assessment Comparison on the basis of percentage area with LISS-3 MSS Class LMM LISS-3 Agriculture (%) Built up (%) Forest (%) Plantation (%) Waste land (%) Water bodies (%) Land Cover details of fraction images for Chikballapur taluk
53 Accuracy Assessment based on Pixel Analysis Class Total no. of pixels identified Pure pixels Mixed pixels Wrongly classified Agriculture Built up (Urban / Rural) Evergreen/Semi- Evergreen Forest Plantation/Orchards Waste land / Barren Rock / Stony waste Water bodies Total Validation of land cover classes in Chikballapur
54 Discussions 1. For LMM, the selection of the endmembers had an high adjacency effect existing between contrasting features (for example, forest and plantation). 2. This could be a limitation to the use of MODIS data in areas of high contrasting nature, as is the case of water bodies, and raises concerns about its application especially on heavily fragmented or small isolated areas. 3. When unmixing an image to generate the abundance maps, from the presence of endmembers which do not mix in a linear fashion raises concern about the abundance maps. 4. These errors took place when the selection of endmembers was wrong, for example when these did not corresponded to pure pixels. 5. The determination of endmember fractions for MODIS exhibited good behaviors in places where the endmembers are present, generally showing the capacity of estimating values within 20 % to 25 % of the actual values except for the water bodies endmembers.
55 Seasonal Variations in Landuse (Urban) reflectance using MODIS data

56 Seasonal Variations in Urban reflectance using MODIS data Hyderabad Bangalore Chennai


57 Dec 2006 Nov 2005 Nov 2004 Nov 2003 June2003 July 2002 Oct 2002 Sep 2002 Aug 2002 Weekly data for 1 year

58 False Colour Composite of MODIS data, B1-R, B2-NIR, B4-G

59 Hyderabad Bangalore Chennai
60 FCC of Bangalore FCC of Hyderabad FCC of Chennai


61 NDVI of Bangalore Aug, 2002 and July, 2003 FCC of Bangalore


62 NDVI of Hyderabad Aug, 2002 and July, 2003 FCC of Hyderabad


63 NDVI of Chennai Aug, 2002 and July, 2003 FCC of Chennai


64 Unsupervised classification of MODIS data Bangalore Hyderabad FCC of Bangalore FCC of Hyderabad

65 FCC of Chennai Unsupervised classification of MODIS data for Chennai
66 Conclusion Remote Sensing GIS Classification Supervised and Unsupervised Endmember Selection and Linear Unmixing Temporal and Seasonal changes in reflectance of landuse classes using MODIS data

67 Print Slide Thank you
Classification (or thematic) accuracy assessment. Lecture 8 March 11, 2005
 accuracy assessment. Lecture 8 March 11, 2005") Classification (or thematic) accuracy assessment Lecture 8 March 11, 2005 Why and how Remote sensing-derived thematic information are becoming increasingly important. Unfortunately, they contain errors.
Classification (or thematic) accuracy assessment Lecture 8 March 11, 2005 Why and how Remote sensing-derived thematic information are becoming increasingly important. Unfortunately, they contain errors.
Hyperspectral Remote Sensing
 Hyperspectral Remote Sensing Multi-spectral: Several comparatively wide spectral bands Hyperspectral: Many (could be hundreds) very narrow spectral bands GEOG 4110/5100 30 AVIRIS: Airborne Visible/Infrared
Data: a collection of numbers or facts that require further processing before they are meaningful
 Digital Image Classification Data vs. Information Data: a collection of numbers or facts that require further processing before they are meaningful Information: Derived knowledge from raw data. Something
Classify Multi-Spectral Data Classify Geologic Terrains on Venus Apply Multi-Variate Statistics
 Classify Multi-Spectral Data Classify Geologic Terrains on Venus Apply Multi-Variate Statistics Operations What Do I Need? Classify Merge Combine Cross Scan Score Warp Respace Cover Subscene Rotate Translators
Introduction to digital image classification
 Introduction to digital image classification Dr. Norman Kerle, Wan Bakx MSc a.o. INTERNATIONAL INSTITUTE FOR GEO-INFORMATION SCIENCE AND EARTH OBSERVATION Purpose of lecture Main lecture topics Review
(Refer Slide Time: 0:51)
") Introduction to Remote Sensing Dr. Arun K Saraf Department of Earth Sciences Indian Institute of Technology Roorkee Lecture 16 Image Classification Techniques Hello everyone welcome to 16th lecture in
Introduction to Remote Sensing Dr. Arun K Saraf Department of Earth Sciences Indian Institute of Technology Roorkee Lecture 16 Image Classification Techniques Hello everyone welcome to 16th lecture in
Defining Remote Sensing
 Defining Remote Sensing Remote Sensing is a technology for sampling electromagnetic radiation to acquire and interpret non-immediate geospatial data from which to extract information about features, objects,
Remote Sensing Introduction to the course
 Remote Sensing Introduction to the course Remote Sensing (Prof. L. Biagi) Exploitation of remotely assessed data for information retrieval Data: Digital images of the Earth, obtained by sensors recording
The Gain setting for Landsat 7 (High or Low Gain) depends on: Sensor Calibration - Application. the surface cover types of the earth and the sun angle
 depends on: Sensor Calibration - Application. the surface cover types of the earth and the sun angle") Sensor Calibration - Application Station Identifier ASN Scene Center atitude 34.840 (34 3'0.64"N) Day Night DAY Scene Center ongitude 33.03270 (33 0'7.72"E) WRS Path WRS Row 76 036 Corner Upper eft atitude
Sensor Calibration - Application Station Identifier ASN Scene Center atitude 34.840 (34 3'0.64"N) Day Night DAY Scene Center ongitude 33.03270 (33 0'7.72"E) WRS Path WRS Row 76 036 Corner Upper eft atitude
Aardobservatie en Data-analyse Image processing
 Aardobservatie en Data-analyse Image processing 1 Image processing: Processing of digital images aiming at: - image correction (geometry, dropped lines, etc) - image calibration: DN into radiance or into
ENVI Tutorial: Geologic Hyperspectral Analysis
 ENVI Tutorial: Geologic Hyperspectral Analysis Table of Contents OVERVIEW OF THIS TUTORIAL...2 Objectives...2 s Used in This Tutorial...2 PROCESSING FLOW...3 GEOLOGIC HYPERSPECTRAL ANALYSIS...4 Overview
SOME ISSUES RELATED WITH SUB-PIXEL CLASSIFICATION USING HYPERION DATA
 SOME ISSUES RELATED WITH SUB-PIXEL CLASSIFICATION USING HYPERION DATA A. Kumar a*, H. A. Min b, a Indian Institute of Remote Sensing, Dehradun, India. anil@iirs.gov.in b Satellite Data Processing and Digital
Introduction to Remote Sensing
 Introduction to Remote Sensing Spatial, spectral, temporal resolutions Image display alternatives Vegetation Indices Image classifications Image change detections Accuracy assessment Satellites & Air-Photos
ENVI Tutorial: Vegetation Hyperspectral Analysis
 ENVI Tutorial: Vegetation Hyperspectral Analysis Table of Contents OVERVIEW OF THIS TUTORIAL...1 HyMap Processing Flow...4 VEGETATION HYPERSPECTRAL ANALYSIS...4 Examine the Jasper Ridge HyMap Radiance
Lab 9. Julia Janicki. Introduction
 Lab 9 Julia Janicki Introduction My goal for this project is to map a general land cover in the area of Alexandria in Egypt using supervised classification, specifically the Maximum Likelihood and Support
DIGITAL IMAGE ANALYSIS. Image Classification: Object-based Classification
 DIGITAL IMAGE ANALYSIS Image Classification: Object-based Classification Image classification Quantitative analysis used to automate the identification of features Spectral pattern recognition Unsupervised
Terrain categorization using LIDAR and multi-spectral data
 Terrain categorization using LIDAR and multi-spectral data Angela M. Puetz, R. C. Olsen, Michael A. Helt U.S. Naval Postgraduate School, 833 Dyer Road, Monterey, CA 93943 ampuetz@nps.edu, olsen@nps.edu
CORRELATION BETWEEN NDVI AND SURFACE TEMPERATURES USING LANDSAT ETM IMAGERY FOR SAN ANTONIO AREA. Remote Sensing Project By Newfel Mazari Fall 2005
 CORRELATION BETWEEN NDVI AND SURFACE TEMPERATURES USING LANDSAT ETM IMAGERY FOR SAN ANTONIO AREA Remote Sensing Project By Newfel Mazari Fall 2005 Procedure Introduction and Objectives Site Date Acquisition
Quality assessment of RS data. Remote Sensing (GRS-20306)
") Quality assessment of RS data Remote Sensing (GRS-20306) Quality assessment General definition for quality assessment (Wikipedia) includes evaluation, grading and measurement process to assess design,
Quality assessment of RS data Remote Sensing (GRS-20306) Quality assessment General definition for quality assessment (Wikipedia) includes evaluation, grading and measurement process to assess design,
GEOBIA for ArcGIS (presentation) Jacek Urbanski
 Jacek Urbanski") GEOBIA for ArcGIS (presentation) Jacek Urbanski INTEGRATION OF GEOBIA WITH GIS FOR SEMI-AUTOMATIC LAND COVER MAPPING FROM LANDSAT 8 IMAGERY Presented at 5th GEOBIA conference 21 24 May in Thessaloniki.
GEOBIA for ArcGIS (presentation) Jacek Urbanski INTEGRATION OF GEOBIA WITH GIS FOR SEMI-AUTOMATIC LAND COVER MAPPING FROM LANDSAT 8 IMAGERY Presented at 5th GEOBIA conference 21 24 May in Thessaloniki.
ENVI Classic Tutorial: Multispectral Analysis of MASTER HDF Data 2
 ENVI Classic Tutorial: Multispectral Analysis of MASTER HDF Data Multispectral Analysis of MASTER HDF Data 2 Files Used in This Tutorial 2 Background 2 Shortwave Infrared (SWIR) Analysis 3 Opening the
Analisi di immagini iperspettrali satellitari multitemporali: metodi ed applicazioni
 Analisi di immagini iperspettrali satellitari multitemporali: metodi ed applicazioni E-mail: bovolo@fbk.eu Web page: http://rsde.fbk.eu Outline 1 Multitemporal image analysis 2 Multitemporal images pre-processing
A State mosaic ready referral system
 A State mosaic ready referral system M.Nagamani, V. Subramanian, S. Rajendra Kumar, K.M.M. Rao National Remote Sensing Agency, Balanagar, Hyderabad 500-037, India. Keywords: Toposheet, Scale, Mosaic, Time
Attribute Accuracy. Quantitative accuracy refers to the level of bias in estimating the values assigned such as estimated values of ph in a soil map.
 Attribute Accuracy Objectives (Entry) This basic concept of attribute accuracy has been introduced in the unit of quality and coverage. This unit will teach a basic technique to quantify the attribute
CHAPTER 5 OBJECT ORIENTED IMAGE ANALYSIS
 85 CHAPTER 5 OBJECT ORIENTED IMAGE ANALYSIS 5.1 GENERAL Urban feature mapping is one of the important component for the planning, managing and monitoring the rapid urbanized growth. The present conventional
HYPERSPECTRAL REMOTE SENSING
 HYPERSPECTRAL REMOTE SENSING By Samuel Rosario Overview The Electromagnetic Spectrum Radiation Types MSI vs HIS Sensors Applications Image Analysis Software Feature Extraction Information Extraction 1
Using ArcGIS for Landcover Classification. Presented by CORE GIS May 8, 2012
 Using ArcGIS for Landcover Classification Presented by CORE GIS May 8, 2012 How to use ArcGIS for Image Classification 1. Find and download the right data 2. Have a look at the data (true color/false color)
Spectral Classification
 Spectral Classification Spectral Classification Supervised versus Unsupervised Classification n Unsupervised Classes are determined by the computer. Also referred to as clustering n Supervised Classes
Analysis Ready Data For Land
 Analysis Ready Data For Land Product Family Specification Optical Surface Reflectance (CARD4L-OSR) Document status For Adoption as: Product Family Specification, Surface Reflectance, Working Draft (2017)
CHRIS PROBA instrument
 CHRIS PROBA instrument Wout Verhoef ITC, The Netherlands verhoef @itc.nl 29 June 2009, D1L5 Contents Satellite and instrument Images Multi-angular analysis Toolbox CHRIS-PROBA PROBA-CHRIS Project for On-Board
Copyright 2005 Society of Photo-Optical Instrumentation Engineers.
 Copyright 2005 Society of Photo-Optical Instrumentation Engineers. This paper was published in the Proceedings, SPIE Symposium on Defense & Security, 28 March 1 April, 2005, Orlando, FL, Conference 5806
FIELD-BASED CLASSIFICATION OF AGRICULTURAL CROPS USING MULTI-SCALE IMAGES
 FIELD-BASED CLASSIFICATION OF AGRICULTURAL CROPS USING MULTI-SCALE IMAGES A. OZDARICI a, M. TURKER b a Middle East Technical University (METU), Graduate School of Natural and Applied Sciences, Geodetic
InSAR Operational and Processing Steps for DEM Generation
 InSAR Operational and Processing Steps for DEM Generation By F. I. Okeke Department of Geoinformatics and Surveying, University of Nigeria, Enugu Campus Tel: 2-80-5627286 Email:francisokeke@yahoo.com Promoting
Figure 1: Workflow of object-based classification
 Technical Specifications Object Analyst Object Analyst is an add-on package for Geomatica that provides tools for segmentation, classification, and feature extraction. Object Analyst includes an all-in-one
B. Sc. (Sixth Semester) Examination Rural Technology. (Application of Remote Sensing) AR- 7967
 Examination Rural Technology. (Application of Remote Sensing) AR- 7967") B. Sc. (Sixth Semester) Examination 2013 Rural Technology (Application of Remote Sensing) AR- 7967 Que. 1. Multiple choice question : (i) Which is not the example of continuous data : Answer : Rainfall
B. Sc. (Sixth Semester) Examination 2013 Rural Technology (Application of Remote Sensing) AR- 7967 Que. 1. Multiple choice question : (i) Which is not the example of continuous data : Answer : Rainfall
IMPROVING 2D CHANGE DETECTION BY USING AVAILABLE 3D DATA
 IMPROVING 2D CHANGE DETECTION BY USING AVAILABLE 3D DATA C.J. van der Sande a, *, M. Zanoni b, B.G.H. Gorte a a Optical and Laser Remote Sensing, Department of Earth Observation and Space systems, Delft
Crop Types Classification By Hyperion Data And Unmixing Algorithm
 Crop Types Classification By Hyperion Data And Unmixing Algorithm H. FAHIMNEJAD 1, S.R. SOOFBAF 2, A. ALIMOHAMMADI 3, M. J. VALADAN ZOEJ 4 Geodesy and Geomatic Faculty, K.N.Toosi University of Technology,
AN INTEGRATED APPROACH TO AGRICULTURAL CROP CLASSIFICATION USING SPOT5 HRV IMAGES
 AN INTEGRATED APPROACH TO AGRICULTURAL CROP CLASSIFICATION USING SPOT5 HRV IMAGES Chang Yi 1 1,2,*, Yaozhong Pan 1, 2, Jinshui Zhang 1, 2 College of Resources Science and Technology, Beijing Normal University,
EVALUATION OF THE THEMATIC INFORMATION CONTENT OF THE ASTER-VNIR IMAGERY IN URBAN AREAS BY CLASSIFICATION TECHNIQUES
 EVALUATION OF THE THEMATIC INFORMATION CONTENT OF THE ASTER-VNIR IMAGERY IN URBAN AREAS BY CLASSIFICATION TECHNIQUES T. G. Panagou a *, G. Ch. Miliaresis a a TEI, Dpt. of Topography, 3 P.Drakou Str., Thiva,
2014 Google Earth Engine Research Award Report
 2014 Google Earth Engine Research Award Report Title: Mapping Invasive Vegetation using Hyperspectral Data, Spectral Angle Mapping, and Mixture Tuned Matched Filtering Section I: Section II: Section III:
ArcGIS Pro: Image Segmentation, Classification, and Machine Learning. Jeff Liedtke and Han Hu
 ArcGIS Pro: Image Segmentation, Classification, and Machine Learning Jeff Liedtke and Han Hu Overview of Image Classification in ArcGIS Pro Overview of the classification workflow Classification tools
Soft Classification based Sub-pixel Allocation model
 Soft Classification based Sub-pixel Allocation model Uttam Kumar 1 [uttam@ces.iisc.ernet.in] Mukhopadhyay C 2. [cm@mgmt.iisc.ernet.in] Kumar Raja S 3 [s_kumar_raja@yahoo.com] & Ramachandra T. V 4,* [cestvr@ces.iisc.ernet.in]
Lecture 7. Spectral Unmixing. Summary. Mixtures in Remote Sensing
 Lecture 7 Spectral Unmixing Summary This lecture will introduce you to the concepts of linear spectral mixing. This methods is sometimes also called: Spectral Mixture Analysis (SMA: Wessman et al 1997)
Image Classification. RS Image Classification. Present by: Dr.Weerakaset Suanpaga
 Image Classification Present by: Dr.Weerakaset Suanpaga D.Eng(RS&GIS) 6.1 Concept of Classification Objectives of Classification Advantages of Multi-Spectral data for Classification Variation of Multi-Spectra
Preprocessed Input Data. Description MODIS
 Preprocessed Input Data Description MODIS The Moderate Resolution Imaging Spectroradiometer (MODIS) Surface Reflectance products provide an estimate of the surface spectral reflectance as it would be measured
CHRIS Proba Workshop 2005 II
 CHRIS Proba Workshop 25 Analyses of hyperspectral and directional data for agricultural monitoring using the canopy reflectance model SLC Progress in the Upper Rhine Valley and Baasdorf test-sites Dr.
LAND COVER CHANGE DETECTION USING OBJECT-BASED CLASSIFICATION TECHNIQUE: A CASE STUDY ALONG THE KOSI RIVER, BIHAR
 LAND COVER CHANGE DETECTION USING OBJECT-BASED CLASSIFICATION TECHNIQUE: A CASE STUDY ALONG THE KOSI RIVER, BIHAR Mohit Modi*, Rajiv Kumar, G.Ravi Shankar and Tapas. R.Martha National Remote Sensing Centre,
ENHANCEMENT OF THE DOUBLE FLEXIBLE PACE SEARCH THRESHOLD DETERMINATION FOR CHANGE VECTOR ANALYSIS
 ENHANCEMENT OF THE DOUBLE FLEXIBLE PACE SEARCH THRESHOLD DETERMINATION FOR CHANGE VECTOR ANALYSIS S. A. Azzouzi a,b,, A. Vidal a, H. A. Bentounes b a Instituto de Telecomunicaciones y Aplicaciones Multimedia
Remote Sensing & Photogrammetry W4. Beata Hejmanowska Building C4, room 212, phone:
 Remote Sensing & Photogrammetry W4 Beata Hejmanowska Building C4, room 212, phone: +4812 617 22 72 605 061 510 galia@agh.edu.pl 1 General procedures in image classification Conventional multispectral classification
GIS in agriculture scale farm level - used in agricultural applications - managing crop yields, monitoring crop rotation techniques, and estimate
 Types of Input GIS in agriculture scale farm level - used in agricultural applications - managing crop yields, monitoring crop rotation techniques, and estimate soil loss from individual farms or agricultural
This is the general guide for landuse mapping using mid-resolution remote sensing data
 This is the general guide for landuse mapping using mid-resolution remote sensing data February 11 2015 This document has been prepared for Training workshop on REDD+ Research Project in Peninsular Malaysia
SAM and ANN classification of hyperspectral data of seminatural agriculture used areas
 Proceedings of the 28th EARSeL Symposium: Remote Sensing for a Changing Europe, Istambul, Turkey, June 2-5 2008. Millpress Science Publishers Zagajewski B., Olesiuk D., 2008. SAM and ANN classification
Alaska Department of Transportation Roads to Resources Project LiDAR & Imagery Quality Assurance Report Juneau Access South Corridor
 Alaska Department of Transportation Roads to Resources Project LiDAR & Imagery Quality Assurance Report Juneau Access South Corridor Written by Rick Guritz Alaska Satellite Facility Nov. 24, 2015 Contents
DATA FUSION, DE-NOISING, AND FILTERING TO PRODUCE CLOUD-FREE TEMPORAL COMPOSITES USING PARALLEL TEMPORAL MAP ALGEBRA
 DATA FUSION, DE-NOISING, AND FILTERING TO PRODUCE CLOUD-FREE TEMPORAL COMPOSITES USING PARALLEL TEMPORAL MAP ALGEBRA Bijay Shrestha Dr. Charles O Hara Preeti Mali GeoResources Institute Mississippi State
Hands on Exercise Using ecognition Developer
 1 Hands on Exercise Using ecognition Developer 2 Hands on Exercise Using ecognition Developer Hands on Exercise Using ecognition Developer Go the Windows Start menu and Click Start > All Programs> ecognition
INTERNATIONAL JOURNAL OF GEOMATICS AND GEOSCIENCES Volume 2, No 2, 2011
 INTERNATIONAL JOURNAL OF GEOMATICS AND GEOSCIENCES Volume 2, No 2, 2011 Copyright 2010 All rights reserved Integrated Publishing services Research article ISSN 076 480 Image fusion techniques for accurate
Machine learning approach to retrieving physical variables from remotely sensed data
 Machine learning approach to retrieving physical variables from remotely sensed data Fazlul Shahriar November 11, 2016 Introduction There is a growing wealth of remote sensing data from hundreds of space-based
Lab #4 Introduction to Image Processing II and Map Accuracy Assessment
 FOR 324 Natural Resources Information Systems Lab #4 Introduction to Image Processing II and Map Accuracy Assessment (Adapted from the Idrisi Tutorial, Introduction Image Processing Exercises, Exercise
Land Cover Classification Techniques
 Land Cover Classification Techniques supervised classification and random forests Developed by remote sensing specialists at the USFS Geospatial Technology and Applications Center (GTAC), located in Salt
S2 MPC Data Quality Report Ref. S2-PDGS-MPC-DQR
 S2 MPC Data Quality Report Ref. S2-PDGS-MPC-DQR 2/13 Authors Table Name Company Responsibility Date Signature Written by S. Clerc & MPC Team ACRI/Argans Technical Manager 2015-11-30 Verified by O. Devignot
Automated large area tree species mapping and disease detection using airborne hyperspectral remote sensing
 Automated large area tree species mapping and disease detection using airborne hyperspectral remote sensing William Oxford Neil Fuller, James Caudery, Steve Case, Michael Gajdus, Martin Black Outline About
CLASSIFICATION OF HYPERSPECTRAL DATA OF SEMINATURAL ECOSYSTEMS
 CLASSIFICATION OF HYPERSPECTRAL DATA OF SEMINATURAL ECOSYSTEMS B. Zagajewski, D. Olesiuk Dept. of Geoinformatics and Remote Sensing, Faculty of Geography and Regional Studies, University of Warsaw, Krakowskie
Geomatica II Course guide
 Course guide Geomatica Version 2017 SP4 2017 PCI Geomatics Enterprises, Inc. All rights reserved. COPYRIGHT NOTICE Software copyrighted by PCI Geomatics Enterprises, Inc., 90 Allstate Parkway, Suite 501
A Comparative Study of Conventional and Neural Network Classification of Multispectral Data
 A Comparative Study of Conventional and Neural Network Classification of Multispectral Data B.Solaiman & M.C.Mouchot Ecole Nationale Supérieure des Télécommunications de Bretagne B.P. 832, 29285 BREST
TEMPORAL SIGNATURE MATCHING FOR LAND COVER CLASSIFICATION
 TEMPORAL SIGNATURE MATCHING FOR LAND COVER CLASSIFICATION Sudhir Gupta a *, K. S. Raan b a The LNM Institute of Information Technology, Jaipur, India -sudhir@lnmiit.ac.in b International Institute of Information
CLASSIFICATION OF NONPHOTOGRAPHIC REMOTE SENSORS
 CLASSIFICATION OF NONPHOTOGRAPHIC REMOTE SENSORS PASSIVE ACTIVE DIGITAL CAMERA THERMAL (e.g. TIMS) VIDEO CAMERA MULTI- SPECTRAL SCANNERS VISIBLE & NIR MICROWAVE HYPERSPECTRAL (e.g. AVIRIS) SLAR Real Aperture
Software requirements * : Part III: 2 hrs.
 Title: Product Type: Developer: Target audience: Format: Software requirements * : Data: Estimated time to complete: Mapping snow cover using MODIS Part I: The MODIS Instrument Part II: Normalized Difference
About LIDAR Data. What Are LIDAR Data? How LIDAR Data Are Collected
 1 of 6 10/7/2006 3:24 PM Project Overview Data Description GIS Tutorials Applications Coastal County Maps Data Tools Data Sets & Metadata Other Links About this CD-ROM Partners About LIDAR Data What Are
Airborne Hyperspectral Imaging Using the CASI1500
 Airborne Hyperspectral Imaging Using the CASI1500 AGRISAR/EAGLE 2006, ITRES Research CASI 1500 overview A class leading VNIR sensor with extremely sharp optics. 380 to 1050nm range 288 spectral bands ~1500
TOA RADIANCE SIMULATOR FOR THE NEW HYPERSPECTRAL MISSIONS: STORE (SIMULATOR OF TOA RADIANCE)
") TOA RADIANCE SIMULATOR FOR THE NEW HYPERSPECTRAL MISSIONS: STORE (SIMULATOR OF TOA RADIANCE) Malvina Silvestri Istituto Nazionale di Geofisica e Vulcanologia In the frame of the Italian Space Agency (ASI)
TOA RADIANCE SIMULATOR FOR THE NEW HYPERSPECTRAL MISSIONS: STORE (SIMULATOR OF TOA RADIANCE) Malvina Silvestri Istituto Nazionale di Geofisica e Vulcanologia In the frame of the Italian Space Agency (ASI)
Outlier and Target Detection in Aerial Hyperspectral Imagery: A Comparison of Traditional and Percentage Occupancy Hit or Miss Transform Techniques
 Outlier and Target Detection in Aerial Hyperspectral Imagery: A Comparison of Traditional and Percentage Occupancy Hit or Miss Transform Techniques Andrew Young a, Stephen Marshall a, and Alison Gray b
Hyperspectral Image Acquisition and Analysis
 Hyperspectral Image Acquisition and Analysis PECORA 15 Workshop 7 Airborne Remote Sensing: A Fast-track Approach to NEPA Streamlining for Transportation Jen Aitken, ITRES Research Limited CASI Hyperspectral
User guide for MODIS derived vegetation fractional cover metrics
 User guide for MODIS derived vegetation fractional cover metrics Introduction The MODIS derived vegetation fractional cover metrics is a collection of image files which statistically summarise the time
Aerial photography: Principles. Visual interpretation of aerial imagery
 Aerial photography: Principles Visual interpretation of aerial imagery Overview Introduction Benefits of aerial imagery Image interpretation Elements Tasks Strategies Keys Accuracy assessment Benefits
Procedure for Development of Crop Mask for Major Seasonal Crops in Punjab & Sindh Provinces of Pakistan
 [Type text] Procedure for Development of Crop Mask for Major Seasonal Crops in Punjab & Sindh Provinces of Pakistan Preface Agriculture sector contributes around 21% to GDP annually. Major contributing
Operational use of the Orfeo Tool Box for the Venµs Mission
 Operational use of the Orfeo Tool Box for the Venµs Mission Thomas Feuvrier http://uk.c-s.fr/ Free and Open Source Software for Geospatial Conference, FOSS4G 2010, Barcelona Outline Introduction of the
Monitoring vegetation dynamics using MERIS fused images
 Monitoring vegetation dynamics using MERIS fused images Raul Zurita-Milla (1), G. Kaiser (2), J. Clevers (1), W. Schneider (2) and M.E. Schaepman (1) (1) Wageningen University, The Netherlands (2) University
STRATEGIES FOR ALTERNATE APPROACHES FOR VEGETATION INDICES COMPOSITING USING PARALLEL TEMPORAL MAP ALGEBRA
 STRATEGIES FOR ALTERNATE APPROACHES FOR VEGETATION INDICES COMPOSITING USING PARALLEL TEMPORAL MAP ALGEBRA Bijay Shrestha, Dr. Charles O Hara Dr. Nicholas H. Younan Mississippi State University OUTLINE
IMAGINE Objective. The Future of Feature Extraction, Update & Change Mapping
 IMAGINE ive The Future of Feature Extraction, Update & Change Mapping IMAGINE ive provides object based multi-scale image classification and feature extraction capabilities to reliably build and maintain
APPLICATION OF SOFTMAX REGRESSION AND ITS VALIDATION FOR SPECTRAL-BASED LAND COVER MAPPING
 APPLICATION OF SOFTMAX REGRESSION AND ITS VALIDATION FOR SPECTRAL-BASED LAND COVER MAPPING J. Wolfe a, X. Jin a, T. Bahr b, N. Holzer b, * a Harris Corporation, Broomfield, Colorado, U.S.A. (jwolfe05,
Unsupervised and Self-taught Learning for Remote Sensing Image Analysis
 Unsupervised and Self-taught Learning for Remote Sensing Image Analysis Ribana Roscher Institute of Geodesy and Geoinformation, Remote Sensing Group, University of Bonn 1 The Changing Earth https://earthengine.google.com/timelapse/
Prof. Vidya Manian Dept. of Electrical l and Comptuer Engineering. INEL6007(Spring 2010) ECE, UPRM
 ECE, UPRM") Inel 6007 Introduction to Remote Sensing Chapter 5 Spectral Transforms Prof. Vidya Manian Dept. of Electrical l and Comptuer Engineering Chapter 5-1 MSI Representation Image Space: Spatial information
Inel 6007 Introduction to Remote Sensing Chapter 5 Spectral Transforms Prof. Vidya Manian Dept. of Electrical l and Comptuer Engineering Chapter 5-1 MSI Representation Image Space: Spatial information
Airborne LiDAR Data Acquisition for Forestry Applications. Mischa Hey WSI (Corvallis, OR)
") Airborne LiDAR Data Acquisition for Forestry Applications Mischa Hey WSI (Corvallis, OR) WSI Services Corvallis, OR Airborne Mapping: Light Detection and Ranging (LiDAR) Thermal Infrared Imagery 4-Band
Airborne LiDAR Data Acquisition for Forestry Applications Mischa Hey WSI (Corvallis, OR) WSI Services Corvallis, OR Airborne Mapping: Light Detection and Ranging (LiDAR) Thermal Infrared Imagery 4-Band
Classification of Sentinel-2 Images Utilizing Abundance Representation
 Proceedings Classification of Sentinel-2 Images Utilizing Abundance Representation Eleftheria Mylona *, Vassiliki Daskalopoulou, Olga Sykioti, Konstantinos Koutroumbas and Athanasios Rontogiannis Institute
Automated Building Change Detection using multi-level filter in High Resolution Images ZHEN LIU
 Automated uilding Change Detection using multi-level filter in High Resolution Images ZHEN LIU Center of Information & Network Technology, eiing Normal University,00875, zliu@bnu.edu.cn Abstract: The Knowledge
A Vector Agent-Based Unsupervised Image Classification for High Spatial Resolution Satellite Imagery
 A Vector Agent-Based Unsupervised Image Classification for High Spatial Resolution Satellite Imagery K. Borna 1, A. B. Moore 2, P. Sirguey 3 School of Surveying University of Otago PO Box 56, Dunedin,
Analysis Ready Data For Land (CARD4L-ST)
") Analysis Ready Data For Land Product Family Specification Surface Temperature (CARD4L-ST) Document status For Adoption as: Product Family Specification, Surface Temperature This Specification should next
Analysis Ready Data For Land Product Family Specification Surface Temperature (CARD4L-ST) Document status For Adoption as: Product Family Specification, Surface Temperature This Specification should next
Object-Based Classification & ecognition. Zutao Ouyang 11/17/2015
 Object-Based Classification & ecognition Zutao Ouyang 11/17/2015 What is Object-Based Classification The object based image analysis approach delineates segments of homogeneous image areas (i.e., objects)
An Introduction to Lidar & Forestry May 2013
 An Introduction to Lidar & Forestry May 2013 Introduction to Lidar & Forestry Lidar technology Derivatives from point clouds Applied to forestry Publish & Share Futures Lidar Light Detection And Ranging
GPS/GIS Activities Summary
 GPS/GIS Activities Summary Group activities Outdoor activities Use of GPS receivers Use of computers Calculations Relevant to robotics Relevant to agriculture 1. Information technologies in agriculture
Municipal Projects in Cambridge Using a LiDAR Dataset. NEURISA Day 2012 Sturbridge, MA
 Municipal Projects in Cambridge Using a LiDAR Dataset NEURISA Day 2012 Sturbridge, MA October 15, 2012 Jeff Amero, GIS Manager, City of Cambridge Presentation Overview Background on the LiDAR dataset Solar
COSC160: Detection and Classification. Jeremy Bolton, PhD Assistant Teaching Professor
 COSC160: Detection and Classification Jeremy Bolton, PhD Assistant Teaching Professor Outline I. Problem I. Strategies II. Features for training III. Using spatial information? IV. Reducing dimensionality
INTEGRATION OF TREE DATABASE DERIVED FROM SATELLITE IMAGERY AND LIDAR POINT CLOUD DATA
 INTEGRATION OF TREE DATABASE DERIVED FROM SATELLITE IMAGERY AND LIDAR POINT CLOUD DATA S. C. Liew 1, X. Huang 1, E. S. Lin 2, C. Shi 1, A. T. K. Yee 2, A. Tandon 2 1 Centre for Remote Imaging, Sensing
Machine Learning Applications in Exploration and Mining
 Machine Learning Applications in Exploration and Mining Tom Carmichael, Brenton Crawford, Liam Webb. QEC - The role of data in discovery 28 th February 2018 www.solvegeosolutions.com Outline Where and
AUTOMATIC RECOGNITION OF RICE FIELDS FROM MULTITEMPORAL SATELLITE IMAGES
 AUTOMATIC RECOGNITION OF RICE FIELDS FROM MULTITEMPORAL SATELLITE IMAGES Y.H. Tseng, P.H. Hsu and I.H Chen Department of Surveying Engineering National Cheng Kung University Taiwan, Republic of China tseng@mail.ncku.edu.tw
Multi-Spectral Image Analysis and NURBS-based 3D Visualization of Land Maps
 Multi-Spectral Image Analysis and URBS-based 3D Visualization of Land Maps Dilshan Jayathilaka and Ravinda G.. Meegama Centre for Computer Studies Sabaragamuwa University P.O. Box 2, Belihuloya SRI LAKA
Fourier analysis of low-resolution satellite images of cloud
 New Zealand Journal of Geology and Geophysics, 1991, Vol. 34: 549-553 0028-8306/91/3404-0549 $2.50/0 Crown copyright 1991 549 Note Fourier analysis of low-resolution satellite images of cloud S. G. BRADLEY
EVALUATION OF CONVENTIONAL DIGITAL CAMERA SCENES FOR THEMATIC INFORMATION EXTRACTION ABSTRACT
 EVALUATION OF CONVENTIONAL DIGITAL CAMERA SCENES FOR THEMATIC INFORMATION EXTRACTION H. S. Lim, M. Z. MatJafri and K. Abdullah School of Physics Universiti Sains Malaysia, 11800 Penang ABSTRACT A study
Temporal Modeling and Missing Data Estimation for MODIS Vegetation data
 Temporal Modeling and Missing Data Estimation for MODIS Vegetation data Rie Honda 1 Introduction The Moderate Resolution Imaging Spectroradiometer (MODIS) is the primary instrument on board NASA s Earth
GEOG 4110/5100 Advanced Remote Sensing Lecture 2
 GEOG 4110/5100 Advanced Remote Sensing Lecture 2 Data Quality Radiometric Distortion Radiometric Error Correction Relevant reading: Richards, sections 2.1 2.8; 2.10.1 2.10.3 Data Quality/Resolution Spatial