This is the general guide for landuse mapping using mid-resolution remote sensing data
|
|
|
- Penelope Hicks
- 6 years ago
- Views:
Transcription
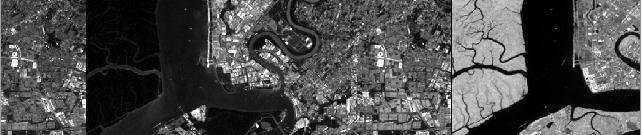
1 This is the general guide for landuse mapping using mid-resolution remote sensing data February This document has been prepared for Training workshop on REDD+ Research Project in Peninsular Malaysia based on Multispec & QuantumGIS Open Source Software applications
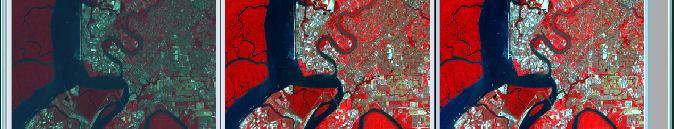
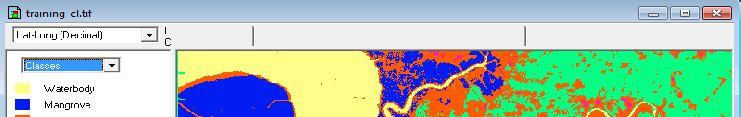
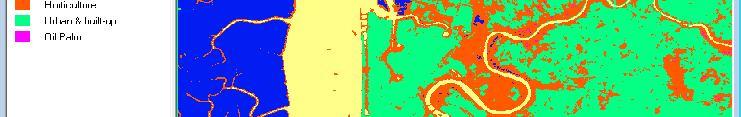
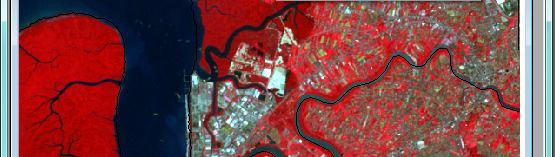
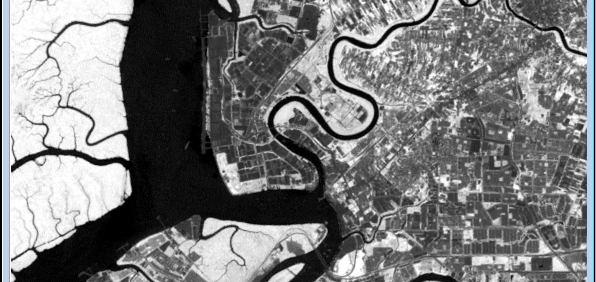
2 GENERAL GUIDE FOR LANDUSE MAPPING USING MID-RESOLUTION REMOTE SENSING DATA 1 Classification system and map legend The general methodology of landuse mapping consists of six steps: (1) Determination of classification system; (2) Preparation of ground truth data based on the predetermined classification system; (3) Preprocessing of satellite data; (4) Classification by satellite data; (5) Correction and modification; (6) Validation using ground truth data. The first one of all steps is about the classification system; it means the classification system is quite important. Land cover classification system is decided considering the purpose of the land cover mapping project. Usually classification systems of different projects vary. Based on this project mapping purpose, we need to define land cover classification system. The detailed definition of each type sees Table 1. Table1 Landuse classification system No Landuse Type Landuse Definition 1 Inland Forest Natural forests with > 30% canopy cover, the canopy being > 75% of dipterocarps forest. 2 Cropland Cultivated, pasture land, rubber and oil palm plantation 3 Mangrove Natural forests with > 30% canopy cover, composed of species of mangrove tree, generally along coasts in or near brackish or salt water. 4 Urban & Built-up Includes residential, commercial and industrial, transportation, sport facilities 5 Shrub land Woody vegetation < 3m in height, with at least 10% ground cover 6 Grassland Upland herbaceous grasses >10% ground cover 7 Water body Permanent open water bodies 8 Clouds/Shadows/No data Areas where land cover interpretation was not possible 2 Data preparation 2.1 Input Remote sensing data Medium resolution multi-spectral remote sensing data were chosen for landuse mapping in this project, taking into account the price and time limits for the production. The spatial resolution of the remote sensing image ranges from 10 to 30m, while the 2
3 band number ranges from 3 to 10. In this project we use Landsat multi-spectral data. Table 2 The key parameters of the multi-spectral remote sensing data to be used in this project Data sources Imaging years Resolution (m) Bands to be used Availability Landsat TM 1982 to present 30 m for multi-spectral bands, 120 m for thermal infrared band; Each scene covers an area of km. Temporal resolution is 16 days 7 Free, full coverage difficult Landsat ETM to present 15 m for panchromatic band, 60m for thermal infrared and 30m for multi-spectral bands; Temporal resolution is 16 days 7 Free, no full coverage 2.2 Reference data Collect any archived data useful for defining the location and extent of training samples for classification. For examples: history landuse map, dominate forest types map, forest coverage map etc. High resolution (1-5m) remote sensing data can also be used for classification reference such as by using Google Earth. The user should know the mapping or imaging date of these reference data very well. Don t use data sources without any metadata information as reference data for landuse mapping. 3 Image Classification Image classification, in a broad sense, is defined as the process of extracting differentiated classes or themes (e.g. land use categories, vegetation species) from raw remotely sensed satellite data. Obviously this definition includes the preprocessing of images. We here simply refer to the process following the image preprocessing as image classification. 3
4 3.1 Supervised versus unsupervised classification Supervised classification is most appearing if there is much training data available to support training the classifier. However, for classifications in an area without extensive training data, unsupervised classification may be faster and easier. Unsupervised classification tends to be most useful when the desired map classes are spectrally complex, that is, they are not well characterized by a single multi-variate distribution function. Unsupervised classification allows multiple spectral classes within individual map classes. The best approach when using supervised classification in this situation is to employ a non-parameterc classifier such as neural networks or decision trees or to develop multiple spectral classes for each map class through the training and classification steps. It should be noticed that the direct results from unsupervised classification can only tell you the distinct spectral classes, however, what we expect from one classification are specific information classes, so the spectral classes should be reclassified or combined into some information classes as in the final landuse classes, this needs the knowledge learned from the ground true data. 3.2 Image classification methods Image classification method, as one kind of multivariate methods, can be grouped into parametric, non-parametric, spatial-spectral and spectral-temporal classification as shown in table 3. The classification method most suitable to your project is mapping site, project objective, data sources used dependant. It is upon the user to choose one of them according to the specific mapping activities. 4
5 Table 2 Summary of classification methods, and their advantages and availability for forest attribute mapping Classifier Parametric Maximum likelihood Minimum distance Box classifier or parallelepiped (mean and standard deviations) Generalized Linear Model (GLM) Nonparametric Box classifier or parallelepiped (minimum, maximum) Artificial Neural Networks Decision (Classification) Trees Comments Works for well separated classes (eg. Land cover, forest classes with different physiognomy): requires relatively few training sites but subclasses must be characterized; results improve using iterative cluster busting Fast; Works for well separated classes with similar variability Fast; Works for well separated Useful if response function between dependent and independent variables well known, or of interest (eg. Tree species distributions) Fast; Works for well separated classes; useful for quick look or to apply before MLC Good results for forest classification; requires extensive training data Useful for combing remote sensing and other variables; decision rules are explicit; classification accuracies may not be much greater than MLC 5
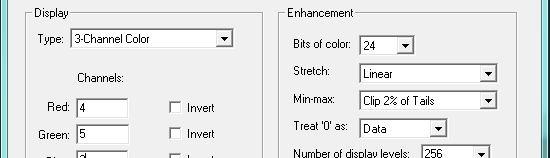
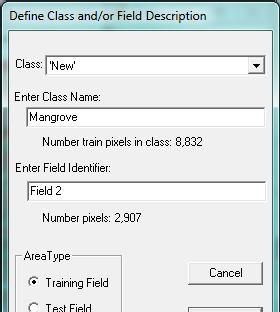
6 4.2 Procedures for supervised landuse classification The general procedures for supervised classification can be summarized as that shown in Fig. 1. A brief description of the major steps is as follows. Remote sensing data Ground truth & reference data for classifier training Class delineation & Training sample designation Features extraction & Preliminary classification Statistic & Report Final map Final classification description definition Classification No Accuracy satisfied Manual editing Yes Class speckle filtering Accuracy assessment Ground true & reference data for accuracy assessment Fig. 1 General procedures for supervised classification Class Delineation. The analysis process begins with a general overview of the data set to be analyzed, often by viewing a 3-color simulated color infrared presentation of the data in image space. The intent is to create a list of classes which is suitably exhaustive, and which includes the classes of user interest. To the extent possible at this point and from such an image presentation, consideration should be given to picking classes in such a way as to provide for a set that are separable from a spectral standpoint. Training Sample Designation. Following, or as a part of listing the desired classes, the spectral description of the classes must be designated. How this is done varies widely with the particular data set and the information about the scene that is available to the 6
7 analyst. Examples of some of the ways this might come about are as follows. Observations taken from a portion of the ground scene at the time of the data collection; Observations from aerial photographs from which examples of each class can be labeled; Conclusions that can be drawn directly from the image space, itself. For example, an urban mapping problem where the spatial resolution was great enough to make objects of human interest recognizable in image space. Conclusions that can be drawn about individual pixels by observing a spectral space representation of a pixel. The use of imaging spectroscopy characteristics, where specific absorption bands of individual molecules are used to identify specific minerals, are an example of this. Optimal class definition requires that the classes defined must be Exhaustive. There must be a logical class to assign each pixel in the scene to. Separable. The classes must be separable to an adequate degree in terms of the spectral features available. Of informational value. The classes must be ones that meet the user needs. These three conditions on the list of classes must be met simultaneously. Note that the exhaustive condition and separability are properties of the data set, while the user imposes the informational value condition. It is the bringing together of these circumstances, those imposed by the data with those imposed by the user s desires that is the challenge to the analyst. It is further noted that the classes are defined by the training samples selected. That is to say that the definition of classes is a quantitative and objective one, not a semantic one. One has not really defined a class one might wish to call forest until one has labeled the training samples to be associated with that class name, thus documenting quantitatively what is meant (and what is not meant) by the word forest. Feature Extraction and Preliminary Classification. At this point one can expect to have training sets defined for each class, but they may be small. There would thus be value in eliminating features that are not effective for the particular set of classes at hand, so as to reduce the dimensionality without loss of information. A feature extraction algorithm would be used for this purpose, followed by a preliminary classification. From 7
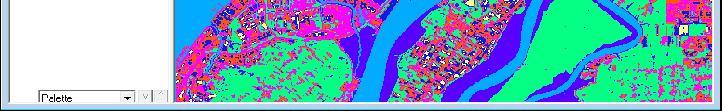
8 the preliminary classification, one can determine if the class list is suitably exhaustive, or if there have been classes of land cover of significant size that have been overlooked. One can also determine if the desired classes are adequately separable. If not, the classification can be used to increase the selection of training samples, so that a more precise and detailed set of quantitative class descriptions are determined. Final Class Description Determination. With the new augmented training set, in terms of either additional classes having been defined or more samples labeled for the classes or both, any of the following several steps may be taken to achieve the final class descriptions in terms of class statistics. It may be appropriate to re-apply a feature extraction algorithm, given the improved class descriptions. In this way, a more optimal subspace may be found. The Statistics Enhancement algorithm may be applied. This algorithm is known to be sensitive to outliers, and thus would not be expected to perform well until it is known that the list of classes is indeed exhaustive, as classes not previously identified would function as outliers to the defined classes. The intended result of applying this algorithm at this point is to increase the accuracy performance of the following classification and to improve the generalization capabilities of the classifier from the training areas to the rest of the data set. Post-Classification Filtering. Resulting classification map may be difficult to interpret, because it has a salt-and-pepper appearance due to inherent variability of the per-pixel classifier. So post-classification filtering is needed to remove pixels and pixel groups not satisfying a minimum requirement. It usually can enhance interpretability and increases classification accuracy. A final classification of adequate quality should be possible at this point. Classification Accuracy Assessment. If the accuracy is not good enough, depending on the nature of the further improvement needed, a return to any of the above steps may be used. 8
9 4.3 Classification Accuracy Assessment Accuracy assessment stages Four significant stages have been witnessed in accuracy assessment methods. Accuracy assessment in the first stage was done by visual inspection of derived maps. This method is deemed to be highly subjective and often not accurate. The second stage used a more objective method by which comparisons of the area extents of the classes in the derived thematic maps (e.g. the percentage of a specific vegetation group in area) were made with the corresponding extents on ground or in other reference dataset. However, there is a major problem with this non-site-specific approach since the correct proportions of vegetation groups do not necessarily mean the correct locations at which they locate. In the third stage, the accuracy metrics were built on a comparison of the class labels in the thematic map with the ground data for the same locations. Measures such as the percentages of cases correctly (and wrongly) classified were used to evaluate the classification accuracy. The accuracy assessment at the fourth stage made further refinements on the basis of the third stage. The obvious characteristic of this stage is the wide use of the confusion or error matrix, which describes the fitness between the derived classes and the reference data through using the measures like overall accuracy and kappa coefficient. Additionally, a variety of other measures is also available or can be derived from the error matrix. For example, the accuracy of individual classes can be derived if the user is interested in specific vegetation groups Ground truth data collection for accuracy assessment Generally, there are three major ground truth data collection methods by different reference data sources: 1) Record the landuse type and its location using GPS in the field through ground survey work. 2) Through aerial photo interpretation when the aerial photos is available and timely consistent with the remote sensing data used for classification. 3) Using GIS layer from other sources. 9
 method to determine the sampling location in the field. Figure 2 shows the concept of this sampling method.")


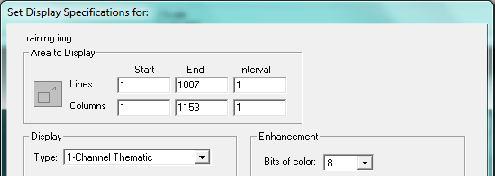
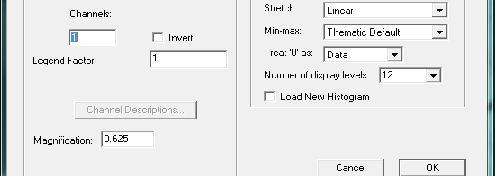
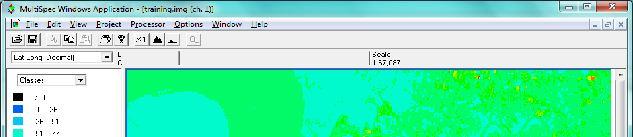
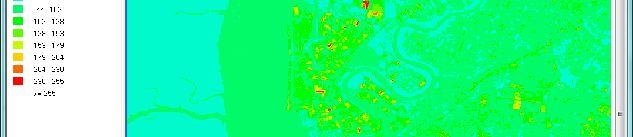
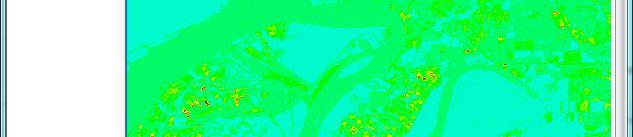
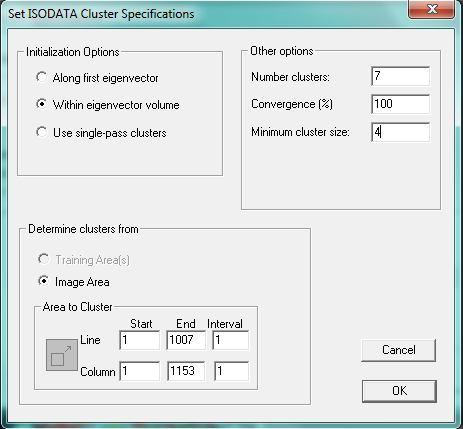
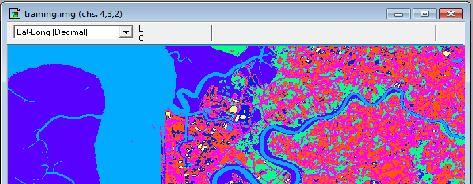
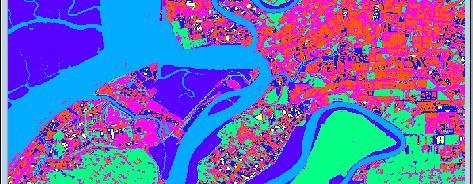
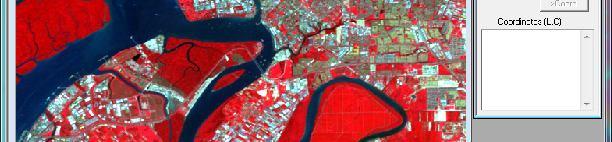
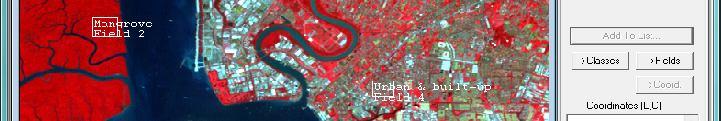
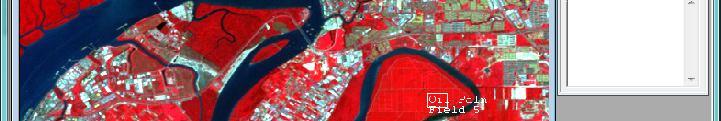
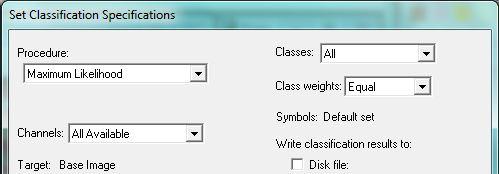
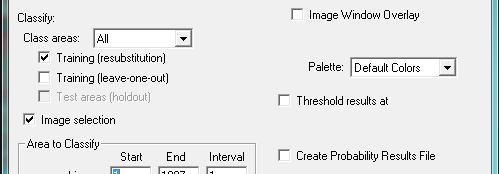
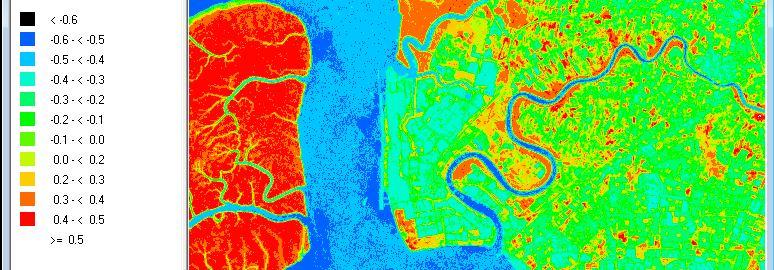
10 The area standing for by the ground survey point (sample unit) should be consistent with the resolution of the remote sensing image used for classification. It is suggested to use Systematic Non-Aligned Sampling (SNAS) method to determine the sampling location in the field. Figure 2 shows the concept of this sampling method. The whole mapping region is divided into sub-regions, and in each sub-region equal number of points are sampled, whose location can be randomly distributed. Figure 2 Systematic Non-Aligned Sampling 5. Landuse classification example: Supervised classification using Multispec software. Exercise Title 1 Display and Inspection of Image Data 2 Image Enhancement 3 Unsupervised Classification (Cluster Analysis) 4 Supervised Classification - Select Training Fields 5 Overlay Shape Files on Image Window 6 Selecting Areas and the Coordinate View 7 Creating Vegetation Indices Images 6. Landuse change analysis example: Change detection using QuantumGIS Exercise Title 1 Vector data preparation 2 Using Analysis Tool for changes analysis 3 Analysis of landuse changes result 4 Producing Map 10

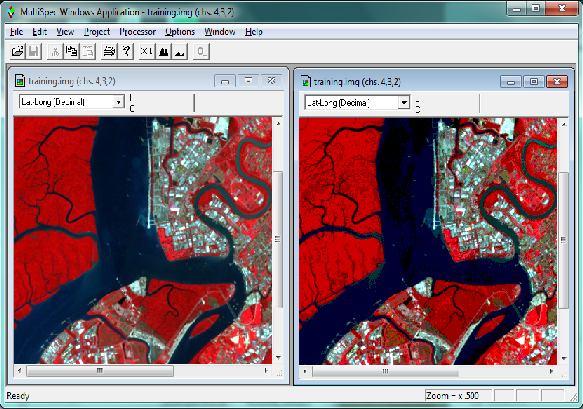
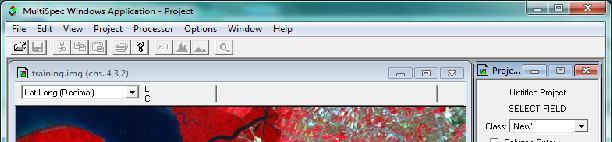
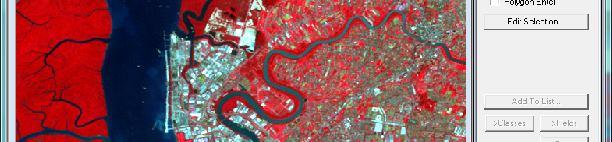
11 1 training img the Landsat satellite Klang, Selangor training.img raining raining.img Klang, Selangor 4 January

12 raining 2 5

13 eight. 7 North
14 2 5

15 2 training.img 15
16 5
17 5
18 15

19 3 training.img training.img 15
20 2 15
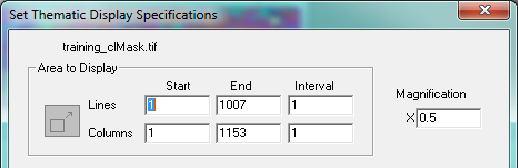
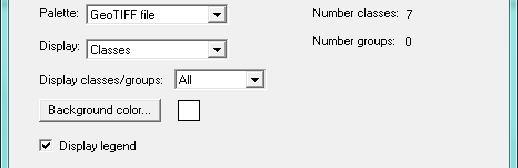
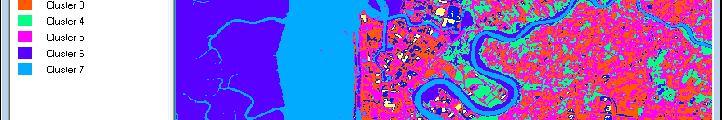
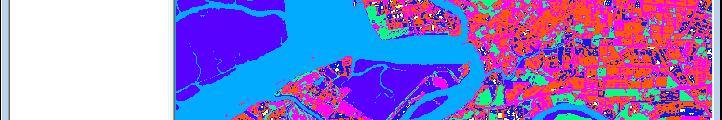
21 raining_clmask.tif 15

22 aterbody 5

23 4 training.img 5


24 Waterbody our Urban & built-up, Horticulture, Oil Palm, Bareland 5
25 5
26 5

27 ) 5

28 5
29 5

30 5 raining img district_boundary raining.img raining 5 5 training.img district_boundary Training 5
31

32 6 training
33 6 training and training_wgs 0 5

34 7 training.img training.img 0 5
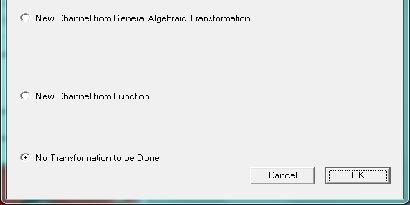
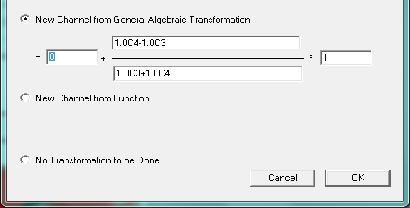
35 0 1 15

36 training.img
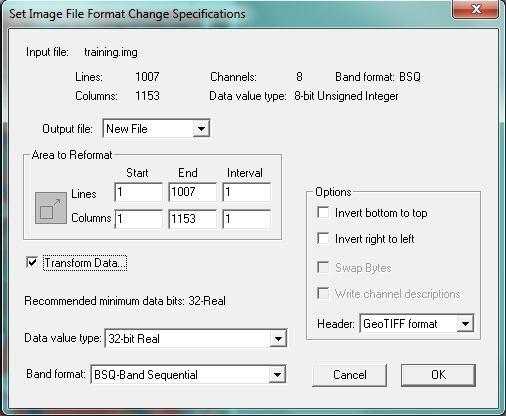
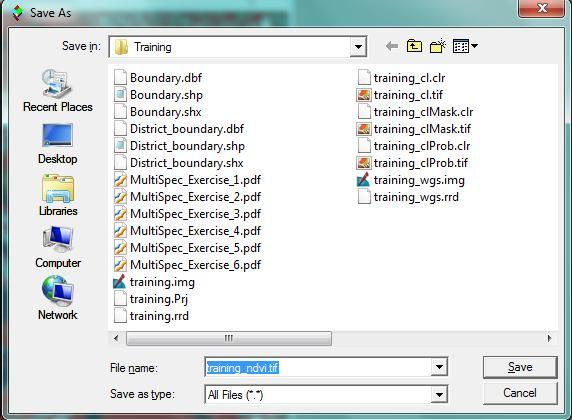
37 20 15
38 ,159 0
39 0
40 0
41 What is QGIS Quantum GIS (QGIS) Exercise : Working with vector and change detection QGIS is a user friendly Open Source Geographic Information System (GIS) licensed under the GNU General Public License that you helps you visualize, manage, edit, analyze, and compose maps with geographic data. QGIS is an official project of the Open Source Geospatial Foundation (OSGeo). It runs on Linux, Unix, Mac OSX, Windows and Android and supports numerous vector, raster, and database formats and functionalities. QGIS provides a continously growing number of capabilities provided by core functions and plugins QGIS GUI QGIS GUI can be divided into 6 main components: Menu Bar 2. Tool Bar 3. Map Legend 4. Map View 5. Status Bar
42 1. Working with vector data Vector data is arguably the most common kind of data you will find in the daily use of GIS. It describes geographic data in terms of points, that may be connected into lines and polygons. Every object in a vector dataset is called a feature, and is associated with data that describes that feature. Vector data can be change in term of size, position and colors. 1.1 Start QGIS using the icon on the desktop or from QGIS Desktop from Startup Menu. 1.2 Select menu Layer and choose Add Vector Layer 1.3 At the dialog box vector layer, browse to c:\latihan\selangor_utm47.shp and road_selangor_utm47.shp 1.4 Try to change the color of the polygon and line
43 2. Working with raster data Raster data in GIS are matrices of discrete cells that represent features on, above or below the earth s surface. Each cell in the raster grid is the same size, and cells are usually rectangular (in QGIS they will always be rectangular). Typical raster datasets include remote sensing data, such as aerial photography, or satellite imagery and modelled data, such as an elevation matrix. Unlike vector data, raster data typically do not have an associated database record for each cell. They are geocoded by pixel resolution and the x/y coordinate of a corner pixel of the raster layer. This allows QGIS to position the data correctly in the map canvas. QGIS makes use of georeference information inside the raster layer (e.g., GeoTiff) or in an appropriate world file to properly display the data 2.1 Select menu Layer and choose Add Raster Layer 2.2 At the dialog box raster layer browse to c:\latihan\training_clmask.tif

 3.")
44 3. Raster to vector Converting between raster and vector formats allows you to make use of both raster and vector data when solving a GIS problem, as well as using the various analysis methods unique to these two forms of geographic data. This increases the flexibility you have when considering data sources and processing methods for solving a GIS problem. To combine a raster and vector analysis, you need to convert the one type of data to the other. Let s convert the raster result of the previous lesson to a vector. The goal for this lesson: To get the raster result into a vector that can be used to complete the analysis. 3.1 Select menu Raster > Conversion and choose Polygonize (Raster to Vector) 3.2 At the raster to vector dialog box, browse the input file to folder c:\latihan\training_clmask.tif 3.3 At the output file, save the output to c:\latihan\training_clmask_vector.shp 3.4 Type Code to the field name 3.5 Click close when finish
 GIS data has two parts")


45 4. Working with Attributes (Open Attribute Table) GIS data has two parts - features and attributes. Attributes are structured data about each feature. Here you can make query, add another column, calculate area etc Right click on the layer and choose Open Attribute Table 4.2 Area Calculation in hectare 4.1 Click Start editing 4.2 Click Open Field Calculator Save the changes

 is very important.")


46 5. Layer Symbology The symbology of a layer is its visual appearance on the map. The basic strength of GIS over other ways of representing data with spatial aspects is that with GIS, you have a dynamic visual representation of the data you re working with. Therefore, the visual appearance of the map (which depends on the symbology of the individual layers) is very important. The end user of the maps you produce will need to be able to easily see what the map represents. Equally as important, you need to be able to explore the data as you re working with it, and good symbology helps a lot. In other words, having proper symbology is not a luxury or just nice to have. In fact, it s essential for you to use a GIS properly and produce maps and information that people will be able to use. The goal for this lesson: To be able to create any symbology you want for any vector layer. 5.1 Right click on the layer and choose Properties 52 Layer Properties dialog box will appear and follow the step below


47 6. Vector Analysis (Change Detection using Intersect processing) Vector data can also be analyzed to reveal how different features interact with each other in space. There are many different analysis-related functions in GIS, such as union, intersect, merge etc Select Menu Vector and choose Geoprocessing Tools and click Intersect 6.2 The Intersect dialog box will appear and follow the step below Reference:
Data: a collection of numbers or facts that require further processing before they are meaningful
 Digital Image Classification Data vs. Information Data: a collection of numbers or facts that require further processing before they are meaningful Information: Derived knowledge from raw data. Something
Lab 5: Image Analysis with ArcGIS 10 Unsupervised Classification
 Lab 5: Image Analysis with ArcGIS 10 Unsupervised Classification Peter E. Price TerraView 2010 Peter E. Price All rights reserved Revised 03/2011 Revised for Geob 373 by BK Feb 28, 2017. V3 The information
Digital Image Classification Geography 4354 Remote Sensing
 Digital Image Classification Geography 4354 Remote Sensing Lab 11 Dr. James Campbell December 10, 2001 Group #4 Mark Dougherty Paul Bartholomew Akisha Williams Dave Trible Seth McCoy Table of Contents:
Bharath Setturu Research scholar, EWRG, Center for Ecological Sciences, IISc, Bangalore & EWRG-CES IIIT-HYDERABAD
 Bharath Setturu Research scholar, EWRG, Center for Ecological Sciences, IISc, Bangalore settur@ces.iisc.ernet.in & IIIT-HYDERABAD Introduction to QGIS oquantum GIS (QGIS) is a GIS tool for managing geographical
Land Cover Classification Techniques
 Land Cover Classification Techniques supervised classification and random forests Developed by remote sensing specialists at the USFS Geospatial Technology and Applications Center (GTAC), located in Salt
Bharath Setturu Research scholar, EWRG, Center for Ecological Sciences, IISc, Bangalore & IIIT-HYDERABAD
 Bharath Setturu Research scholar, EWRG, Center for Ecological Sciences, IISc, Bangalore settur@ces.iisc.ernet.in & IIIT-HYDERABAD Introduction to QGIS oquantum GIS (QGIS) is a GIS tool for managing geographical
Classify Multi-Spectral Data Classify Geologic Terrains on Venus Apply Multi-Variate Statistics
 Classify Multi-Spectral Data Classify Geologic Terrains on Venus Apply Multi-Variate Statistics Operations What Do I Need? Classify Merge Combine Cross Scan Score Warp Respace Cover Subscene Rotate Translators
Lab #4 Introduction to Image Processing II and Map Accuracy Assessment
 FOR 324 Natural Resources Information Systems Lab #4 Introduction to Image Processing II and Map Accuracy Assessment (Adapted from the Idrisi Tutorial, Introduction Image Processing Exercises, Exercise
ArcGIS Pro: Image Segmentation, Classification, and Machine Learning. Jeff Liedtke and Han Hu
 ArcGIS Pro: Image Segmentation, Classification, and Machine Learning Jeff Liedtke and Han Hu Overview of Image Classification in ArcGIS Pro Overview of the classification workflow Classification tools
MODULE 1 BASIC LIDAR TECHNIQUES
 MODULE SCENARIO One of the first tasks a geographic information systems (GIS) department using lidar data should perform is to check the quality of the data delivered by the data provider. The department
Figure 1: Workflow of object-based classification
 Technical Specifications Object Analyst Object Analyst is an add-on package for Geomatica that provides tools for segmentation, classification, and feature extraction. Object Analyst includes an all-in-one
Using ArcGIS for Landcover Classification. Presented by CORE GIS May 8, 2012
 Using ArcGIS for Landcover Classification Presented by CORE GIS May 8, 2012 How to use ArcGIS for Image Classification 1. Find and download the right data 2. Have a look at the data (true color/false color)
Lab 9. Julia Janicki. Introduction
 Lab 9 Julia Janicki Introduction My goal for this project is to map a general land cover in the area of Alexandria in Egypt using supervised classification, specifically the Maximum Likelihood and Support
IMAGINE Objective. The Future of Feature Extraction, Update & Change Mapping
 IMAGINE ive The Future of Feature Extraction, Update & Change Mapping IMAGINE ive provides object based multi-scale image classification and feature extraction capabilities to reliably build and maintain
COMBINING HIGH SPATIAL RESOLUTION OPTICAL AND LIDAR DATA FOR OBJECT-BASED IMAGE CLASSIFICATION
 COMBINING HIGH SPATIAL RESOLUTION OPTICAL AND LIDAR DATA FOR OBJECT-BASED IMAGE CLASSIFICATION Ruonan Li 1, Tianyi Zhang 1, Ruozheng Geng 1, Leiguang Wang 2, * 1 School of Forestry, Southwest Forestry
DIGITAL IMAGE ANALYSIS. Image Classification: Object-based Classification
 DIGITAL IMAGE ANALYSIS Image Classification: Object-based Classification Image classification Quantitative analysis used to automate the identification of features Spectral pattern recognition Unsupervised
Notes: Notes: Notes: Notes:
 NR406 GIS Applications in Fire Ecology & Management Lesson 2 - Overlay Analysis in GIS Gathering Information from Multiple Data Layers One of the many strengths of a GIS is that you can stack several data
Geographic Information Systems. using QGIS
 Geographic Information Systems using QGIS 1 - INTRODUCTION Generalities A GIS (Geographic Information System) consists of: -Computer hardware -Computer software - Digital Data Generalities GIS softwares
Classification (or thematic) accuracy assessment. Lecture 8 March 11, 2005
 accuracy assessment. Lecture 8 March 11, 2005") Classification (or thematic) accuracy assessment Lecture 8 March 11, 2005 Why and how Remote sensing-derived thematic information are becoming increasingly important. Unfortunately, they contain errors.
Classification (or thematic) accuracy assessment Lecture 8 March 11, 2005 Why and how Remote sensing-derived thematic information are becoming increasingly important. Unfortunately, they contain errors.
Working with demographic grids in QGIS
 Working with demographic grids in QGIS Anna Dmowska dmowska@amu.edu.pl April 2017 1. Introduction SocScape (Social Landscape) is a research project which provides open access to high resolution (30 m)
Orchard Link Mapping Workshop (QGIS Training) Contact
 Contact") Orchard Link Mapping Workshop (QGIS Training) Contact email: info@neetmaps.co.uk for technical support, bespoke mapping or further information or visit www.neetmaps.co.uk 1 2 1: Introduction to QGIS What
Orchard Link Mapping Workshop (QGIS Training) Contact email: info@neetmaps.co.uk for technical support, bespoke mapping or further information or visit www.neetmaps.co.uk 1 2 1: Introduction to QGIS What
EVALUATION OF CONVENTIONAL DIGITAL CAMERA SCENES FOR THEMATIC INFORMATION EXTRACTION ABSTRACT
 EVALUATION OF CONVENTIONAL DIGITAL CAMERA SCENES FOR THEMATIC INFORMATION EXTRACTION H. S. Lim, M. Z. MatJafri and K. Abdullah School of Physics Universiti Sains Malaysia, 11800 Penang ABSTRACT A study
GEOBIA for ArcGIS (presentation) Jacek Urbanski
 Jacek Urbanski") GEOBIA for ArcGIS (presentation) Jacek Urbanski INTEGRATION OF GEOBIA WITH GIS FOR SEMI-AUTOMATIC LAND COVER MAPPING FROM LANDSAT 8 IMAGERY Presented at 5th GEOBIA conference 21 24 May in Thessaloniki.
GEOBIA for ArcGIS (presentation) Jacek Urbanski INTEGRATION OF GEOBIA WITH GIS FOR SEMI-AUTOMATIC LAND COVER MAPPING FROM LANDSAT 8 IMAGERY Presented at 5th GEOBIA conference 21 24 May in Thessaloniki.
Classifying. Stuart Green Earthobservation.wordpress.com MERMS 12 - L4
 Classifying Stuart Green Earthobservation.wordpress.com Stuart.Green@Teagasc.ie MERMS 12 - L4 Classifying Replacing the digital numbers in each pixel (that tell us the average spectral properties of everything
ENVI. Get the Information You Need from Imagery.
 Visual Information Solutions ENVI. Get the Information You Need from Imagery. ENVI is the premier software solution to quickly, easily, and accurately extract information from geospatial imagery. Easy
Attribute Accuracy. Quantitative accuracy refers to the level of bias in estimating the values assigned such as estimated values of ph in a soil map.
 Attribute Accuracy Objectives (Entry) This basic concept of attribute accuracy has been introduced in the unit of quality and coverage. This unit will teach a basic technique to quantify the attribute
GST 105: Introduction to Remote Sensing Lab 5: Unsupervised Classification
 GST 105: Introduction to Remote Sensing Lab 5: Unsupervised Classification Objective Perform an unsupervised classification Document Version: 2014-07-15 (Beta) Author: Richard : Smith, Ph.D. Texas A&M
Understanding Geospatial Data Models
 Understanding Geospatial Data Models 1 A geospatial data model is a formal means of representing spatially referenced information. It is a simplified view of physical entities and a conceptualization of
(Refer Slide Time: 0:51)
") Introduction to Remote Sensing Dr. Arun K Saraf Department of Earth Sciences Indian Institute of Technology Roorkee Lecture 16 Image Classification Techniques Hello everyone welcome to 16th lecture in
Introduction to Remote Sensing Dr. Arun K Saraf Department of Earth Sciences Indian Institute of Technology Roorkee Lecture 16 Image Classification Techniques Hello everyone welcome to 16th lecture in
Aerial photography: Principles. Visual interpretation of aerial imagery
 Aerial photography: Principles Visual interpretation of aerial imagery Overview Introduction Benefits of aerial imagery Image interpretation Elements Tasks Strategies Keys Accuracy assessment Benefits
A Practical Guide to Using QGIS
 A Practical Guide to Using QGIS 1.1 INTRODUCTION Quantum GIS (QGIS) is a useful mapping software that enables the compilation and displaying of spatial data in the form of a map. Gaining experience in
MGF 2014 Performances of UAV and WorldView-2 Images for Individual Canopy Delineation in Tropical Forest
 MGF 2014 Performances of UAV and WorldView-2 Images for Individual Canopy Delineation in Tropical Forest Hamdan Omar Div. of Forestry & Environment, Forest Research Institute Malaysia (FRIM) Malaysia Geospatial
GIS Basics for Urban Studies
 GIS Basics for Urban Studies Date: March 21, 2018 Contacts: Mehdi Aminipouri, Graduate Peer GIS Faciliator, SFU Library (maminipo@sfu.ca) Keshav Mukunda, GIS & Map Librarian Librarian for Geography (kmukunda@sfu.ca)
APPLICATION OF SOFTMAX REGRESSION AND ITS VALIDATION FOR SPECTRAL-BASED LAND COVER MAPPING
 APPLICATION OF SOFTMAX REGRESSION AND ITS VALIDATION FOR SPECTRAL-BASED LAND COVER MAPPING J. Wolfe a, X. Jin a, T. Bahr b, N. Holzer b, * a Harris Corporation, Broomfield, Colorado, U.S.A. (jwolfe05,
GST 105: Introduction to Remote Sensing Lab 6: Supervised Classification
 GST 105: Introduction to Remote Sensing Lab 6: Supervised Classification Objective Perform a Supervised classification Document Version: 2014-08-08 (Beta) Author: Richard : Smith, Ph.D. Texas A&M University
Geomatica II Course guide
 Course guide Geomatica Version 2017 SP4 2017 PCI Geomatics Enterprises, Inc. All rights reserved. COPYRIGHT NOTICE Software copyrighted by PCI Geomatics Enterprises, Inc., 90 Allstate Parkway, Suite 501
Object-Based Classification & ecognition. Zutao Ouyang 11/17/2015
 Object-Based Classification & ecognition Zutao Ouyang 11/17/2015 What is Object-Based Classification The object based image analysis approach delineates segments of homogeneous image areas (i.e., objects)
MultiSpec Tutorial. January 11, Program Concept and Introduction Notes by David Landgrebe and Larry Biehl. MultiSpec Programming by Larry Biehl
 MultiSpec Tutorial January 11, 2001 Program Concept and Introduction Notes by David Landgrebe and Larry Biehl MultiSpec Programming by Larry Biehl School of Electrical and Computer Engineering Purdue University
GIS Data Collection. This chapter reviews the main methods of GIS data capture and transfer and introduces key practical management issues.
 9 GIS Data Collection OVERVIEW This chapter reviews the main methods of GIS data capture and transfer and introduces key practical management issues. It distinguishes between primary (direct measurement)
Introducing ArcScan for ArcGIS
 Introducing ArcScan for ArcGIS An ESRI White Paper August 2003 ESRI 380 New York St., Redlands, CA 92373-8100, USA TEL 909-793-2853 FAX 909-793-5953 E-MAIL info@esri.com WEB www.esri.com Copyright 2003
Introduction to using QGIS for Archaeology and History Workshop by the Empirical Reasoning Center
 Introduction to using QGIS for Archaeology and History Workshop by the Empirical Reasoning Center In this workshop, we will cover the basics of working with spatial data, as well as its main uses for archaeology.
v Working with Rasters SMS 12.1 Tutorial Requirements Raster Module Map Module Mesh Module Time minutes Prerequisites Overview Tutorial
 v. 12.1 SMS 12.1 Tutorial Objectives This tutorial teaches how to import a Raster, view elevations at individual points, change display options for multiple views of the data, show the 2D profile plots,
Welcome to NR402 GIS Applications in Natural Resources. This course consists of 9 lessons, including Power point presentations, demonstrations,
 Welcome to NR402 GIS Applications in Natural Resources. This course consists of 9 lessons, including Power point presentations, demonstrations, readings, and hands on GIS lab exercises. Following the last
AN INTEGRATED APPROACH TO AGRICULTURAL CROP CLASSIFICATION USING SPOT5 HRV IMAGES
 AN INTEGRATED APPROACH TO AGRICULTURAL CROP CLASSIFICATION USING SPOT5 HRV IMAGES Chang Yi 1 1,2,*, Yaozhong Pan 1, 2, Jinshui Zhang 1, 2 College of Resources Science and Technology, Beijing Normal University,
CHAPTER 5 OBJECT ORIENTED IMAGE ANALYSIS
 85 CHAPTER 5 OBJECT ORIENTED IMAGE ANALYSIS 5.1 GENERAL Urban feature mapping is one of the important component for the planning, managing and monitoring the rapid urbanized growth. The present conventional
The Feature Analyst Extension for ERDAS IMAGINE
 The Feature Analyst Extension for ERDAS IMAGINE Automated Feature Extraction Software for GIS Database Maintenance We put the information in GIS SM A Visual Learning Systems, Inc. White Paper September
GPS Located Accuracy Assessment Plots on the Modoc National Forest
 This file was created by scanning the printed publication. Errors identified by the software have been corrected; however, some errors may remain. GPS Located Accuracy Assessment Plots on the Modoc National
The Gain setting for Landsat 7 (High or Low Gain) depends on: Sensor Calibration - Application. the surface cover types of the earth and the sun angle
 depends on: Sensor Calibration - Application. the surface cover types of the earth and the sun angle") Sensor Calibration - Application Station Identifier ASN Scene Center atitude 34.840 (34 3'0.64"N) Day Night DAY Scene Center ongitude 33.03270 (33 0'7.72"E) WRS Path WRS Row 76 036 Corner Upper eft atitude
Sensor Calibration - Application Station Identifier ASN Scene Center atitude 34.840 (34 3'0.64"N) Day Night DAY Scene Center ongitude 33.03270 (33 0'7.72"E) WRS Path WRS Row 76 036 Corner Upper eft atitude
All data is in Universal Transverse Mercator (UTM) Zone 6 projection, and WGS 84 datum.
 Zone 6 projection, and WGS 84 datum.") 111 Mulford Hall, College of Natural Resources, UC Berkeley (510) 643-4539 EXPLORING MOOREA DATA WITH QUANTUM GIS In this exercise, you will be using an open-source FREE GIS software, called Quantum GIS,
111 Mulford Hall, College of Natural Resources, UC Berkeley (510) 643-4539 EXPLORING MOOREA DATA WITH QUANTUM GIS In this exercise, you will be using an open-source FREE GIS software, called Quantum GIS,
Raster Classification with ArcGIS Desktop. Rebecca Richman Andy Shoemaker
 Raster Classification with ArcGIS Desktop Rebecca Richman Andy Shoemaker Raster Classification What is it? - Classifying imagery into different land use/ land cover classes based on the pixel values of
CROP MAPPING WITH SENTINEL-2 JULY 2017, SPAIN
 _p TRAINING KIT LAND01 CROP MAPPING WITH SENTINEL-2 JULY 2017, SPAIN Table of Contents 1 Introduction to RUS... 3 2 Crop mapping background... 3 3 Training... 3 3.1 Data used... 3 3.2 Software in RUS environment...
INTRODUCTION TO GIS WORKSHOP EXERCISE
 111 Mulford Hall, College of Natural Resources, UC Berkeley (510) 643-4539 INTRODUCTION TO GIS WORKSHOP EXERCISE This exercise is a survey of some GIS and spatial analysis tools for ecological and natural
General Digital Image Utilities in ERDAS
 General Digital Image Utilities in ERDAS These instructions show you how to use the basic utilities of stacking layers, converting vectors, and sub-setting or masking data for use in ERDAS Imagine 9.x
Introduction to digital image classification
 Introduction to digital image classification Dr. Norman Kerle, Wan Bakx MSc a.o. INTERNATIONAL INSTITUTE FOR GEO-INFORMATION SCIENCE AND EARTH OBSERVATION Purpose of lecture Main lecture topics Review
Aardobservatie en Data-analyse Image processing
 Aardobservatie en Data-analyse Image processing 1 Image processing: Processing of digital images aiming at: - image correction (geometry, dropped lines, etc) - image calibration: DN into radiance or into
Geographical Information Systems Institute. Center for Geographic Analysis, Harvard University. LAB EXERCISE 1: Basic Mapping in ArcMap
 Harvard University Introduction to ArcMap Geographical Information Systems Institute Center for Geographic Analysis, Harvard University LAB EXERCISE 1: Basic Mapping in ArcMap Individual files (lab instructions,
Introduction to the Google Earth Engine Workshop
 Introduction to the Google Earth Engine Workshop This workshop will introduce the user to the Graphical User Interface (GUI) version of the Google Earth Engine. It assumes the user has a basic understanding
RASTER ANALYSIS S H A W N L. P E N M A N E A R T H D A T A A N A LY S I S C E N T E R U N I V E R S I T Y O F N E W M E X I C O
 RASTER ANALYSIS S H A W N L. P E N M A N E A R T H D A T A A N A LY S I S C E N T E R U N I V E R S I T Y O F N E W M E X I C O TOPICS COVERED Spatial Analyst basics Raster / Vector conversion Raster data
OS OpenData masterclass 2013 Cartographic Design workshop
 OS OpenData masterclass 2013 Cartographic Design workshop 1 Quantum GIS Quantum GIS (QGIS) is a user-friendly Open Source Geographic Information System (GIS,) licensed under the GNU General Public License.
RASTER ANALYSIS GIS Analysis Winter 2016
 RASTER ANALYSIS GIS Analysis Winter 2016 Raster Data The Basics Raster Data Format Matrix of cells (pixels) organized into rows and columns (grid); each cell contains a value representing information.
NRM435 Spring 2017 Accuracy Assessment of GIS Data
 Accuracy Assessment Lab Page 1 of 18 NRM435 Spring 2017 Accuracy Assessment of GIS Data GIS data always contains errors hopefully the errors are so small that will do not significantly affect the results
Integration of airborne LiDAR and hyperspectral remote sensing data to support the Vegetation Resources Inventory and sustainable forest management
 Integration of airborne LiDAR and hyperspectral remote sensing data to support the Vegetation Resources Inventory and sustainable forest management Executive Summary This project has addressed a number
v SMS Tutorials Working with Rasters Prerequisites Requirements Time Objectives
 v. 12.2 SMS 12.2 Tutorial Objectives Learn how to import a Raster, view elevations at individual points, change display options for multiple views of the data, show the 2D profile plots, and interpolate
Class #2. Data Models: maps as models of reality, geographical and attribute measurement & vector and raster (and other) data structures
 data structures") Class #2 Data Models: maps as models of reality, geographical and attribute measurement & vector and raster (and other) data structures Role of a Data Model Levels of Data Model Abstraction GIS as Digital
Class #2 Data Models: maps as models of reality, geographical and attribute measurement & vector and raster (and other) data structures Role of a Data Model Levels of Data Model Abstraction GIS as Digital
GY301 Geomorphology Lab 5 Topographic Map: Final GIS Map Construction
 GY301 Geomorphology Lab 5 Topographic Map: Final GIS Map Construction Introduction This document describes how to take the data collected with the total station for the campus topographic map project and
Image Classification. RS Image Classification. Present by: Dr.Weerakaset Suanpaga
 Image Classification Present by: Dr.Weerakaset Suanpaga D.Eng(RS&GIS) 6.1 Concept of Classification Objectives of Classification Advantages of Multi-Spectral data for Classification Variation of Multi-Spectra
Raster Data Model & Analysis
 Topics: 1. Understanding Raster Data 2. Adding and displaying raster data in ArcMap 3. Converting between floating-point raster and integer raster 4. Converting Vector data to Raster 5. Querying Raster
EVALUATION OF THE THEMATIC INFORMATION CONTENT OF THE ASTER-VNIR IMAGERY IN URBAN AREAS BY CLASSIFICATION TECHNIQUES
 EVALUATION OF THE THEMATIC INFORMATION CONTENT OF THE ASTER-VNIR IMAGERY IN URBAN AREAS BY CLASSIFICATION TECHNIQUES T. G. Panagou a *, G. Ch. Miliaresis a a TEI, Dpt. of Topography, 3 P.Drakou Str., Thiva,
Glacier Mapping and Monitoring
 Glacier Mapping and Monitoring Exercises Tobias Bolch Universität Zürich TU Dresden tobias.bolch@geo.uzh.ch Exercise 1: Visualizing multi-spectral images with Erdas Imagine 2011 a) View raster data: Open
GOVERNMENT GAZETTE REPUBLIC OF NAMIBIA
 GOVERNMENT GAZETTE OF THE REPUBLIC OF NAMIBIA N$7.20 WINDHOEK - 7 October 2016 No. 6145 CONTENTS Page GENERAL NOTICE No. 406 Namibia Statistics Agency: Data quality standard for the purchase, capture,
Imagery and Raster Data in ArcGIS. Abhilash and Abhijit
 Imagery and Raster Data in ArcGIS Abhilash and Abhijit Agenda Imagery in ArcGIS Mosaic datasets Raster processing ArcGIS is a Comprehensive Imagery System Integrating All Types, Sources, and Sensor Models
Introduction to QGIS
 Introduction to QGIS David Kramar, Ph.D. Minnesota State University Moorhead Department of Anthropology and Earth Science http://www.qgis.org/en/site/ Overview of Workshop What is QGIS? How do I get QGIS
Hands on Exercise Using ecognition Developer
 1 Hands on Exercise Using ecognition Developer 2 Hands on Exercise Using ecognition Developer Hands on Exercise Using ecognition Developer Go the Windows Start menu and Click Start > All Programs> ecognition
GIS OPERATION MANUAL
 GIS OPERATION MANUAL 1. Computer System Description Hardware Make Compaq Presario 5004 CPU AMD Athlon 1.1 Ghz Main Memory 640MB CD-ROM 52 X CD-RW 8 X HD 57GB Monitor 19 inch Video Adapter 16 Mb Nvidia
A Vector Agent-Based Unsupervised Image Classification for High Spatial Resolution Satellite Imagery
 A Vector Agent-Based Unsupervised Image Classification for High Spatial Resolution Satellite Imagery K. Borna 1, A. B. Moore 2, P. Sirguey 3 School of Surveying University of Otago PO Box 56, Dunedin,
GIS Workbook #1. GIS Basics and the ArcGIS Environment. Helen Goodchild
 GIS Basics and the ArcGIS Environment Helen Goodchild Overview of Geographic Information Systems Geographical Information Systems (GIS) are used to display, manipulate and analyse spatial data (data that
Main concepts of ILWIS 3.0
 CHAPTER 2 Main concepts of ILWIS 3.0 In chapter one, Introduction to ILWIS, you started with ILWIS, and learned the basics of the user interface. This chapter presents some key concepts of ILWIS. In section
Image Classification. Introduction to Photogrammetry and Remote Sensing (SGHG 1473) Dr. Muhammad Zulkarnain Abdul Rahman
 Dr. Muhammad Zulkarnain Abdul Rahman") Image Classification Introduction to Photogrammetry and Remote Sensing (SGHG 1473) Dr. Muhammad Zulkarnain Abdul Rahman Classification Multispectral classification may be performed using a variety of methods,
Image Classification Introduction to Photogrammetry and Remote Sensing (SGHG 1473) Dr. Muhammad Zulkarnain Abdul Rahman Classification Multispectral classification may be performed using a variety of methods,
Object Based Image Analysis: Introduction to ecognition
 Object Based Image Analysis: Introduction to ecognition ecognition Developer 9.0 Description: We will be using ecognition and a simple image to introduce students to the concepts of Object Based Image
STUDENT PAGES GIS Tutorial Treasure in the Treasure State
 STUDENT PAGES GIS Tutorial Treasure in the Treasure State Copyright 2015 Bear Trust International GIS Tutorial 1 Exercise 1: Make a Hand Drawn Map of the School Yard and Playground Your teacher will provide
Automated Extraction of Buildings from Aerial LiDAR Point Cloud and Digital Imaging Datasets for 3D Cadastre - Preliminary Results
 Automated Extraction of Buildings from Aerial LiDAR Point Cloud and Digital Imaging Datasets for 3D Pankaj Kumar 1*, Alias Abdul Rahman 1 and Gurcan Buyuksalih 2 ¹Department of Geoinformation Universiti
GRASS GIS - Introduction
 GRASS GIS - Introduction What is a GIS A system for managing geographic data. Information about the shapes of objects. Information about attributes of those objects. Spatial variation of measurements across
ENHANCEMENT OF THE DOUBLE FLEXIBLE PACE SEARCH THRESHOLD DETERMINATION FOR CHANGE VECTOR ANALYSIS
 ENHANCEMENT OF THE DOUBLE FLEXIBLE PACE SEARCH THRESHOLD DETERMINATION FOR CHANGE VECTOR ANALYSIS S. A. Azzouzi a,b,, A. Vidal a, H. A. Bentounes b a Instituto de Telecomunicaciones y Aplicaciones Multimedia
Exercise 1: Introduction to ILWIS with the Riskcity dataset
 Exercise 1: Introduction to ILWIS with the Riskcity dataset Expected time: 2.5 hour Data: data from subdirectory: CENN_DVD\ILWIS_ExerciseData\IntroRiskCity Objectives: After this exercise you will be able
Defining Remote Sensing
 Defining Remote Sensing Remote Sensing is a technology for sampling electromagnetic radiation to acquire and interpret non-immediate geospatial data from which to extract information about features, objects,
Will talk primarily about our image processing mapping efforts and not the photo interpreted data set.
 Will talk primarily about our image processing mapping efforts and not the photo interpreted data set. I am going to move quickly and touch on major points. If I picque your curiosity about something,
Introduction to LiDAR
 Introduction to LiDAR Our goals here are to introduce you to LiDAR data. LiDAR data is becoming common, provides ground, building, and vegetation heights at high accuracy and detail, and is available statewide.
RASTER ANALYSIS GIS Analysis Fall 2013
 RASTER ANALYSIS GIS Analysis Fall 2013 Raster Data The Basics Raster Data Format Matrix of cells (pixels) organized into rows and columns (grid); each cell contains a value representing information. What
Geological mapping using open
 Geological mapping using open source QGIS MOHSEN ALSHAGHDARI -2017- Abstract Geological mapping is very important to display your field work in a map for geologist and others, many geologists face problems
Using Imagery for Intelligence Analysis
 2013 Esri International User Conference July 8 12, 2013 San Diego, California Technical Workshop Using Imagery for Intelligence Analysis Renee Bernstein Natalie Campos Esri UC2013. Technical Workshop.
v SMS 12.3 Tutorial GIS P Prerequisites Time Requirements Objectives
 v. 12.3 SMS 12.3 Tutorial Objectives This tutorial demonstrates how to import data, visualize it, and convert it into SMS coverage data that could be used to build a numeric model. This tutorial will instruct
Review of Cartographic Data Types and Data Models
 Review of Cartographic Data Types and Data Models GIS Data Models Raster Versus Vector in GIS Analysis Fundamental element used to represent spatial features: Raster: pixel or grid cell. Vector: x,y coordinate
Geomatics 89 (National Conference & Exhibition) May 2010
 May 2010") Evaluation of the Pixel Based and Object Based Classification Methods For Monitoring Of Agricultural Land Cover Case study: Biddinghuizen - The Netherlands Hossein Vahidi MSc Student of Geoinformatics
Evaluation of the Pixel Based and Object Based Classification Methods For Monitoring Of Agricultural Land Cover Case study: Biddinghuizen - The Netherlands Hossein Vahidi MSc Student of Geoinformatics
Lecture 06. Raster and Vector Data Models. Part (1) Common Data Models. Raster. Vector. Points. Points. ( x,y ) Area. Area Line.
 Common Data Models. Raster. Vector. Points. Points. ( x,y ) Area. Area Line.") Lecture 06 Raster and Vector Data Models Part (1) 1 Common Data Models Vector Raster Y Points Points ( x,y ) Line Area Line Area 2 X 1 3 Raster uses a grid cell structure Vector is more like a drawn map
Lecture 06 Raster and Vector Data Models Part (1) 1 Common Data Models Vector Raster Y Points Points ( x,y ) Line Area Line Area 2 X 1 3 Raster uses a grid cell structure Vector is more like a drawn map
Nearest Clustering Algorithm for Satellite Image Classification in Remote Sensing Applications
 Nearest Clustering Algorithm for Satellite Image Classification in Remote Sensing Applications Anil K Goswami 1, Swati Sharma 2, Praveen Kumar 3 1 DRDO, New Delhi, India 2 PDM College of Engineering for
An Introduction to Lidar & Forestry May 2013
 An Introduction to Lidar & Forestry May 2013 Introduction to Lidar & Forestry Lidar technology Derivatives from point clouds Applied to forestry Publish & Share Futures Lidar Light Detection And Ranging
Roberto Cardoso Ilacqua. QGis Handbook for Supervised Classification of Areas. Santo André
 Roberto Cardoso Ilacqua QGis Handbook for Supervised Classification of Areas Santo André 2017 Roberto Cardoso Ilacqua QGis Handbook for Supervised Classification of Areas This manual was designed to assist
Design based validation of the MODIS Global Burned Area Product
 Design based validation of the MODIS Global Burned Area Product Luigi Boschetti1, David Roy2, Chris Justice3, Steve Stehman4 1 University of Idaho, Department of Forest, Rangeland and Fire Sciences 2 South
START>PROGRAMS>ARCGIS>
 Department of Urban Studies and Planning Spring 2006 Department of Architecture Site and Urban Systems Planning 11.304J / 4.255J GIS EXERCISE 2 Objectives: To generate the following maps using ArcGIS Software:
Spatial Data Models. Raster uses individual cells in a matrix, or grid, format to represent real world entities
 Spatial Data Models Raster uses individual cells in a matrix, or grid, format to represent real world entities Vector uses coordinates to store the shape of spatial data objects David Tenenbaum GEOG 7