First-level fmri modeling
|
|
|
- Jeremy Joseph
- 5 years ago
- Views:
Transcription
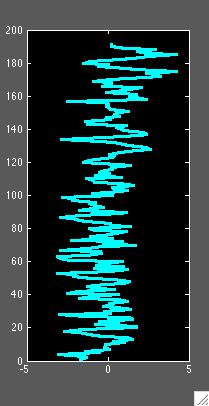
1 First-level fmri modeling Monday, Lecture 3 Jeanette Mumford University of Wisconsin - Madison What do we need to remember from the last lecture? What is the general structure of a t- statistic? How about the specific structure for the GLM? What is the residual? What are the assumptions we make with the linear model (Gauss Markov)? Task on Goal in fmri analysis Find voxels with BOLD time series that look like this 1

2 Task on Goal in fmri analysis Find voxels with BOLD time series that look like this btw, does this remind you of anything?? Y 1 Y 2 Y 3 Y 4 Y 5 Y 6 Y 7 Y 8. Y 197 Y 198 Y 199 Y = apple Delay of BOLD response Voxel with signal Voxel no signal Voxel signal and drift 2
3 Voxel with signal Voxel no signal Voxel signal and drift Voxel with signal Voxel no signal Voxel signal and drift Starts off high BOLD issues BOLD response is delayed Convolution FIR modeling BOLD time series suffer from low frequency noise Highpass filtering Prewhitening Precoloring Scaling the data Grand mean scaling Intensity normalization 3

4 Recall the GLM Single voxel time series Recall the basic structure of a t-statistic How to make a good model Explain as much variability in the data as possible If you miss something it will go into the residual error, e Big residuals Big variance Small t stat 4
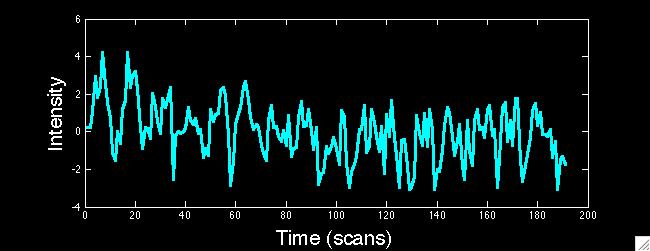
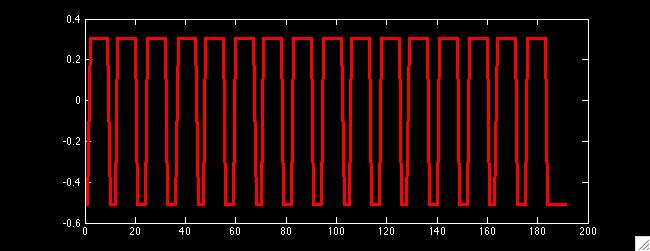
5 Understanding the data Time series drifts down in beginning BOLD response is delayed Simplest Model = Simplest Model = 5


6 Simplest Model Simplest Model Modeling the delay Hemodynamic response function Real data was used to find good models for the hemodynamic response Stimulus HRF (double gamma) 6
7 Convolution Combine HRF and expected neural response Typically model derivative of convolved HRF to adjust for small differences in onset (<1s) Different HRF s Too symmetric Basic shape okay, but no post stimulus undershoot Includes post stimulus undershoot Different HRF s Too symmetric Basic shape okay, but no post stimulus undershoot Includes post stimulus undershoot 7


8 Different HRF s Too symmetric Basic shape okay, but no post stimulus undershoot Includes post stimulus undershoot How convolution is actually done Since timing of trials will not occur on TR and to use a better resolution HRF, we convolve in a finer time resolution Otherwise any trial occurring at any point during the period of the TR will look exactly the same in the model Usampling/downsampling 8
 Fit H/W/T separately Works okay-ish Finite impulse response model FIR Make no assumption about the shape of the HRF 9")
9 Assumptions of canonical HRF BOLD increases linearly Dale & Buckner, 1997 Assumptions of canonical HRF The width, height and delay are correct Lindquist & Wager (2007) Fit H/W/T separately Works okay-ish Finite impulse response model FIR Make no assumption about the shape of the HRF 9

10 Constrained basis set Lower the number of regressors in the model by using a basis set Constrained to shapes that are reasonable for HRF shapes Constrained basis set Basis set HRF possibilities FLOBS fmrib Linear Optimal Basis Sets Generates a set of basis sets to model signal Specify ranges for different portions of the hrf 10
11 Comparison More thoughts about canonical HRF Advantages: Simpler analysis Easily interpretable outcome Simplifies group analysis Disadvantages Biased if canonical HRF is incorrect Unbiased basis sets Advantages Not biased towards a particular shape Allows testing of hypotheses about specific HRF parameters Disadvantages Less powerful Makes group analysis more difficult Tend to overfit the data (i.e., fit noise) 11
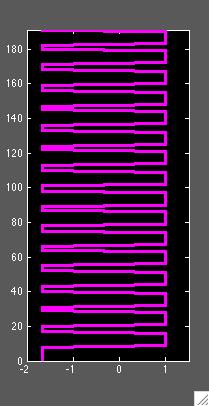
12 We can make a design matrix! Start with task blocks or delta functions Convolve Estimate the GLM and carry out hypothesis! Convolved Boxcar Convolved Boxcar 12


13 The Noise White noise All frequencies have similar power Not a problem for OLS Colored noise Has structure OLS needs help! More Noise Sources Head motion Cardiac noise What about the drift? Respiratory noise Scanner noise 13
 More noise Low frequency noise Average spectrum of principal components (Mitra & Pesaran, Biophysical Journal, 1999)")
14 What the noise looks like 1/f structure Power spectra of noise data (Zarahn, Aguirre, D Esposito, NI, 1997) More noise Average spectrum of principal components (Mitra & Pesaran, Biophysical Journal, 1999) More noise Low frequency noise Average spectrum of principal components (Mitra & Pesaran, Biophysical Journal, 1999) 14
15 More noise Breathing Average spectrum of principal components (Mitra & Pesaran, Biophysical Journal, 1999) More noise Cardiac Average spectrum of principal components (Mitra & Pesaran, Biophysical Journal, 1999) The 1-2 punch Punch 1: Highpass filtering FSL uses gaussian weighted running line smoother SPM fits a DCT basis set Punch 2: Prewhitening We ll get to that later There s also a thing called lowpass filtering (precoloring), but generally it isn t so great and nobody uses it 15


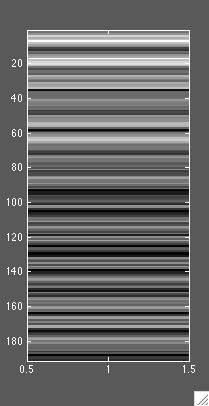
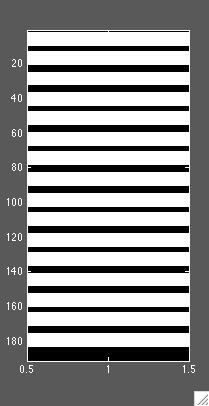
16 Highpass filtering Simply hack off the low frequency noise SPM: Adds a discrete cosine transform basis set to design matrix Highpass filtering FSL: Gaussian-weighted running line smoother Step 1: Fit a Gaussian weighted running line Highpass filtering FSL: Gaussian-weighted running line smoother Step 1: Fit a Gaussian weighted running line Fit at time t is a weighted average of data around t 16


 If it wasn t filtered,")
17 Highpass filtering Step 2: Subtract Gaussian weighted running line fit IMPORTANT: Must apply filter to both the data and the design. FSL has apply temporal filter box in design setup. Leave it checked! Highpass filtered design (FSL) If it wasn t filtered, this trend wouldn t be here. Highpass filtering Filter below.01 Hz 17
 High-pass Filtering Removes the worst of the low frequency trends High-pass From S.")
18 Filter cutoff High, but not higher than paradigm frequency Look at power spectrum of your design and base cutoff on that Block design: Longer than 1 task cycle usually twice the task cycle Event related design: Larger than 66 s (based on the power spectrum of a canonical HRF of a single response) High-pass Filtering Removes the worst of the low frequency trends High-pass From S. Smith Highpass filtering What does it do to the signal?? Signal Power spectrum Lowpass filter Highpass filter Woolrich et al, NI
19 Highpass filtering What does it do to the signal?? Signal Power spectrum Lowpass filter Highpass filter Highpass filtering What does it do to the signal?? Signal Power spectrum Lowpass filter Highpass filter Filtering conclusions Lowpass filtering Idea is to swamp out high frequency noise Easily removes important signal in ER designs Choose cutoff to remove noise, but avoid your signal Highpass filtering Removes low frequency drift We typically avoid designs with low frequencies, so highpass filtering is always used 19
20 Bandpass filtering High and lowpass filtering Common in functional connectivity analysis since it allows you to focus on a specific frequency Not typically used in standard fmri analyses Model with HP filter Parameter of interest = Model with HP filter Parameter of interest = Use contrast c=( ) 20

21 Convolution & HP filter Punch 2: Prewhitening Highpass filtering Analogous to using a roller to paint a wall you can t get the edges very neatly Prewhitening More precise estimate of correlation like using a brush for the edges Prewhitening Remember Gauss Markov? If our errors are distributed with mean 0, constant variance and not temporally autocorrelated then our estimates are unbiased and have the smallest variance of all unbiased estimators. Uh oh, (even after highpass filtering) 21
22 Find K such that Prewhitening Premultiply GLM by K Find K such that Prewhitening Premultiply GLM by K Awesome! G-M holds for our *new* model Whitening OLS can be used on whitened model 22

23 Prewhitening Step 1: Fit the linear regression ignoring temporal autocorrelation Step 2: Use residuals from first regression to estimate temporal autocorrelation to obtain K Step 3: Create prewhitened model and estimate in usual way Estimating V We don t know V, so we estimate it There s a bias problem. SPM uses a global covariance estimate to help with this FSL uses a local estimate, but smoothes it Tends to follow 1/f trend Autoregressive (AR) models fit it well fmri noise 23


24 Whitening SPM Globally estimates correlation Correlation of time series averaged over voxels Structured correlation estimate Scaled AR(1) with correlation 0.2 plus white noise Whitening SPM Only 2 parameters are estimated Convolution, HP filter, Whitening 24
 Forces each volume of 4D dataset to have")
25 Scaling Grand Mean Scaling Removes intersession variance in global signal due to changes in gain of scanner amplification Allows us to combine data across subjects Whole 4D data set is scaled by a single number Automatically done in software packages Doesn t change variability between time points Scaling Proportional scaling (Intensity normalization) Forces each volume of 4D dataset to have the same mean Also done by modeling the global signal Idea is to remove background activity Problems can occur if true activation is wide spread Negative activations may result 25

26 Intensity Normalizaton without with Junghofer et al, 2004, NI Signal is lost and negative activation artifacts Other modeling considerations Adding the derivative of the HRF Adding motion parameters to the model Model HRF & Derivative
27 Shifted HRF 1. 2 Blue line is sum of 1 HRF and its derivative Temporal derivative We model the derivative, but don t study inferences of it Linquist, et al (NI, 2008) suggest this is a bad idea may lead to bias If there s time later, I ll show you how to incorporate the derivative parameter estimate Collinearity When designing your study, you want your tasks to be uncorrelated Correlation between regressors lowers the efficiency of the parameter estimation Parameter estimates are highly variable Can even flip signs 27

28 Why is it a problem? Why is it a problem? There are an infinite # of solutions for and etc Collinearity illustration Cor= -0.2 X 1 X 2 Cor=0.96 X 1 X 2 28
29 Highly variable over experiments Intercept X 1 X 2 Correlated Regressors Inflated for correlated case (green) T statistic Bias can go in either direction Highly variable over experiments Intercept X 1 X 2 Correlated Regressors Inflated for correlated case (green) T statistic Bias can go in either direction Highly variable over experiments Intercept X 1 X 2 Correlated Regressors Inflated for correlated case (green) T statistic stats are smaller (due to inflated variance) 29


30 Residuals don t change The designs explain the same amount of variability Collinearity You can t fix it after the data have been collected You can t tell from the t statistic if you had collinearity FSL has some diagnostics Absolute value of correlation Bad=white off diagonal Eigenvalues from SVD Bad=near 0 Variance Inflation Factor That matrix is okay, but only points out one type of collinearity What if X 1 =X 2 +X 3? Cor(X 1,X 2 ) or Cor(X 1,X 3 ) won t catch this well 30
31 Variance Inflation Factor That matrix is okay, but only points out one type of collinearity What if X 1 =X 2 +X 3? Cor(X 1,X 2 ) or Cor(X 1,X 3 ) won t catch this well Oh wait, that thing in the previous bullet point looks like a regression equation! Variance Inflation Factor If one regressor is a linear combination of others, we could see that in a linear regression Assume 3 regressors To check for any collinearity with X 1, run the following regression X 1 = X X 3 + Variance Inflation Factor If the regression fits well, then we have a problem Assess fit of regression by correlating X 1 with the estimate of X 1 using the model Cor(X 1, ˆ0 + ˆ1X 2 + ˆ2X 3 )=Cor(X 1, c X 1 ) 31
32 2 6 4 X 1 X 2 X Example cor(x 1, X 2 ) =cor(x 1, X 3 ) =.39 X 1 = 1 X X 3 What s the solution for the betas? 7X 1 = X c 1 =) cor X 1, c X 1 = X 1 X 2 X Example cor(x 1, X 2 ) =cor(x 1, X 3 ) =.39 X 1 = 1 X X 3 What s the solution for the betas? 7X 1 = X c 1 =) cor X 1, c X 1 = X 1 X 2 X Example cor(x 1, X 2 ) =cor(x 1, X 3 ) =.39 X 1 = 1 X X 3 What s the solution for the betas? 7X 1 = X c 1 =) cor X 1, c X 1 =1 5 32
33 2 6 4 X 1 X 2 X Example cor(x 1, X 2 ) =cor(x 1, X 3 ) =.39 X 1 = 1 X X 3 What s the solution for the betas? 7X 1 = X c 1 =) cor X 1, c X 1 =1 5 What is this correlation? Squaring this gives the model s R 2 value R 2 =[Cor(X 1, c X 1 )] 2 Finish VIF VIF uses the model s R 2 1 VIF = 1 R 2 = 1 1 [cor(x 1, X c 1 )] 2 Goal: VIF < 5 As long as it isn t >10, you re probably okay 33
34 Summary of collinearity Parameter estimates are highly variable when collinearity is present Technically, inferences are still valid! Outliers could possibly cause problems Power takes a hit due to inflated variance Collinearity is directly related to efficiency You are now first level modeling experts! What canonical HRF will you use in SPM? What does adding the derivative do? How can you incorporate the derivative s parameter estimate in the activation magnitude You are now first level modeling experts! How many parameters does SPM use in the whitening matrix? What two things remove low frequency noise in fmri data? Can you trust p-values from models with collinearity? 34
35 You are now first level modeling experts! Should you ever model the global mean in task fmri data? Break! 35
Percent Change and Power Calculation NITP 2010
 Percent Change and Power Calculation NITP 2010 Outline Calculating %-change How to do it What featquery does Why %-Change? As it is, parameter estimates do not reflect a specific unit T-stats are okay
FMRI Pre-Processing and Model- Based Statistics
 FMRI Pre-Processing and Model- Based Statistics Brief intro to FMRI experiments and analysis FMRI pre-stats image processing Simple Single-Subject Statistics Multi-Level FMRI Analysis Advanced FMRI Analysis
Efficiency and design optimization
 Efficiency and design optimization Tuesday, Lecture 3 Jeanette Mumford University of Wisconsin - Madison Thanks to Tom Liu for letting me use some of his slides! What is the best way to increase your power?
Journal of Articles in Support of The Null Hypothesis
 Data Preprocessing Martin M. Monti, PhD UCLA Psychology NITP 2016 Typical (task-based) fmri analysis sequence Image Pre-processing Single Subject Analysis Group Analysis Journal of Articles in Support
Introduction to Neuroimaging Janaina Mourao-Miranda
 Introduction to Neuroimaging Janaina Mourao-Miranda Neuroimaging techniques have changed the way neuroscientists address questions about functional anatomy, especially in relation to behavior and clinical
Basic Introduction to Data Analysis. Block Design Demonstration. Robert Savoy
 Basic Introduction to Data Analysis Block Design Demonstration Robert Savoy Sample Block Design Experiment Demonstration Use of Visual and Motor Task Separability of Responses Combined Visual and Motor
Quality Checking an fmri Group Result (art_groupcheck)
") Quality Checking an fmri Group Result (art_groupcheck) Paul Mazaika, Feb. 24, 2009 A statistical parameter map of fmri group analyses relies on the assumptions of the General Linear Model (GLM). The assumptions
Quality Checking an fmri Group Result (art_groupcheck) Paul Mazaika, Feb. 24, 2009 A statistical parameter map of fmri group analyses relies on the assumptions of the General Linear Model (GLM). The assumptions
Function-Structure Integration in FreeSurfer
 Function-Structure Integration in FreeSurfer Outline Function-Structure Integration Function-Structure Registration in FreeSurfer fmri Analysis Preprocessing First-Level Analysis Higher-Level (Group) Analysis
the PyHRF package P. Ciuciu1,2 and T. Vincent1,2 Methods meeting at Neurospin 1: CEA/NeuroSpin/LNAO
 Joint detection-estimation of brain activity from fmri time series: the PyHRF package Methods meeting at Neurospin P. Ciuciu1,2 and T. Vincent1,2 philippe.ciuciu@cea.fr 1: CEA/NeuroSpin/LNAO www.lnao.fr
FSL Pre-Processing Pipeline
 The Art and Pitfalls of fmri Preprocessing FSL Pre-Processing Pipeline Mark Jenkinson FMRIB Centre, University of Oxford FSL Pre-Processing Pipeline Standard pre-processing: Task fmri Resting-state fmri
Serial Correlation and Heteroscedasticity in Time series Regressions. Econometric (EC3090) - Week 11 Agustín Bénétrix
 - Week 11 Agustín Bénétrix") Serial Correlation and Heteroscedasticity in Time series Regressions Econometric (EC3090) - Week 11 Agustín Bénétrix 1 Properties of OLS with serially correlated errors OLS still unbiased and consistent
Serial Correlation and Heteroscedasticity in Time series Regressions Econometric (EC3090) - Week 11 Agustín Bénétrix 1 Properties of OLS with serially correlated errors OLS still unbiased and consistent
FSL Pre-Processing Pipeline
 The Art and Pitfalls of fmri Preprocessing FSL Pre-Processing Pipeline Mark Jenkinson FMRIB Centre, University of Oxford FSL Pre-Processing Pipeline Standard pre-processing: Task fmri Resting-state fmri
Extending the GLM. Outline. Mixed effects motivation Evaluating mixed effects methods Three methods. Conclusions. Overview
 Extending the GLM So far, we have considered the GLM for one run in one subject The same logic can be applied to multiple runs and multiple subjects GLM Stats For any given region, we can evaluate the
7/15/2016 ARE YOUR ANALYSES TOO WHY IS YOUR ANALYSIS PARAMETRIC? PARAMETRIC? That s not Normal!
 ARE YOUR ANALYSES TOO PARAMETRIC? That s not Normal! Martin M Monti http://montilab.psych.ucla.edu WHY IS YOUR ANALYSIS PARAMETRIC? i. Optimal power (defined as the probability to detect a real difference)
Tutorial BOLD Module
 m a k i n g f u n c t i o n a l M R I e a s y n o r d i c B r a i n E x Tutorial BOLD Module Please note that this tutorial is for the latest released nordicbrainex. If you are using an older version please
NA-MIC National Alliance for Medical Image Computing fmri Data Analysis
 NA-MIC fmri Data Analysis Sonia Pujol, Ph.D. Wendy Plesniak, Ph.D. Randy Gollub, M.D., Ph.D. Acknowledgments NIH U54EB005149 Neuroimage Analysis Center NIH P41RR013218 FIRST Biomedical Informatics Research
Event-related design efficiency and How to plot fmri time series. Sepideh Sadaghiani NeuroSpin Methods Meeting 15. Sept. 2008
 Event-related design efficiency and How to plot fmri time series Sepideh Sadaghiani NeuroSpin Methods Meeting 15. Sept. 2008 Event-related averaging or FIR? event-related fmri ability to average responses
Journal of Statistical Software
 JSS Journal of Statistical Software January 2014, Volume 56, Issue 9. http://www.jstatsoft.org/ POBE: A Computer Program for Optimal Design of Multi-Subject Blocked fmri Experiments Bärbel Maus University
EMPIRICALLY INVESTIGATING THE STATISTICAL VALIDITY OF SPM, FSL AND AFNI FOR SINGLE SUBJECT FMRI ANALYSIS
 EMPIRICALLY INVESTIGATING THE STATISTICAL VALIDITY OF SPM, FSL AND AFNI FOR SINGLE SUBJECT FMRI ANALYSIS Anders Eklund a,b,c, Thomas Nichols d, Mats Andersson a,c, Hans Knutsson a,c a Department of Biomedical
Basic fmri Design and Analysis. Preprocessing
 Basic fmri Design and Analysis Preprocessing fmri Preprocessing Slice timing correction Geometric distortion correction Head motion correction Temporal filtering Intensity normalization Spatial filtering
Functional MRI in Clinical Research and Practice Preprocessing
 Functional MRI in Clinical Research and Practice Preprocessing fmri Preprocessing Slice timing correction Geometric distortion correction Head motion correction Temporal filtering Intensity normalization
Analysis of Functional MRI Timeseries Data Using Signal Processing Techniques
 Analysis of Functional MRI Timeseries Data Using Signal Processing Techniques Sea Chen Department of Biomedical Engineering Advisors: Dr. Charles A. Bouman and Dr. Mark J. Lowe S. Chen Final Exam October
HST.583 Functional Magnetic Resonance Imaging: Data Acquisition and Analysis Fall 2006
 MIT OpenCourseWare http://ocw.mit.edu HST.583 Functional Magnetic Resonance Imaging: Data Acquisition and Analysis Fall 2006 For information about citing these materials or our Terms of Use, visit: http://ocw.mit.edu/terms.
Intro to ARMA models. FISH 507 Applied Time Series Analysis. Mark Scheuerell 15 Jan 2019
 Intro to ARMA models FISH 507 Applied Time Series Analysis Mark Scheuerell 15 Jan 2019 Topics for today Review White noise Random walks Autoregressive (AR) models Moving average (MA) models Autoregressive
SPM8 for Basic and Clinical Investigators. Preprocessing. fmri Preprocessing
 SPM8 for Basic and Clinical Investigators Preprocessing fmri Preprocessing Slice timing correction Geometric distortion correction Head motion correction Temporal filtering Intensity normalization Spatial
Estimation Efficiency and Statistical Power in Arterial Spin Labeling FMRI.
 Title: Estimation Efficiency and Statistical Power in Arterial Spin Labeling FMRI. Authors: Jeanette A. Mumford 3 Luis Hernandez-Garcia 1, Gregory R. Lee 1, Thomas E. Nichols 1,3 1 University of Michigan
Introduction to fmri. Pre-processing
 Introduction to fmri Pre-processing Tibor Auer Department of Psychology Research Fellow in MRI Data Types Anatomical data: T 1 -weighted, 3D, 1/subject or session - (ME)MPRAGE/FLASH sequence, undistorted
Optimal Spline Smoothing of fmri Time Series by Generalized Cross-Validation 1
 DEPARTMENT OF STATISTICS University of Wisconsin 1210 West Dayton St. Madison, WI 53706 TECHNICAL REPORT NO. 1058 June 25, 2002 Optimal Spline Smoothing of fmri Time Series by Generalized Cross-Validation
Experimental Design for fmri OHBM Advanced fmri Educational Course Thomas Liu UCSD Center for Func6onal MRI
 Experimental Design for fmri OHBM Advanced fmri Educational Course 2014 Thomas Liu UCSD Center for Func6onal MRI Experimental Design Design 1 Condition 1 Condition 2 Condition 3 Design 2 Why worry about
Analysis of fmri data within Brainvisa Example with the Saccades database
 Analysis of fmri data within Brainvisa Example with the Saccades database 18/11/2009 Note : All the sentences in italic correspond to informations relative to the specific dataset under study TP participants
Independent Component Analysis of fmri Data
 Independent Component Analysis of fmri Data Denise Miller April 2005 Introduction Techniques employed to analyze functional magnetic resonance imaging (fmri) data typically use some form of univariate
Medical Image Analysis
 Medical Image Analysis Instructor: Moo K. Chung mchung@stat.wisc.edu Lecture 10. Multiple Comparisons March 06, 2007 This lecture will show you how to construct P-value maps fmri Multiple Comparisons 4-Dimensional
Single Subject Demo Data Instructions 1) click "New" and answer "No" to the "spatially preprocess" question.
 click New and answer No to the spatially preprocess question.") (1) conn - Functional connectivity toolbox v1.0 Single Subject Demo Data Instructions 1) click "New" and answer "No" to the "spatially preprocess" question. 2) in "Basic" enter "1" subject, "6" seconds
(1) conn - Functional connectivity toolbox v1.0 Single Subject Demo Data Instructions 1) click "New" and answer "No" to the "spatially preprocess" question. 2) in "Basic" enter "1" subject, "6" seconds
Data Visualisation in SPM: An introduction
 Data Visualisation in SPM: An introduction Alexa Morcom Edinburgh SPM course, April 2010 Centre for Cognitive & Neural Systems/ Department of Psychology University of Edinburgh Visualising results remembered
EPI Data Are Acquired Serially. EPI Data Are Acquired Serially 10/23/2011. Functional Connectivity Preprocessing. fmri Preprocessing
 Functional Connectivity Preprocessing Geometric distortion Head motion Geometric distortion Head motion EPI Data Are Acquired Serially EPI Data Are Acquired Serially descending 1 EPI Data Are Acquired
OLS Assumptions and Goodness of Fit
 OLS Assumptions and Goodness of Fit A little warm-up Assume I am a poor free-throw shooter. To win a contest I can choose to attempt one of the two following challenges: A. Make three out of four free
The problem we have now is called variable selection or perhaps model selection. There are several objectives.
 STAT-UB.0103 NOTES for Wednesday 01.APR.04 One of the clues on the library data comes through the VIF values. These VIFs tell you to what extent a predictor is linearly dependent on other predictors. We
MultiVariate Bayesian (MVB) decoding of brain images
 decoding of brain images") MultiVariate Bayesian (MVB) decoding of brain images Alexa Morcom Edinburgh SPM course 2015 With thanks to J. Daunizeau, K. Brodersen for slides stimulus behaviour encoding of sensorial or cognitive state?
MultiVariate Bayesian (MVB) decoding of brain images Alexa Morcom Edinburgh SPM course 2015 With thanks to J. Daunizeau, K. Brodersen for slides stimulus behaviour encoding of sensorial or cognitive state?
Data Visualisation in SPM: An introduction
 Data Visualisation in SPM: An introduction Alexa Morcom Edinburgh SPM course, April 2015 SPMmip [-30, 3, -9] 3 Visualising results remembered vs. fixation contrast(s) < < After the results table - what
Multivariate Pattern Classification. Thomas Wolbers Space and Aging Laboratory Centre for Cognitive and Neural Systems
 Multivariate Pattern Classification Thomas Wolbers Space and Aging Laboratory Centre for Cognitive and Neural Systems Outline WHY PATTERN CLASSIFICATION? PROCESSING STREAM PREPROCESSING / FEATURE REDUCTION
SPM8 for Basic and Clinical Investigators. Preprocessing
 SPM8 for Basic and Clinical Investigators Preprocessing fmri Preprocessing Slice timing correction Geometric distortion correction Head motion correction Temporal filtering Intensity normalization Spatial
Controlling for multiple comparisons in imaging analysis. Wednesday, Lecture 2 Jeanette Mumford University of Wisconsin - Madison
 Controlling for multiple comparisons in imaging analysis Wednesday, Lecture 2 Jeanette Mumford University of Wisconsin - Madison Motivation Run 100 hypothesis tests on null data using p
Version. Getting Started: An fmri-cpca Tutorial
 Version 11 Getting Started: An fmri-cpca Tutorial 2 Table of Contents Table of Contents... 2 Introduction... 3 Definition of fmri-cpca Data... 3 Purpose of this tutorial... 3 Prerequisites... 4 Used Terms
Statistical Analysis of Neuroimaging Data. Phebe Kemmer BIOS 516 Sept 24, 2015
 Statistical Analysis of Neuroimaging Data Phebe Kemmer BIOS 516 Sept 24, 2015 Review from last time Structural Imaging modalities MRI, CAT, DTI (diffusion tensor imaging) Functional Imaging modalities
Supplementary Figure 1. Decoding results broken down for different ROIs
 Supplementary Figure 1 Decoding results broken down for different ROIs Decoding results for areas V1, V2, V3, and V1 V3 combined. (a) Decoded and presented orientations are strongly correlated in areas
FEAT 3 - Advanced FMRI Analysis
 FEAT 3 - Advanced FMRI Analysis Pipeline overview Advanced preprocessing steps Motion artefact correction Physiological noise correction Demeaning EVs Advanced designs: Parametric designs and F- tests
White Pixel Artifact. Caused by a noise spike during acquisition Spike in K-space <--> sinusoid in image space
 White Pixel Artifact Caused by a noise spike during acquisition Spike in K-space sinusoid in image space Susceptibility Artifacts Off-resonance artifacts caused by adjacent regions with different
An Empirical Comparison of SPM Preprocessing Parameters to the Analysis of fmri Data
 NeuroImage 17, 19 28 (2002) doi:10.1006/nimg.2002.1113 An Empirical Comparison of SPM Preprocessing Parameters to the Analysis of fmri Data Valeria Della-Maggiore, Wilkin Chau, Pedro R. Peres-Neto,* and
FMA901F: Machine Learning Lecture 3: Linear Models for Regression. Cristian Sminchisescu
 FMA901F: Machine Learning Lecture 3: Linear Models for Regression Cristian Sminchisescu Machine Learning: Frequentist vs. Bayesian In the frequentist setting, we seek a fixed parameter (vector), with value(s)
Introductory Concepts for Voxel-Based Statistical Analysis
 Introductory Concepts for Voxel-Based Statistical Analysis John Kornak University of California, San Francisco Department of Radiology and Biomedical Imaging Department of Epidemiology and Biostatistics
Functional MRI data preprocessing. Cyril Pernet, PhD
 Functional MRI data preprocessing Cyril Pernet, PhD Data have been acquired, what s s next? time No matter the design, multiple volumes (made from multiple slices) have been acquired in time. Before getting
Last time... Coryn Bailer-Jones. check and if appropriate remove outliers, errors etc. linear regression
 Machine learning, pattern recognition and statistical data modelling Lecture 3. Linear Methods (part 1) Coryn Bailer-Jones Last time... curse of dimensionality local methods quickly become nonlocal as
CS/NEUR125 Brains, Minds, and Machines. Due: Wednesday, April 5
 CS/NEUR125 Brains, Minds, and Machines Lab 8: Using fmri to Discover Language Areas in the Brain Due: Wednesday, April 5 In this lab, you will analyze fmri data from an experiment that was designed to
Detecting Brain Activations in Functional Magnetic Resonance Imaging (fmri) Experiments with a Maximum Cross-Correlation Statistic
 Experiments with a Maximum Cross-Correlation Statistic") Journal of Data Science 10(2012), 403-418 Detecting Brain Activations in Functional Magnetic Resonance Imaging (fmri) Experiments with a Maximum Cross-Correlation Statistic Kinfemichael Gedif 1, William
Journal of Data Science 10(2012), 403-418 Detecting Brain Activations in Functional Magnetic Resonance Imaging (fmri) Experiments with a Maximum Cross-Correlation Statistic Kinfemichael Gedif 1, William
EECS 556 Image Processing W 09. Image enhancement. Smoothing and noise removal Sharpening filters
 EECS 556 Image Processing W 09 Image enhancement Smoothing and noise removal Sharpening filters What is image processing? Image processing is the application of 2D signal processing methods to images Image
Missing Data Analysis for the Employee Dataset
 Missing Data Analysis for the Employee Dataset 67% of the observations have missing values! Modeling Setup For our analysis goals we would like to do: Y X N (X, 2 I) and then interpret the coefficients
CDAA No. 4 - Part Two - Multiple Regression - Initial Data Screening
 CDAA No. 4 - Part Two - Multiple Regression - Initial Data Screening Variables Entered/Removed b Variables Entered GPA in other high school, test, Math test, GPA, High school math GPA a Variables Removed
Bias in Resampling-Based Thresholding of Statistical Maps in fmri
 Bias in Resampling-Based Thresholding of Statistical Maps in fmri Ola Friman and Carl-Fredrik Westin Laboratory of Mathematics in Imaging, Department of Radiology Brigham and Women s Hospital, Harvard
CS4442/9542b Artificial Intelligence II prof. Olga Veksler
 CS4442/9542b Artificial Intelligence II prof. Olga Veksler Lecture 2 Computer Vision Introduction, Filtering Some slides from: D. Jacobs, D. Lowe, S. Seitz, A.Efros, X. Li, R. Fergus, J. Hayes, S. Lazebnik,
Multivariate pattern classification
 Multivariate pattern classification Thomas Wolbers Space & Ageing Laboratory (www.sal.mvm.ed.ac.uk) Centre for Cognitive and Neural Systems & Centre for Cognitive Ageing and Cognitive Epidemiology Outline
NeuroImaging. (spatial and statistical processing, maybe) Philippe Peigneux, PhD. UR2NF - Neuropsychology and Functional
 Philippe Peigneux, PhD. UR2NF - Neuropsychology and Functional") NeuroImaging (spatial and statistical processing, maybe) Philippe Peigneux, PhD UR2NF - Neuropsychology and Functional Neuroimaging Research Unit, ULB http://dev.ulb.ac.be/ur2nf/ CREDITS These slides have
NeuroImaging (spatial and statistical processing, maybe) Philippe Peigneux, PhD UR2NF - Neuropsychology and Functional Neuroimaging Research Unit, ULB http://dev.ulb.ac.be/ur2nf/ CREDITS These slides have
Adaptive Waveform Inversion: Theory Mike Warner*, Imperial College London, and Lluís Guasch, Sub Salt Solutions Limited
 Adaptive Waveform Inversion: Theory Mike Warner*, Imperial College London, and Lluís Guasch, Sub Salt Solutions Limited Summary We present a new method for performing full-waveform inversion that appears
Introduction to Mixed Models: Multivariate Regression
 Introduction to Mixed Models: Multivariate Regression EPSY 905: Multivariate Analysis Spring 2016 Lecture #9 March 30, 2016 EPSY 905: Multivariate Regression via Path Analysis Today s Lecture Multivariate
Instance-based Learning
 Instance-based Learning Machine Learning 10701/15781 Carlos Guestrin Carnegie Mellon University February 19 th, 2007 2005-2007 Carlos Guestrin 1 Why not just use Linear Regression? 2005-2007 Carlos Guestrin
INDEPENDENT COMPONENT ANALYSIS APPLIED TO fmri DATA: A GENERATIVE MODEL FOR VALIDATING RESULTS
 INDEPENDENT COMPONENT ANALYSIS APPLIED TO fmri DATA: A GENERATIVE MODEL FOR VALIDATING RESULTS V. Calhoun 1,2, T. Adali, 2 and G. Pearlson 1 1 Johns Hopkins University Division of Psychiatric Neuro-Imaging,
Group analysis of fmri data. Why group analysis? What is a population? Reminder: Analysis of data from 1 person. Robert: Roel Willems,
 Reminder: Analysis of data from person Group analysis of fmri data Robert: Roel Willems, FC Donders Centre Nijmegen roel.willems@fcdonders.ru.nl Why group analysis? Results from Robert only apply to Robert
Lab 5: Multi Subject fmri
 USA SPM Short Course April 6-8, 2005 Yale University Lab 5: Multi Subject fmri Rik Henson mailto:rik.henson@mrc-cbu.cam.ac.uk MRC Cognition & Brain Sciences Unit, Cambridge, UK CONTENTS Goals Introduction
Residual Analysis for Detecting Mis-modeling in fmri. (Running title: Detecting Mis-modeling in fmri)
") Residual Analysis for Detecting Mis-modeling in fmri (Running title: Detecting Mis-modeling in fmri) J. M. Loh 1, M. A. Lindquist and T. D. Wager 3 1 Dept of Statistics, Columbia U, New York; Email:meng@stat.columbia.edu,
Residual Analysis for Detecting Mis-modeling in fmri (Running title: Detecting Mis-modeling in fmri) J. M. Loh 1, M. A. Lindquist and T. D. Wager 3 1 Dept of Statistics, Columbia U, New York; Email:meng@stat.columbia.edu,
Section 2.3: Simple Linear Regression: Predictions and Inference
 Section 2.3: Simple Linear Regression: Predictions and Inference Jared S. Murray The University of Texas at Austin McCombs School of Business Suggested reading: OpenIntro Statistics, Chapter 7.4 1 Simple
Missing Data Analysis for the Employee Dataset
 Missing Data Analysis for the Employee Dataset 67% of the observations have missing values! Modeling Setup Random Variables: Y i =(Y i1,...,y ip ) 0 =(Y i,obs, Y i,miss ) 0 R i =(R i1,...,r ip ) 0 ( 1
Lecture 4: Spatial Domain Transformations
 # Lecture 4: Spatial Domain Transformations Saad J Bedros sbedros@umn.edu Reminder 2 nd Quiz on the manipulator Part is this Fri, April 7 205, :5 AM to :0 PM Open Book, Open Notes, Focus on the material
Fitting to a set of data. Lecture on fitting
 Fitting to a set of data Lecture on fitting Linear regression Linear regression Residual is the amount difference between a real data point and a modeled data point Fitting a polynomial to data Could use
Linear Methods for Regression and Shrinkage Methods
 Linear Methods for Regression and Shrinkage Methods Reference: The Elements of Statistical Learning, by T. Hastie, R. Tibshirani, J. Friedman, Springer 1 Linear Regression Models Least Squares Input vectors
EE795: Computer Vision and Intelligent Systems
 EE795: Computer Vision and Intelligent Systems Spring 2012 TTh 17:30-18:45 WRI C225 Lecture 04 130131 http://www.ee.unlv.edu/~b1morris/ecg795/ 2 Outline Review Histogram Equalization Image Filtering Linear
ES-2 Lecture: Fitting models to data
 ES-2 Lecture: Fitting models to data Outline Motivation: why fit models to data? Special case (exact solution): # unknowns in model =# datapoints Typical case (approximate solution): # unknowns in model
3 Nonlinear Regression
 CSC 4 / CSC D / CSC C 3 Sometimes linear models are not sufficient to capture the real-world phenomena, and thus nonlinear models are necessary. In regression, all such models will have the same basic
Session scaling; global mean scaling; block effect; mean intensity scaling
 Types of Scaling Session scaling; global mean scaling; block effect; mean intensity scaling Purpose remove intensity differences between runs (i.e., the mean of the whole time series). whole time series
Digital Image Processing. Lecture 6
 Digital Image Processing Lecture 6 (Enhancement in the Frequency domain) Bu-Ali Sina University Computer Engineering Dep. Fall 2016 Image Enhancement In The Frequency Domain Outline Jean Baptiste Joseph
Convolution Product. Change of wave shape as a result of passing through a linear filter
 Convolution Product Change of wave shape as a result of passing through a linear filter e(t): entry signal (source signal) r(t): impulse response (reflectivity of medium) (a) The spikes are sufficiently
Bayes Net Learning. EECS 474 Fall 2016
 Bayes Net Learning EECS 474 Fall 2016 Homework Remaining Homework #3 assigned Homework #4 will be about semi-supervised learning and expectation-maximization Homeworks #3-#4: the how of Graphical Models
SPRITES Moving Two At the Same Using Game State
 If you recall our collision detection lesson, you ll likely remember that you couldn t move both sprites at the same time unless you hit a movement key for each at exactly the same time. Why was that?
Dense Image-based Motion Estimation Algorithms & Optical Flow
 Dense mage-based Motion Estimation Algorithms & Optical Flow Video A video is a sequence of frames captured at different times The video data is a function of v time (t) v space (x,y) ntroduction to motion
Linear Models in Medical Imaging. John Kornak MI square February 22, 2011
 Linear Models in Medical Imaging John Kornak MI square February 22, 2011 Acknowledgement / Disclaimer Many of the slides in this lecture have been adapted from slides available in talks available on the
Cluster failure: Why fmri inferences for spatial extent have inflated false positive rates
 Supporting Information Appendix Cluster failure: Why fmri inferences for spatial extent have inflated false positive rates Anders Eklund, Thomas Nichols, Hans Knutsson Methods Resting state fmri data Resting
1.12 Optimal Filters (Wiener Filters)
") Random Data 75 1.12 Optimal Filters (Wiener Filters) In calculating turbulent spectra we frequently encounter a noise tail just as the spectrum roles down the inertial subrange (-5/3 slope region) toward
Random Data 75 1.12 Optimal Filters (Wiener Filters) In calculating turbulent spectra we frequently encounter a noise tail just as the spectrum roles down the inertial subrange (-5/3 slope region) toward
CSE 158 Lecture 2. Web Mining and Recommender Systems. Supervised learning Regression
 CSE 158 Lecture 2 Web Mining and Recommender Systems Supervised learning Regression Supervised versus unsupervised learning Learning approaches attempt to model data in order to solve a problem Unsupervised
Big Data Methods. Chapter 5: Machine learning. Big Data Methods, Chapter 5, Slide 1
 Big Data Methods Chapter 5: Machine learning Big Data Methods, Chapter 5, Slide 1 5.1 Introduction to machine learning What is machine learning? Concerned with the study and development of algorithms that
Section 3.2: Multiple Linear Regression II. Jared S. Murray The University of Texas at Austin McCombs School of Business
 Section 3.2: Multiple Linear Regression II Jared S. Murray The University of Texas at Austin McCombs School of Business 1 Multiple Linear Regression: Inference and Understanding We can answer new questions
Regression on SAT Scores of 374 High Schools and K-means on Clustering Schools
 Regression on SAT Scores of 374 High Schools and K-means on Clustering Schools Abstract In this project, we study 374 public high schools in New York City. The project seeks to use regression techniques
Digital Image Processing. Prof. P. K. Biswas. Department of Electronic & Electrical Communication Engineering
 Digital Image Processing Prof. P. K. Biswas Department of Electronic & Electrical Communication Engineering Indian Institute of Technology, Kharagpur Lecture - 21 Image Enhancement Frequency Domain Processing
SPM Introduction. SPM : Overview. SPM: Preprocessing SPM! SPM: Preprocessing. Scott Peltier. FMRI Laboratory University of Michigan
 SPM Introduction Scott Peltier FMRI Laboratory University of Michigan! Slides adapted from T. Nichols SPM! SPM : Overview Library of MATLAB and C functions Graphical user interface Four main components:
Lecture on Modeling Tools for Clustering & Regression
 Lecture on Modeling Tools for Clustering & Regression CS 590.21 Analysis and Modeling of Brain Networks Department of Computer Science University of Crete Data Clustering Overview Organizing data into
CS4442/9542b Artificial Intelligence II prof. Olga Veksler
 CS4442/9542b Artificial Intelligence II prof. Olga Veksler Lecture 8 Computer Vision Introduction, Filtering Some slides from: D. Jacobs, D. Lowe, S. Seitz, A.Efros, X. Li, R. Fergus, J. Hayes, S. Lazebnik,
SPM Introduction SPM! Scott Peltier. FMRI Laboratory University of Michigan. Software to perform computation, manipulation and display of imaging data
 SPM Introduction Scott Peltier FMRI Laboratory University of Michigan Slides adapted from T. Nichols SPM! Software to perform computation, manipulation and display of imaging data 1 1 SPM : Overview Library
Data Analysis and Solver Plugins for KSpread USER S MANUAL. Tomasz Maliszewski
 Data Analysis and Solver Plugins for KSpread USER S MANUAL Tomasz Maliszewski tmaliszewski@wp.pl Table of Content CHAPTER 1: INTRODUCTION... 3 1.1. ABOUT DATA ANALYSIS PLUGIN... 3 1.3. ABOUT SOLVER PLUGIN...
Resources for statistical assistance. Quantitative covariates and regression analysis. Methods for predicting continuous outcomes.
 Resources for statistical assistance Quantitative covariates and regression analysis Carolyn Taylor Applied Statistics and Data Science Group (ASDa) Department of Statistics, UBC January 24, 2017 Department
Final Review CMSC 733 Fall 2014
 Final Review CMSC 733 Fall 2014 We have covered a lot of material in this course. One way to organize this material is around a set of key equations and algorithms. You should be familiar with all of these,
Statistical Methods in functional MRI. False Discovery Rate. Issues with FWER. Lecture 7.2: Multiple Comparisons ( ) 04/25/13
 04/25/13") Statistical Methods in functional MRI Lecture 7.2: Multiple Comparisons 04/25/13 Martin Lindquist Department of iostatistics Johns Hopkins University Issues with FWER Methods that control the FWER (onferroni,
Statistical Methods in functional MRI Lecture 7.2: Multiple Comparisons 04/25/13 Martin Lindquist Department of iostatistics Johns Hopkins University Issues with FWER Methods that control the FWER (onferroni,
SYDE 575: Introduction to Image Processing
 SYDE 575: Introduction to Image Processing Image Enhancement and Restoration in Spatial Domain Chapter 3 Spatial Filtering Recall 2D discrete convolution g[m, n] = f [ m, n] h[ m, n] = f [i, j ] h[ m i,
Week 4: Simple Linear Regression II
 Week 4: Simple Linear Regression II Marcelo Coca Perraillon University of Colorado Anschutz Medical Campus Health Services Research Methods I HSMP 7607 2017 c 2017 PERRAILLON ARR 1 Outline Algebraic properties