NeuroImaging. (spatial and statistical processing, maybe) Philippe Peigneux, PhD. UR2NF - Neuropsychology and Functional
|
|
|
- Gladys Welch
- 5 years ago
- Views:
Transcription
 Philippe Peigneux, PhD")

1 NeuroImaging (spatial and statistical processing, maybe) Philippe Peigneux, PhD UR2NF - Neuropsychology and Functional Neuroimaging Research Unit, ULB
2 CREDITS These slides have been presented during an introductory course to neuroimaging techniques held at the Université Libre de Bruxelles (ULB) October-December Some are original slides, but many are taken from online material available at the following : FMRI 4 NEWBIES SPM - Statistical Parametric Mapping Thanks to the many generous authors who have build this educational material!


3 Philips Achieva 3T, Hôpital Erasme, ULB
4 Attending a poster session at a recent meeting, I was reminded of the old adage To the man who has only a hammer, the whole world looks like a nail. In this case, however, instead of a hammer we had a magnetic resonance imaging (MRI) machine and instead of nails we had a study. Many of the studies summarized in the posters did not seem to be designed to answer questions about the functioning of the brain; neither did they seem to bear on specific questions about the roles of particular brain regions. Rather, they could best be described as exploratory. People were asked to engage in some task while the activity in their brains was monitored, and this activity was then interpreted post hoc. -- Stephen M. Kosslyn (1999). If neuroimaging is the answer, what is the question? Phil Trans R Soc Lond B, 354,
5 Brains Needed "...the single most critical piece of equipment is still the researcher's own brain. All the equipment in the world will not help us if we do not know how to use it properly, which requires more than just knowing how to operate it. Aristotle would not necessarily have been more profound had he owned a laptop and known how to program. What is badly needed now, with all these scanners whirring away, is an understanding of exactly what we are observing, and seeing, and measuring, and wondering about." -- Endel Tulving, interview in Cognitive Neuroscience (2002, Gazzaniga, Ivry & Mangun, Eds., NY: Norton, p. 323)

6 Terminology of fmri Structural (T1) images: - high resolution - to distinguish different types of tissue Functional (T2*) images: - lower spatial resolution - to relate changes in BOLD signal to an experimental manipulation Time series: A large number of images that are acquired in temporal order at a specific rate t Condition A Condition B


7 Terminology of fmri subjects sessions runs single run (U.S.) volume TR = repetition time time required to scan one volume slices voxel

")
8 Terminology of fmri Scan Volume: Field of View (FOV), e.g. 192 mm Axial slices Slice thickness e.g., 3 mm Matrix Size e.g., 64 x 64 3 mm In-plane resolution 192 mm / 64 = 3 mm 3 mm 3 mm Voxel Size (volumetric pixel)
9 Why is fmri analysis so (bloody) complicated? Temporal issues 1. BOLD dynamics 2. Non-linear effects 3. Serial autocorrelations Spatial issues 1. Subject s inter-scan movement 2. Inter-subject brain differences 3. Multiple comparisons across the brain Other issues 1. Low signal-to-noise ratio (SNR) 2. Very expensive 3. Very boring


")


10 Data analysis : getting good data! Image time-series Kernel Design matrix Statistical parametric map (SPM) Realignment Smoothing General linear model Normalisation Statistical inference Gaussian field theory Template Parameter estimates p <0.05
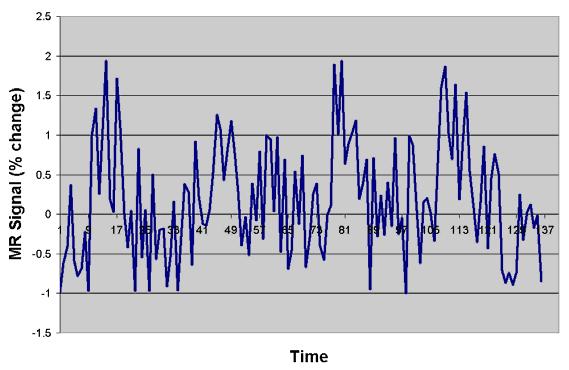
11 High and Low Frequency Noise

")


12 High-Pass Filter Events: SOA = 15s (e.g., stimulus) Blocks: SOA = 120s (e.g., attention) High-pass filter cut-off = min[2 * max(soa)]


 HP cutoff =")
13 High-Pass Filter Before filtering After filtering Events (0.07Hz) Blocks (0.01Hz) HP cutoff = 1/30s = 0.03 Hz
14 High-Pass Filter Good: Cleans data, removing low-frequency drifts unrelated to the experimental paradigm Bad: It can remove signal-related frequencies What to do: Check the frequency spectrum of the design matrix (xx.x), and the smoothed design matrix (xx.xkxs.x), to ensure that the filter is doing the right job AND/OR think well in advance how your stimuli are displayed!
15 Serial autocorrelations (Low-Pass Filter) Individual observations are not mutually independent!! The effective degrees of freedom (d.f.) are reduced Options: Temporal smoothing (impose a known correlation) Good: Does not require a model of correlations Bad: Lower d.f. Gaussian Matched-filter Theorem (e.g., hrf) auto-regressive model of order 1 Estimate intrinsic autocorrelation [e.g. AR(1)] Good: Maximize d.f. Bad: The model used can be wrong Uniform Voxel-specific
16 30 slices

17 Intra-volume time acquisition correction (slice timing)

18 Slice timing Interleaved sequence Ascending sequence
19 Inter-scan movement: Realignment People move, even if they don t realize! Need for motion correction Two steps: 1. Registration: Determine the 6 parameters that describe the rigid-body transformation between each image and a reference image (usu. first in series). 2. Transformation: Resampling each image according to the determined transformation parameters.


20 Inter-scan movement: Realignment Same location in the brain Same location in the grid Rigid body movement: 3 translation parameters 3 rotation parameters z roll x pitch y yaw

21 Realignment: Transformation
 roll (z) Sudden movements are more problematic (especially if correlated with experimental")
22 Realignment: Registration Small movements are corrected well TRANSLATION mm z y x ROTATION rad pitch (x) yaw (y) roll (z) Sudden movements are more problematic (especially if correlated with experimental paradigm)
23 Slide from Duke course can be catastrophically bad


24 Motion Intensity Changes A B C Slide modified from Duke course
25 Motion Spurious Activation at Edges lateral motion in x direction motion in z direction (e.g., padding sinks) brain position time1 time2 stat map time 1 > time 2 time 1 < time 2


26 Structural differences between subjects: Normalization Different People Different Brains!!

27 Normalization Also useful for reporting coordinates in a standard space (e.g., Talairach and Tournoux)


28 Standard space The Talairach Atlas The MNI/ICBM AVG152 Template The MNI template follows the convention of T&T, but doesn t match the particular brain Recommended reading:

29 Why smooth? Remove residual inter-subject brain differences Allow for the use of Gaussian random field theory (coming through )


30 Effects of Spatial Smoothing on Activity Unsmoothed Data Smoothed Data (kernel width 5 voxels) Slide from Duke course
31 Should you spatially smooth? Advantages Increases Signal to Noise Ratio (SNR) Matched Filter Theorem: Maximum increase in SNR by filter with same shape/size as signal Reduces number of comparisons Allows application of Gaussian Field Theory May improve comparisons across subjects Signal may be spread widely across cortex, due to intersubject variability Disadvantages Reduces spatial resolution Challenging to smooth accurately if size/shape of signal is not known Slide from Duke course


32 Other Artifacts Ghosts Zebra Brains Metallic Objects (e.g., hair tie) Spikes
33 Data analysis : a good design cannot harm Image time-series Kernel Design matrix Statistical parametric map (SPM) Realignment Smoothing General linear model Normalisation Statistical inference Gaussian field theory Template Parameter estimates p <0.05

34 Voxel-wise time series analysis model specification Time Time parameter estimation hypothesis statistic single voxel time time series BOLD signal SPM


35 Why do we need stats? We could, in principle, analyze data by voxel surfing: move the cursor over different areas and see if any of the time courses look interesting Slice 9, Voxel 0, 0 Even where there s no brain, there s noise Slice 9, Voxel 1, 0 Slice 9, Voxel 22, 7 The signal is much higher where there is brain, but there s still noise Slice 9, Voxel 9, 27 Here s a voxel that responds well whenever there s visual stimulation Slice 9, Voxel 18, 36 Here s a couple that sort of show the right pattern but is it real? Slice 9, Voxel 13, 41 Here s one that responds well whenever there s intact objects Slice 9, Voxel 14, 42 fmri for Dummies

36 Why do we need stats? Clearly voxel surfing isn t a viable option. We d have to do it 49,152 times in this data set and it would require a lot of subjective decisions about whether activation was real This is why we need statistics The lies and damned lies come in when you write the manuscript Statistics: tell us where to look for activation that is related to our paradigm help us decide how likely it is that activation is real fmri for Dummies
37 Predicted Responses fmri is based on the Blood Oxygenation Level Dependent (BOLD) response It takes about 5 sec for the blood to catch up with the brain We can model the predicted activation in one of two ways: 1. shift the boxcar by approximately 5 seconds (2 images x 2 seconds/image = 4 sec, close enough) 2. convolve the boxcar with the hemodynamic response to model the shape of the true function as well as the delay PREDICTED ACTIVATION IN VISUAL AREA PREDICTED ACTIVATION IN OBJECT AREA BOXCAR SHIFTED CONVOLVED WITH HRF fmri for Dummies
38 Basis Functions Synthetic hemodynamic response function (HRF) Raw data


39 Basis Functions HRF, temporal derivative and dispersion Gamma functions Fourier set (sines and cosines)
40 Basis Functions Options: Few, model-based functions (e.g., synthetic HRF) Good: Easy to analyze and interpret in terms of hemodynamic activity Bad: May fail to capture real responses that do not fit the assumed behaviour Many, general basis functions (e.g., Fourier set) Good: No a priori assumptions about the shape of the response. Can capture unexpected responses (e.g., longer delay/duration) Bad: Difficult to interpret physiologically. Difficult to take to a second level (random) analysis

41 Effect of Thresholds r =.80 64% of variance p < r =.50 25% of variance p < r =.40 16% of variance p < r =.24 6% of variance p <.05 r = 0 0% of variance p < 1 fmri for Dummies
 2..05 * 49,152 = 2457 significant voxels by chance alone r =.24 6% of variance p <.05 3.")
42 Complications Not only is it hard to determine what s real, but there are all sorts of statistical problems Potential problems What s wrong with these data? 1. data may be contaminated by artifacts (e.g., head motion, breathing artifacts) * 49,152 = 2457 significant voxels by chance alone r =.24 6% of variance p < many assumptions of statistics (adjacent voxels uncorrelated with each other; adjacent time points uncorrelated with one another) are false fmri for Dummies
43 The General Linear Model T-tests, correlations and Fourier analysis work for simple designs and were common in the early days of imaging The General Linear Model (GLM) is now available in many software packages and tends to be the analysis of choice Why is the GLM so great? the GLM is an overarching tool that can do anything that the simpler tests do you can examine any combination of contrasts (e.g., intact - scrambled, scrambled - baseline) with one GLM rather than multiple correlations the GLM allows much greater flexibility for combining data within subjects and between subjects it also makes it much easier to counterbalance orders and discard bad sections of data the GLM allows you to model things that may account for variability in the data even though they aren t interesting in and of themselves (e.g., head motion) as we will see later in the course, the GLM also allows you to use more complex designs (e.g., factorial designs) fmri for Dummies


")
 Scrambled Objects fmri")
44 A Simple Experiment Lateral Occipital Complex responds when subject views objects Blank Screen Intact Objects TIME One volume (12 slices) every 2 seconds for 272 seconds (4 minutes, 32 seconds) Condition changes every 16 seconds (8 volumes) Scrambled Objects fmri for Dummies


45 What s real? A. C. B. D. fmri for Dummies
46 What s real? I created each of those time courses based by taking the predictor function and adding a variable amount of random noise signal = + noise fmri for Dummies

47 What s real? Which of the data sets below is more convincing? fmri for Dummies
48 Statistical Significance Significance depends on signal (differences between conditions) noise (other variability) sample size (more time points are more convincing) fmri for Dummies
49 Let s create a time course for one LO voxel fmri for Dummies
50 We ll begin with activation Response to Intact Objects is 4X greater than Scrambled Objects fmri for Dummies

51 Then we ll assume that our modelled activation is off because a transient component fmri for Dummies

52 Our modelled activation could be off for other reasons All of the following could lead to inaccurate models different shape of function different width of function different latency of function fmri for Dummies
53 Variability of HRF Aguirre, Zarahn & D Esposito, 1998 HRF shows considerable variability between subjects different subjects Within subjects, responses are more consistent, although there is still some variability between sessions same subject, same session same subject, different session fmri for Dummies

54 Now let s add some variability due to head motion fmri for Dummies

55 though really motion is more complex Head motion can be quantified with 6 parameters given in any motion correction algorithm x translation y translation z translation xy rotation xz rotation yz rotation For simplicity, I ve only included parameter one in our model Head motion can lead to other problems not predictable by these parameters fmri for Dummies
 or physiological noise (e.g., subject s head sinks) fmri for Dummies")
56 Now let s throw in a pinch of linear drift linear drift could arise from magnet noise (e.g., parts warm up) or physiological noise (e.g., subject s head sinks) fmri for Dummies
57 and then we ll add a dash of low frequency noise low frequency noise can arise from magnet noise or physiological noise (e.g., subject s cycles of alertness/drowsiness) low frequency noise would occur over a range of frequencies but for simplicity, I ve only included one frequency (1 cycle per run) here fmri for Dummies Linear drift is really just very low frequency noise
 fmri for Dummies")
58 and our last ingredient some high frequency noise high frequency noise can arise from magnet noise or physiological noise (e.g., subject s breathing rate and heartrate) fmri for Dummies

59 When we add these all together, we get a realistic time course fmri for Dummies
/sd normalization leads to data where mean = zero SD = 1 fmri for")
60 Now let s be the experimenter First, we take our time course and normalize it using z scores z = (x - mean)/sd normalization leads to data where mean = zero SD = 1 fmri for Dummies


61 We create a GLM with 2 predictors β 1 = + + β 2 fmri Signal = Design Matrix x Betas + what we CAN explain how much of it we CAN explain our data = x + Residuals what we CANNOT explain Statistical significance is basically a ratio of explained to unexplained variance fmri for Dummies
 over time SPM includes a constant to take care of the average activation level throughout each run fmri")
62 Implementation of GLM in SPM Many thanks to Øystein Bech Gadmar for creating this figure in SPM Time Intact Predictor Scrambled Predictor SPM represents time as going down SPM represents predictors within the design matrix as grayscale plots (where black = low, white = high) over time SPM includes a constant to take care of the average activation level throughout each run fmri for Dummies


63 We create a GLM with 2 predictors when β 1 =2 = + + when β 2 =0.5 fmri Signal our data = Design Matrix x Betas what we CAN explain how much of it we CAN explain = x + + Residuals what we CANNOT explain Statistical significance is basically a ratio of explained to unexplained variance fmri for Dummies

64 Correlated Predictors Where possible, avoid predictors that are highly correlated with one another This is why we NEVER include a baseline predictor baseline predictor is almost completely correlated with the sum of existing predictors + r = -.53 = r = -.53 Two stimulus predictors r = -.95 Baseline predictor
65 Which model accounts for this data? x β = 1 x β = 0 + OR + x β = 1 x β = x β = 0 x β = -1 Because the predictors are highly correlated, you can t tell which model is best


66 A Real Voxel Here s the time course from a voxel that was significant in the +Intact - Scrambled comparison fmri for Dummies


67 Maximizing Your Power signal = + As we saw earlier, the GLM is basically comparing the amount of signal to the amount of noise How can we improve our stats? increase signal decrease noise increase sample size (keep subject in longer) fmri for Dummies noise
68 How to Reduce Noise If you can t get rid of an artifact, you can include it as a predictor of no interest to soak up variance Example: Some people include predictors from the outcome of motion correction algorithms Corollary: Never leave out predictors for conditions that will affect your data fmri for Dummies
69 What s this #*%&ing reviewer complaining about?! Particularly if you do voxelwise stats, you have to be careful to follow the accepted standards of the field. In the past few years the following approaches have been recommended by the stats mavens: 1. Correction for multiple comparisons 2. Correction for serial correlations 3. Random effects analyses fmri for Dummies
70 Correction for Multiple Comparisons With conventional probability levels (e.g., p <.05) and a huge number of comparisons (e.g., 64 x 64 x 12 = 49,152), a lot of voxels will be significant purely by chance e.g.,.05 * 49,152 = 2458 voxels significant due to chance How can we avoid this? 1) Bonferroni correction divide desired p value by number of comparisons Example: desired p value: p <.05 number of voxels: 50,000 required p value: p <.05 / 50,000 p < quite conservative can use less stringent values e.g., Brain Voyager can use the number of voxels in the cortical surface small volume correction: use more liberal thresholds in areas of the brain which you expected to be active fmri for Dummies


71 Correction for Multiple Comparisons 2) Gaussian field theory Fundamental to SPM If data are very smooth, then the chance of noise points passing threshold is reduced Can correct for the number of resolvable elements ( resels ) rather than number of voxels Slide modified from Duke course fmri for Dummies
72 3) Cluster correction falsely activated voxels should be randomly dispersed set minimum cluster size to be large enough to make it unlikely that a cluster of that size would occur by chance assumes that data from adjacent voxels are uncorrelated (not true) 4) Test-retest reliability Perform statistical tests on each half of the data The probability of a given voxel appearing in both purely by chance is the square of the p value used in each half e.g.,.001 x.001 = Alternatively, use the first half to select an ROI and evaluate your hypothesis in the second half. fmri for Dummies
73 Correction for Temporal Correlations Statistical methods assume that each of our time points is independent. In the case of fmri, this assumption is false. Even in a screen saver scan, activation in a voxel at one time is correlated with it s activation within ~6 sec This fact can artificially inflate your statistical significance. fmri for Dummies

74 Autocorrelation function original shift by 1 volume shift by 2 volumes To calculate the magnitude of the problem, we can compute the autocorrelation function For a voxel or ROI, correlate its time course with itself shifted in time Plot these correlations by the degree of shift time If there s no autocorrelation, function should drop from 1 to 0 abruptly pink line the points circled in yellow suggest there is some autocorrelation, especially at a shift of 1, called AR(1) fmri for Dummies
75 Collapsed Fixed Effects Models assume that the experimental manipulation has same effect in each subject treats all data as one concatenated set with one beta per predictor (collapsed across all subjects) e.g., Intact = 2 Scrambled =.5 strong effect in one subject can lead to significance even when others show weak or no effects you can say that effect was significant in your group of subjects but cannot generalize to other subjects that you didn t test fmri for Dummies

76 Contrasts in the GLM We can examine whether a single predictor is significant (compared to the baseline) We can also examine whether a single predictor is significantly greater than another predictor fmri for Dummies
77 Separate Subjects Models one beta per predictor per subject e.g., JC: Intact = 2.1 JC: Scrambled = 0.2 DQ: Intact = 1.5 DQ: Scrambled = 1.0 KV: Intact = 1.2 KV: Scrambled = 1.3 weights each subject equally makes data less susceptible to effects of one rogue subject fmri for Dummies
78 Random Effects Analysis Typical fmri stats test whether the differences between conditions are significant in the sample of subjects we have tested Often, we want to be able to generalize to the population as a whole including all potential subjects, not just the ones we tested Random effects analyses allow you to generalize to the population you tested underpaid graduate students in need of a few bucks! Random effects analyses can really squash your data, especially if you don t have many subjects. Sometimes we refer to the random effects button as the make my activation go away button. Reviewers are now requesting random effects analyses more frequently You don t have to worry about it if you re using the ROI approach because (1) presumably the ROI has already been well-established across multiple labs; and (2) posthoc analyses of results in an ROI approach allow you to generalize to the population (assuming you include individual variance) fmri for Dummies
79 Fixed vs. Random Effects GLM Sample Data #1 Sample Data #2 Subject Intact beta Scram beta Diff Subject Intact beta Scram beta Diff SUM SUM Fixed Effects GLM cannot tell the difference between these data sets because (Intact sum - Scram sum) is the same in both cases In Random Effects GLM, Data set #1 would be more likely to be significant because all 3 subjects show a trend in the same direction (intact > scrambled), whereas in data set #2, only 2 of 3 subjects show a difference in that direction


80 Methodological Fundamentalism The latest review I received
")
 conditions using precise statistical procedures within every voxel of the brain.")
81 Approach #1: Voxelwise Statistics 1. You don t necessarily need a priori hypotheses (though sometimes you can use less conservative stats if you have them) 2. Average all of your data together in Talairach space 3. Compare two (or more) conditions using precise statistical procedures within every voxel of the brain. Any area that passes a carefully determined threshold is considered real. 4. Make a list of these areas and publish it. This is the tricky part! fmri for Dummies

 responds more to objects, abstract sculptures and faces than to")
82 Voxelwise Approach: Example Malach et al., 1995, PNAS Question: Are there areas of the human brain that are more responsive to objects than scrambled objects You will recognize this as what we now call an LO localizer, but Malach was the first to identify LO LO activation is shown in red, behind MT+ activation in green LO (red) responds more to objects, abstract sculptures and faces than to textures, unlike visual cortex (blue) which responds well to all stimuli fmri for Dummies

83 The Danger of Voxelwise Approaches This is one of two tables from a paper Some papers publish tables of activation two pages long How can anyone make sense of so many areas? Source: Decety et al., 1994, Nature fmri for Dummies
84 Approach #2: Region of interest (ROI) analysis If you are looking at a well-established area (such as visual cortex, motor cortex, or the lateral occipital complex), it s fairly easy to activate and identify the area 1. Do the stats and play with the threshold till you get something believable in the right vicinity based on anatomical location (e.g., sulcal landmarks) or functional location (e.g., Talairach coordinates from prior studies) 2. Once you have found the ROI, do independent experiments, extract the time course information and determine whether activation differences between conditions are significant Because the runs that are used to generate the area are independent from those used to test the hypothesis, liberal statistics (p <.05) can be used fmri for Dummies


85 Example of ROI Approach Culham et al., 2003, Experimental Brain Research Does the Lateral Occipital Complex compute object shape for grasping? Step 1: Localize LOC Intact Objects Scrambled Objects


86 Example of ROI Approach Culham et al., 2003, Experimental Brain Research Does the Lateral Occipital Complex compute object shape for grasping? Step 2: Extract LOC data from experimental runs Grasping Reaching NS p =.35 NS p =.31
87 Example of ROI Approach Very Simple Stats Subject 1 % BOLD Signal Change Left Hem. LOC Grasping 0.02 Reaching 0.03 Then simply do a paired t-test to see whether the peaks are significantly different between conditions Extract average peak from each subject for each condition NS p = NS p = Instead of using % BOLD Signal Change, you can use beta weights You can also do a planned contrast in Brain Voyager using a module called the ROI GLM

88 Utility of Doing Both Approaches We also verified the result with a voxelwise approach Why might ROI alone not suffice? Why might voxelwise alone not suffice? Verification of no LOC activation for grasping > reaching even at moderate threshold (p <.001)
. Since then, growing evidence suggests another area, the occipital face area (OFA) may also be critical to face perception.")
89 Example: The Danger of ROI Approaches Example 1: LOC may be a heterogeneous area with subdivisions; ROI analyses gloss over this Example 2: We looked at another example of an ROI analysis last week: Kanwisher et al. s paper on the fusiform face area (FFA). Since then, growing evidence suggests another area, the occipital face area (OFA) may also be critical to face perception. The OFA was overlooked in the original study because it was less robust and reliable than the FFA. fmri for Dummies
90 Comparing the two approaches Voxelwise Analyses Requires no prior hypotheses about areas involved Includes entire brain Often neglects individual differences Can lose spatial resolution with intersubject averaging Can produce meaningless laundry lists of areas that are difficult to interpret You have to be fairly stats-savvy and include all the appropriate statistical corrections to be certain your activation is really significant Popular in Europe Region of Interest (ROI) Analyses Extraction of ROI data can be subjected to simple stats (no need for multiple comparisons, autocorrelation or random effects corrections) Gives you more statistical power (e.g., p <.05) Hypothesis-driven Useful when hypotheses are motivated by other techniques (e.g., electrophysiology) in specific brain regions ROI is not smeared due to intersubject averaging Easy to analyze and interpret Neglects other areas which may play a fundamental role If multiple ROIs need to be considered, you can spend a lot of scan time collecting localizer data (thus limiting the time available for experimental runs) Popular in North America fmri for Dummies
91 A Proposed Resolution There is no reason not to do BOTH ROI analyses and voxelwise analyses ROI analyses for well-defined key regions Voxelwise analyses to see if other regions are also involved Ideally, the conclusions will not differ If the conclusions do differ, there may be sensible reasons Effect in ROI but not voxelwise perhaps region is highly variable in stereotaxic location between subjects perhaps voxelwise approach is not powerful enough Effect in voxelwise but not ROI perhaps ROI is not homogenous or is context-specific
92 Hypothesis- vs. Data-Driven Approaches Hypothesis-driven Examples: t-tests, correlations, general linear model (GLM) a priori model of activation is suggested data is checked to see how closely it matches components of the model most commonly used approach Data-driven Example: Independent Component Analysis (ICA) no prior hypotheses are necessary multivariate techniques determine the patterns in the data that account for the most variance across all voxels can be used to validate a model (see if the math comes up with the components you would ve predicted) can be inspected to see if there are things happening in your data that you didn t predict can be used to identify confounds (e.g., head motion) need a way to organize the many possible components fmri for Dummies
Introduction to Neuroimaging Janaina Mourao-Miranda
 Introduction to Neuroimaging Janaina Mourao-Miranda Neuroimaging techniques have changed the way neuroscientists address questions about functional anatomy, especially in relation to behavior and clinical
Journal of Articles in Support of The Null Hypothesis
 Data Preprocessing Martin M. Monti, PhD UCLA Psychology NITP 2016 Typical (task-based) fmri analysis sequence Image Pre-processing Single Subject Analysis Group Analysis Journal of Articles in Support
FMRI Pre-Processing and Model- Based Statistics
 FMRI Pre-Processing and Model- Based Statistics Brief intro to FMRI experiments and analysis FMRI pre-stats image processing Simple Single-Subject Statistics Multi-Level FMRI Analysis Advanced FMRI Analysis
First-level fmri modeling
 First-level fmri modeling Monday, Lecture 3 Jeanette Mumford University of Wisconsin - Madison What do we need to remember from the last lecture? What is the general structure of a t- statistic? How about
Introduction to fmri. Pre-processing
 Introduction to fmri Pre-processing Tibor Auer Department of Psychology Research Fellow in MRI Data Types Anatomical data: T 1 -weighted, 3D, 1/subject or session - (ME)MPRAGE/FLASH sequence, undistorted
Basic Introduction to Data Analysis. Block Design Demonstration. Robert Savoy
 Basic Introduction to Data Analysis Block Design Demonstration Robert Savoy Sample Block Design Experiment Demonstration Use of Visual and Motor Task Separability of Responses Combined Visual and Motor
Statistical Analysis of Neuroimaging Data. Phebe Kemmer BIOS 516 Sept 24, 2015
 Statistical Analysis of Neuroimaging Data Phebe Kemmer BIOS 516 Sept 24, 2015 Review from last time Structural Imaging modalities MRI, CAT, DTI (diffusion tensor imaging) Functional Imaging modalities
SPM8 for Basic and Clinical Investigators. Preprocessing. fmri Preprocessing
 SPM8 for Basic and Clinical Investigators Preprocessing fmri Preprocessing Slice timing correction Geometric distortion correction Head motion correction Temporal filtering Intensity normalization Spatial
Functional MRI in Clinical Research and Practice Preprocessing
 Functional MRI in Clinical Research and Practice Preprocessing fmri Preprocessing Slice timing correction Geometric distortion correction Head motion correction Temporal filtering Intensity normalization
White Pixel Artifact. Caused by a noise spike during acquisition Spike in K-space <--> sinusoid in image space
 White Pixel Artifact Caused by a noise spike during acquisition Spike in K-space sinusoid in image space Susceptibility Artifacts Off-resonance artifacts caused by adjacent regions with different
Basic fmri Design and Analysis. Preprocessing
 Basic fmri Design and Analysis Preprocessing fmri Preprocessing Slice timing correction Geometric distortion correction Head motion correction Temporal filtering Intensity normalization Spatial filtering
Functional MRI data preprocessing. Cyril Pernet, PhD
 Functional MRI data preprocessing Cyril Pernet, PhD Data have been acquired, what s s next? time No matter the design, multiple volumes (made from multiple slices) have been acquired in time. Before getting
EPI Data Are Acquired Serially. EPI Data Are Acquired Serially 10/23/2011. Functional Connectivity Preprocessing. fmri Preprocessing
 Functional Connectivity Preprocessing Geometric distortion Head motion Geometric distortion Head motion EPI Data Are Acquired Serially EPI Data Are Acquired Serially descending 1 EPI Data Are Acquired
This Time. fmri Data analysis
 This Time Reslice example Spatial Normalization Noise in fmri Methods for estimating and correcting for physiologic noise SPM Example Spatial Normalization: Remind ourselves what a typical functional image
Multi-voxel pattern analysis: Decoding Mental States from fmri Activity Patterns
 Multi-voxel pattern analysis: Decoding Mental States from fmri Activity Patterns Artwork by Leon Zernitsky Jesse Rissman NITP Summer Program 2012 Part 1 of 2 Goals of Multi-voxel Pattern Analysis Decoding
SPM Introduction. SPM : Overview. SPM: Preprocessing SPM! SPM: Preprocessing. Scott Peltier. FMRI Laboratory University of Michigan
 SPM Introduction Scott Peltier FMRI Laboratory University of Michigan! Slides adapted from T. Nichols SPM! SPM : Overview Library of MATLAB and C functions Graphical user interface Four main components:
fmri pre-processing Juergen Dukart
 fmri pre-processing Juergen Dukart Outline Why do we need pre-processing? fmri pre-processing Slice time correction Realignment Unwarping Coregistration Spatial normalisation Smoothing Overview fmri time-series
SPM Introduction SPM! Scott Peltier. FMRI Laboratory University of Michigan. Software to perform computation, manipulation and display of imaging data
 SPM Introduction Scott Peltier FMRI Laboratory University of Michigan Slides adapted from T. Nichols SPM! Software to perform computation, manipulation and display of imaging data 1 1 SPM : Overview Library
Tutorial BOLD Module
 m a k i n g f u n c t i o n a l M R I e a s y n o r d i c B r a i n E x Tutorial BOLD Module Please note that this tutorial is for the latest released nordicbrainex. If you are using an older version please
Fmri Spatial Processing
 Educational Course: Fmri Spatial Processing Ray Razlighi Jun. 8, 2014 Spatial Processing Spatial Re-alignment Geometric distortion correction Spatial Normalization Smoothing Why, When, How, Which Why is
CS/NEUR125 Brains, Minds, and Machines. Due: Wednesday, April 5
 CS/NEUR125 Brains, Minds, and Machines Lab 8: Using fmri to Discover Language Areas in the Brain Due: Wednesday, April 5 In this lab, you will analyze fmri data from an experiment that was designed to
Basic principles of MR image analysis. Basic principles of MR image analysis. Basic principles of MR image analysis
 Basic principles of MR image analysis Basic principles of MR image analysis Julien Milles Leiden University Medical Center Terminology of fmri Brain extraction Registration Linear registration Non-linear
fmri Analysis Sackler Ins2tute 2011
 fmri Analysis Sackler Ins2tute 2011 How do we get from this to this? How do we get from this to this? And what are those colored blobs we re all trying to see, anyway? Raw fmri data straight from the scanner
SPM8 for Basic and Clinical Investigators. Preprocessing
 SPM8 for Basic and Clinical Investigators Preprocessing fmri Preprocessing Slice timing correction Geometric distortion correction Head motion correction Temporal filtering Intensity normalization Spatial
Analysis of Functional MRI Timeseries Data Using Signal Processing Techniques
 Analysis of Functional MRI Timeseries Data Using Signal Processing Techniques Sea Chen Department of Biomedical Engineering Advisors: Dr. Charles A. Bouman and Dr. Mark J. Lowe S. Chen Final Exam October
CHAPTER 2. Morphometry on rodent brains. A.E.H. Scheenstra J. Dijkstra L. van der Weerd
 CHAPTER 2 Morphometry on rodent brains A.E.H. Scheenstra J. Dijkstra L. van der Weerd This chapter was adapted from: Volumetry and other quantitative measurements to assess the rodent brain, In vivo NMR
The organization of the human cerebral cortex estimated by intrinsic functional connectivity
 1 The organization of the human cerebral cortex estimated by intrinsic functional connectivity Journal: Journal of Neurophysiology Author: B. T. Thomas Yeo, et al Link: https://www.ncbi.nlm.nih.gov/pubmed/21653723
Correction for multiple comparisons. Cyril Pernet, PhD SBIRC/SINAPSE University of Edinburgh
 Correction for multiple comparisons Cyril Pernet, PhD SBIRC/SINAPSE University of Edinburgh Overview Multiple comparisons correction procedures Levels of inferences (set, cluster, voxel) Circularity issues
HST.583 Functional Magnetic Resonance Imaging: Data Acquisition and Analysis Fall 2006
 MIT OpenCourseWare http://ocw.mit.edu HST.583 Functional Magnetic Resonance Imaging: Data Acquisition and Analysis Fall 2006 For information about citing these materials or our Terms of Use, visit: http://ocw.mit.edu/terms.
Analysis of fmri data within Brainvisa Example with the Saccades database
 Analysis of fmri data within Brainvisa Example with the Saccades database 18/11/2009 Note : All the sentences in italic correspond to informations relative to the specific dataset under study TP participants
fmri Image Preprocessing
 fmri Image Preprocessing Rick Hoge, Ph.D. Laboratoire de neuroimagerie vasculaire (LINeV) Centre de recherche de l institut universitaire de gériatrie de Montréal, Université de Montréal Outline Motion
Last Time. This Time. Thru-plane dephasing: worse at long TE. Local susceptibility gradients: thru-plane dephasing
 Motion Correction Last Time Mutual Information Optimiation Decoupling Translation & Rotation Interpolation SPM Example (Least Squares & MI) A Simple Derivation This Time Reslice example SPM Example : Remind
Introductory Concepts for Voxel-Based Statistical Analysis
 Introductory Concepts for Voxel-Based Statistical Analysis John Kornak University of California, San Francisco Department of Radiology and Biomedical Imaging Department of Epidemiology and Biostatistics
Group analysis of fmri data. Why group analysis? What is a population? Reminder: Analysis of data from 1 person. Robert: Roel Willems,
 Reminder: Analysis of data from person Group analysis of fmri data Robert: Roel Willems, FC Donders Centre Nijmegen roel.willems@fcdonders.ru.nl Why group analysis? Results from Robert only apply to Robert
7/15/2016 ARE YOUR ANALYSES TOO WHY IS YOUR ANALYSIS PARAMETRIC? PARAMETRIC? That s not Normal!
 ARE YOUR ANALYSES TOO PARAMETRIC? That s not Normal! Martin M Monti http://montilab.psych.ucla.edu WHY IS YOUR ANALYSIS PARAMETRIC? i. Optimal power (defined as the probability to detect a real difference)
CS 229 Final Project Report Learning to Decode Cognitive States of Rat using Functional Magnetic Resonance Imaging Time Series
 CS 229 Final Project Report Learning to Decode Cognitive States of Rat using Functional Magnetic Resonance Imaging Time Series Jingyuan Chen //Department of Electrical Engineering, cjy2010@stanford.edu//
fmri Basics: Single Subject Analysis
 fmri Basics: Single Subject Analysis This session is intended to give an overview of the basic process of setting up a general linear model for a single subject. This stage of the analysis is also variously
Section 9. Human Anatomy and Physiology
 Section 9. Human Anatomy and Physiology 9.1 MR Neuroimaging 9.2 Electroencephalography Overview As stated throughout, electrophysiology is the key tool in current systems neuroscience. However, single-
Supplementary Figure 1. Decoding results broken down for different ROIs
 Supplementary Figure 1 Decoding results broken down for different ROIs Decoding results for areas V1, V2, V3, and V1 V3 combined. (a) Decoded and presented orientations are strongly correlated in areas
Computational Neuroanatomy
 Computational Neuroanatomy John Ashburner john@fil.ion.ucl.ac.uk Smoothing Motion Correction Between Modality Co-registration Spatial Normalisation Segmentation Morphometry Overview fmri time-series kernel
FSL Pre-Processing Pipeline
 The Art and Pitfalls of fmri Preprocessing FSL Pre-Processing Pipeline Mark Jenkinson FMRIB Centre, University of Oxford FSL Pre-Processing Pipeline Standard pre-processing: Task fmri Resting-state fmri
Advances in FDR for fmri -p.1
 Advances in FDR for fmri Ruth Heller Department of Statistics, University of Pennsylvania Joint work with: Yoav Benjamini, Nava Rubin, Damian Stanley, Daniel Yekutieli, Yulia Golland, Rafael Malach Advances
Single Subject Demo Data Instructions 1) click "New" and answer "No" to the "spatially preprocess" question.
 click New and answer No to the spatially preprocess question.") (1) conn - Functional connectivity toolbox v1.0 Single Subject Demo Data Instructions 1) click "New" and answer "No" to the "spatially preprocess" question. 2) in "Basic" enter "1" subject, "6" seconds
(1) conn - Functional connectivity toolbox v1.0 Single Subject Demo Data Instructions 1) click "New" and answer "No" to the "spatially preprocess" question. 2) in "Basic" enter "1" subject, "6" seconds
Surface-based Analysis: Inter-subject Registration and Smoothing
 Surface-based Analysis: Inter-subject Registration and Smoothing Outline Exploratory Spatial Analysis Coordinate Systems 3D (Volumetric) 2D (Surface-based) Inter-subject registration Volume-based Surface-based
Quality Checking an fmri Group Result (art_groupcheck)
") Quality Checking an fmri Group Result (art_groupcheck) Paul Mazaika, Feb. 24, 2009 A statistical parameter map of fmri group analyses relies on the assumptions of the General Linear Model (GLM). The assumptions
Quality Checking an fmri Group Result (art_groupcheck) Paul Mazaika, Feb. 24, 2009 A statistical parameter map of fmri group analyses relies on the assumptions of the General Linear Model (GLM). The assumptions
INDEPENDENT COMPONENT ANALYSIS APPLIED TO fmri DATA: A GENERATIVE MODEL FOR VALIDATING RESULTS
 INDEPENDENT COMPONENT ANALYSIS APPLIED TO fmri DATA: A GENERATIVE MODEL FOR VALIDATING RESULTS V. Calhoun 1,2, T. Adali, 2 and G. Pearlson 1 1 Johns Hopkins University Division of Psychiatric Neuro-Imaging,
NA-MIC National Alliance for Medical Image Computing fmri Data Analysis
 NA-MIC fmri Data Analysis Sonia Pujol, Ph.D. Wendy Plesniak, Ph.D. Randy Gollub, M.D., Ph.D. Acknowledgments NIH U54EB005149 Neuroimage Analysis Center NIH P41RR013218 FIRST Biomedical Informatics Research
Attention modulates spatial priority maps in human occipital, parietal, and frontal cortex
 Attention modulates spatial priority maps in human occipital, parietal, and frontal cortex Thomas C. Sprague 1 and John T. Serences 1,2 1 Neuroscience Graduate Program, University of California San Diego
Bayesian Inference in fmri Will Penny
 Bayesian Inference in fmri Will Penny Bayesian Approaches in Neuroscience Karolinska Institutet, Stockholm February 2016 Overview Posterior Probability Maps Hemodynamic Response Functions Population
Statistical Analysis of MRI Data
 Statistical Analysis of MRI Data Shelby Cummings August 1, 2012 Abstract Every day, numerous people around the country go under medical testing with the use of MRI technology. Developed in the late twentieth
Function-Structure Integration in FreeSurfer
 Function-Structure Integration in FreeSurfer Outline Function-Structure Integration Function-Structure Registration in FreeSurfer fmri Analysis Preprocessing First-Level Analysis Higher-Level (Group) Analysis
Medical Image Analysis
 Medical Image Analysis Instructor: Moo K. Chung mchung@stat.wisc.edu Lecture 10. Multiple Comparisons March 06, 2007 This lecture will show you how to construct P-value maps fmri Multiple Comparisons 4-Dimensional
fmri Preprocessing & Noise Modeling
 Translational Neuromodeling Unit fmri Preprocessing & Noise Modeling Lars Kasper September 25 th / October 17 th, 2015 MR-Technology Group & Translational Neuromodeling Unit An SPM Tutorial Institute for
Supplementary methods
 Supplementary methods This section provides additional technical details on the sample, the applied imaging and analysis steps and methods. Structural imaging Trained radiographers placed all participants
Decoding the Human Motor Cortex
 Computer Science 229 December 14, 2013 Primary authors: Paul I. Quigley 16, Jack L. Zhu 16 Comment to piq93@stanford.edu, jackzhu@stanford.edu Decoding the Human Motor Cortex Abstract: A human being s
FSL Pre-Processing Pipeline
 The Art and Pitfalls of fmri Preprocessing FSL Pre-Processing Pipeline Mark Jenkinson FMRIB Centre, University of Oxford FSL Pre-Processing Pipeline Standard pre-processing: Task fmri Resting-state fmri
HST.583 Functional Magnetic Resonance Imaging: Data Acquisition and Analysis Fall 2008
 MIT OpenCourseWare http://ocw.mit.edu HST.583 Functional Magnetic Resonance Imaging: Data Acquisition and Analysis Fall 2008 For information about citing these materials or our Terms of Use, visit: http://ocw.mit.edu/terms.
Supplementary Figure 1
 Supplementary Figure 1 BOLD and CBV functional maps showing EPI versus line-scanning FLASH fmri. A. Colored BOLD and CBV functional maps are shown in the highlighted window (green frame) of the raw EPI
Independent Component Analysis of fmri Data
 Independent Component Analysis of fmri Data Denise Miller April 2005 Introduction Techniques employed to analyze functional magnetic resonance imaging (fmri) data typically use some form of univariate
Excel Basics Rice Digital Media Commons Guide Written for Microsoft Excel 2010 Windows Edition by Eric Miller
 Excel Basics Rice Digital Media Commons Guide Written for Microsoft Excel 2010 Windows Edition by Eric Miller Table of Contents Introduction!... 1 Part 1: Entering Data!... 2 1.a: Typing!... 2 1.b: Editing
Effect of age and dementia on topology of brain functional networks. Paul McCarthy, Luba Benuskova, Liz Franz University of Otago, New Zealand
 Effect of age and dementia on topology of brain functional networks Paul McCarthy, Luba Benuskova, Liz Franz University of Otago, New Zealand 1 Structural changes in aging brain Age-related changes in
Data Visualisation in SPM: An introduction
 Data Visualisation in SPM: An introduction Alexa Morcom Edinburgh SPM course, April 2010 Centre for Cognitive & Neural Systems/ Department of Psychology University of Edinburgh Visualising results remembered
Getting Started Guide
 Getting Started Guide Version 2.5 for BVQX 1.9 Rainer Goebel, Henk Jansma and Jochen Seitz Copyright 2007 Brain Innovation B.V. 2 Contents Preface...4 The Objects Tutorial...5 Scanning session information...5
Extending the GLM. Outline. Mixed effects motivation Evaluating mixed effects methods Three methods. Conclusions. Overview
 Extending the GLM So far, we have considered the GLM for one run in one subject The same logic can be applied to multiple runs and multiple subjects GLM Stats For any given region, we can evaluate the
Locating Motion Artifacts in Parametric fmri Analysis
 Tina Memo No. 200-002 Presented at MICCAI 999 Locating Motion Artifacts in Parametric fmri Analysis A.J.Lacey, N.A.Thacker, E. Burton, and A.Jackson Last updated 2 / 02 / 2002 Imaging Science and Biomedical
BrainVoyager TM. Getting Started Guide. Version 3.0. for BV 21
 BrainVoyager TM Getting Started Guide Version 3.0 for BV 21 Rainer Goebel, Henk Jansma, Caroline Benjamins, Judith Eck, Hester Breman and Armin Heinecke Copyright 2018 Brain Innovation B.V. Contents About
MultiVariate Bayesian (MVB) decoding of brain images
 decoding of brain images") MultiVariate Bayesian (MVB) decoding of brain images Alexa Morcom Edinburgh SPM course 2015 With thanks to J. Daunizeau, K. Brodersen for slides stimulus behaviour encoding of sensorial or cognitive state?
MultiVariate Bayesian (MVB) decoding of brain images Alexa Morcom Edinburgh SPM course 2015 With thanks to J. Daunizeau, K. Brodersen for slides stimulus behaviour encoding of sensorial or cognitive state?
SPM99 fmri Data Analysis Workbook
 SPM99 fmri Data Analysis Workbook This file is a description of the steps needed to use SPM99 analyze a fmri data set from a single subject using a simple on/off activation paradigm. There are two parts
Welcome to Introduction to Microsoft Excel 2010
 Welcome to Introduction to Microsoft Excel 2010 2 Introduction to Excel 2010 What is Microsoft Office Excel 2010? Microsoft Office Excel is a powerful and easy-to-use spreadsheet application. If you are
Robotics. Lecture 5: Monte Carlo Localisation. See course website for up to date information.
 Robotics Lecture 5: Monte Carlo Localisation See course website http://www.doc.ic.ac.uk/~ajd/robotics/ for up to date information. Andrew Davison Department of Computing Imperial College London Review:
Data Visualisation in SPM: An introduction
 Data Visualisation in SPM: An introduction Alexa Morcom Edinburgh SPM course, April 2015 SPMmip [-30, 3, -9] 3 Visualising results remembered vs. fixation contrast(s) < < After the results table - what
Norbert Schuff VA Medical Center and UCSF
 Norbert Schuff Medical Center and UCSF Norbert.schuff@ucsf.edu Medical Imaging Informatics N.Schuff Course # 170.03 Slide 1/67 Objective Learn the principle segmentation techniques Understand the role
#$ % $ $& "$%% " $ '$ " '
 ! " This section of the course covers techniques for pairwise (i.e., scanto-scan) and global (i.e., involving more than 2 scans) alignment, given that the algorithms are constrained to obtain a rigid-body
Group (Level 2) fmri Data Analysis - Lab 4
 fmri Data Analysis - Lab 4") Group (Level 2) fmri Data Analysis - Lab 4 Index Goals of this Lab Before Getting Started The Chosen Ten Checking Data Quality Create a Mean Anatomical of the Group Group Analysis: One-Sample T-Test Examine
Group (Level 2) fmri Data Analysis - Lab 4 Index Goals of this Lab Before Getting Started The Chosen Ten Checking Data Quality Create a Mean Anatomical of the Group Group Analysis: One-Sample T-Test Examine
Multiple Testing and Thresholding
 Multiple Testing and Thresholding NITP, 2010 Thanks for the slides Tom Nichols! Overview Multiple Testing Problem Which of my 100,000 voxels are active? Two methods for controlling false positives Familywise
Time-Frequency Method Based Activation Detection in Functional MRI Time-Series
 Time-Frequency Method Based Activation Detection in Functional MRI Time-Series Arun Kumar 1,2 and Jagath C. Rajapakse 1,3 1 School of Computing, NTU, Singapore 2 School of EEE,Singapore Polytechnic, Singapore
FSL Workshop Session 3 David Smith & John Clithero
 FSL Workshop 12.09.08 Session 3 David Smith & John Clithero What is MELODIC? Probabilistic ICA Improves upon standard ICA Allows for inference Avoids over-fitting Three stage process ( ppca ) 1.) Dimension
Multiple Testing and Thresholding
 Multiple Testing and Thresholding NITP, 2009 Thanks for the slides Tom Nichols! Overview Multiple Testing Problem Which of my 100,000 voxels are active? Two methods for controlling false positives Familywise
HST.583 Functional Magnetic Resonance Imaging: Data Acquisition and Analysis Fall 2008
 MIT OpenCourseWare http://ocw.mit.edu HST.583 Functional Magnetic Resonance Imaging: Data Acquisition and Analysis Fall 2008 For information about citing these materials or our Terms of Use, visit: http://ocw.mit.edu/terms.
Artifact Detection and Repair: Overview and Sample Outputs
 Artifact Detection and Repair: Overview and Sample Outputs Paul Mazaika February 2007 Programs originated in Gabrieli Neuroscience Laboratory, updated and enhanced at Center for Interdisciplinary Brain
Lab 9. Julia Janicki. Introduction
 Lab 9 Julia Janicki Introduction My goal for this project is to map a general land cover in the area of Alexandria in Egypt using supervised classification, specifically the Maximum Likelihood and Support
Multiple Testing and Thresholding
 Multiple Testing and Thresholding UCLA Advanced NeuroImaging Summer School, 2007 Thanks for the slides Tom Nichols! Overview Multiple Testing Problem Which of my 100,000 voxels are active? Two methods
I.e. Sex differences in child appetitive traits and Eating in the Absence of Hunger:
 Supplementary Materials I. Evidence of sex differences on eating behavior in children I.e. Sex differences in child appetitive traits and Eating in the Absence of Hunger: Table 2. Parent Report for Child
the PyHRF package P. Ciuciu1,2 and T. Vincent1,2 Methods meeting at Neurospin 1: CEA/NeuroSpin/LNAO
 Joint detection-estimation of brain activity from fmri time series: the PyHRF package Methods meeting at Neurospin P. Ciuciu1,2 and T. Vincent1,2 philippe.ciuciu@cea.fr 1: CEA/NeuroSpin/LNAO www.lnao.fr
An Empirical Comparison of SPM Preprocessing Parameters to the Analysis of fmri Data
 NeuroImage 17, 19 28 (2002) doi:10.1006/nimg.2002.1113 An Empirical Comparison of SPM Preprocessing Parameters to the Analysis of fmri Data Valeria Della-Maggiore, Wilkin Chau, Pedro R. Peres-Neto,* and
Mapping of Hierarchical Activation in the Visual Cortex Suman Chakravartula, Denise Jones, Guillaume Leseur CS229 Final Project Report. Autumn 2008.
 Mapping of Hierarchical Activation in the Visual Cortex Suman Chakravartula, Denise Jones, Guillaume Leseur CS229 Final Project Report. Autumn 2008. Introduction There is much that is unknown regarding
Empirical analyses of null-hypothesis perfusion FMRI data at 1.5 and 4 T
 NeuroImage 19 (2003) 1449 1462 www.elsevier.com/locate/ynimg Empirical analyses of null-hypothesis perfusion FMRI data at 1.5 and 4 T Jiongjiong Wang, a,b, * Geoffrey K. Aguirre, a,c Daniel Y. Kimberg,
Preprocessing of fmri data
 Preprocessing of fmri data Pierre Bellec CRIUGM, DIRO, UdM Flowchart of the NIAK fmri preprocessing pipeline fmri run 1 fmri run N individual datasets CIVET NUC, segmentation, spatial normalization slice
Animations involving numbers
 136 Chapter 8 Animations involving numbers 8.1 Model and view The examples of Chapter 6 all compute the next picture in the animation from the previous picture. This turns out to be a rather restrictive
Efficiency and design optimization
 Efficiency and design optimization Tuesday, Lecture 3 Jeanette Mumford University of Wisconsin - Madison Thanks to Tom Liu for letting me use some of his slides! What is the best way to increase your power?
Estimating Noise and Dimensionality in BCI Data Sets: Towards Illiteracy Comprehension
 Estimating Noise and Dimensionality in BCI Data Sets: Towards Illiteracy Comprehension Claudia Sannelli, Mikio Braun, Michael Tangermann, Klaus-Robert Müller, Machine Learning Laboratory, Dept. Computer
Automatic segmentation of the cortical grey and white matter in MRI using a Region Growing approach based on anatomical knowledge
 Automatic segmentation of the cortical grey and white matter in MRI using a Region Growing approach based on anatomical knowledge Christian Wasserthal 1, Karin Engel 1, Karsten Rink 1 und André Brechmann
Multivariate Pattern Classification. Thomas Wolbers Space and Aging Laboratory Centre for Cognitive and Neural Systems
 Multivariate Pattern Classification Thomas Wolbers Space and Aging Laboratory Centre for Cognitive and Neural Systems Outline WHY PATTERN CLASSIFICATION? PROCESSING STREAM PREPROCESSING / FEATURE REDUCTION
Linear Models in Medical Imaging. John Kornak MI square February 22, 2011
 Linear Models in Medical Imaging John Kornak MI square February 22, 2011 Acknowledgement / Disclaimer Many of the slides in this lecture have been adapted from slides available in talks available on the
Role of Parallel Imaging in High Field Functional MRI
 Role of Parallel Imaging in High Field Functional MRI Douglas C. Noll & Bradley P. Sutton Department of Biomedical Engineering, University of Michigan Supported by NIH Grant DA15410 & The Whitaker Foundation
6 credits. BMSC-GA Practical Magnetic Resonance Imaging II
 BMSC-GA 4428 - Practical Magnetic Resonance Imaging II 6 credits Course director: Ricardo Otazo, PhD Course description: This course is a practical introduction to image reconstruction, image analysis
Introduc)on to fmri. Natalia Zaretskaya
on to fmri. Natalia Zaretskaya") Introduc)on to fmri Natalia Zaretskaya Content fmri signal fmri versus neural ac)vity A classical experiment: flickering checkerboard Preprocessing Univariate analysis Single- subject analysis Group analysis
Introduc)on to fmri Natalia Zaretskaya Content fmri signal fmri versus neural ac)vity A classical experiment: flickering checkerboard Preprocessing Univariate analysis Single- subject analysis Group analysis
Multivariate pattern classification
 Multivariate pattern classification Thomas Wolbers Space & Ageing Laboratory (www.sal.mvm.ed.ac.uk) Centre for Cognitive and Neural Systems & Centre for Cognitive Ageing and Cognitive Epidemiology Outline
Normalization for clinical data
 Normalization for clinical data Christopher Rorden, Leonardo Bonilha, Julius Fridriksson, Benjamin Bender, Hans-Otto Karnath (2012) Agespecific CT and MRI templates for spatial normalization. NeuroImage
Linear Models in Medical Imaging. John Kornak MI square February 19, 2013
 Linear Models in Medical Imaging John Kornak MI square February 19, 2013 Acknowledgement / Disclaimer Many of the slides in this lecture have been adapted from slides available in talks available on the