Medical Image Analysis
|
|
|
- Milo Davidson
- 6 years ago
- Views:
Transcription
1 Medical Image Analysis Instructor: Moo K. Chung Lecture 10. Multiple Comparisons March 06, 2007

2 This lecture will show you how to construct P-value maps
3 fmri Multiple Comparisons 4-Dimensional Data 1,000 multivariate observations, each with 100,000 elements 100,000 time series, each with 1,000 observations Massively Univariate Approach 100,000 hypothesis tests... Source: Nicholes
4 Multiple Comparisons X(t) = µ(t) + e(t),t " # Search region If there is a point µ(t ) > 0 0, reject the null hypothesis Note: For smooth image, clustered voxels will satisfy. µ(t 0 ) > 0
5 Point-wise inference At each fixed t H 0 is true if J 0 (t) is true for all t: H 1 is true if J 1 (t) is true for some t:
6 Test statistic and rejection rule Hypothesis testing requires a test statistic and the corresponding rejection rule. For our example (one sample test), we can use Z-stat or T-stat. In many applications Z-stat is sufficient since T-stat is approximately Z-stat for large degrees of freedom. Then we construct a rejection rule: Large T-stat value --> reject the null hypothesis Small T-stat value --> accept the null hypothesis
7 Type-I error (alpha-level) The type-i error is the probability of rejecting the null hypothesis (there is no signal) when the alternate hypothesis (there is signal) is true. The type-i error is the probability of detecting false positives. The type-i error computation requires a statistic (Zstat. t-stat, F-stat, Chi-square stat. etc). Example: Z-stat. If the Z-statistic value obtained from measurments is 1.65, alpha=0.05=p(z>1.65).
8 Alpha-level for multiple comparisons Family-wise error rate (FER)
9 Corrected P-value P-value: the smallest alpha-level at which the null hypothesis is rejected. Example: P(Z > z-stat. value). Corrected P-value is the P-value corrected for multiple comparisons. % ( P " value = P' supt(t) > t " stat. value* & ) t #$
10 Bonferroni correction Assume there are m-voxels in the search region: This becomes exact if T statistics are not correlated. We control each T statistic separately.
=0.05 Bonfenoni correction thresholding at 1.")
11 Bonferroni Correction Simulation Result Z ~ N(0,1) noise P(Z>1.65)=0.05 Bonfenoni correction thresholding at % false positives
12 Traditional approach: Motivation for FDR We do not want to make any Type-I errors by controlling the alpha-level (absolute number) New approach (FDR): Maybe we are willing to make a couple of Type-I error as long as the rate of doing so is low. So we control for the rate (relative number) It is a bit of nonsense to compare these two numbers
13 False Discovery Rate (FDR) There are many variants of FDR. False discovery: a null hypothesis is true (no signal) but we declare a significant effect anyway (reject null) FDR: the proportion of rejected voxels (significant tests) that have been falsely rejected (false discoveries). FDR = # false discoveries /# rejected voxels
14 FDR estimation FDR = # rejected null that is true # rejected null that is ture +#rejected null that is false Benjamini-Hochberg procedure for determining FDR threshold: 1. Set FDR threshold q between 0 and 1 (q-value) 2. Compute the point-wise P-value at each voxel. 3. Order P-values in increasing order P (1) < P (2) < P (3) L < P (m ) 4. Determine the largest index j that satisfies P ( j ) < jq m 5. Reject P (1),P (2),P (3),L,P ( j )
15 FDR example
16 Rejection region corrected by FDR procedure
17 FDR Software for SPM
18 False Discovery Rate Illustration: Noise Signal Signal+Noise
19 Control of Per Comparison Rate at 10% Control of Familywise Error Rate at 10% Control of False Discovery Rate at 10%
20 Benjamini & Hochberg: Varying Signal Extent p = z = 3.48 Signal Intensity 3.0 Signal Extent 5.0 Noise Smoothness 3.0 4
21 Benjamini & Hochberg: Varying Signal Extent p = z = 2.94 Signal Intensity 3.0 Signal Extent 9.5 Noise Smoothness 3.0 5
22 Benjamini & Hochberg: Varying Signal Extent p = z = 2.45 Signal Intensity 3.0 Signal Extent 16.5 Noise Smoothness 3.0 6

23 Benjamini & Hochberg: Varying Signal Extent p = z = 2.07 Signal Intensity 3.0 Signal Extent 25.0 Noise Smoothness 3.0 7
24 FDR properties FDR detects more signal while introducing more false positives. Larger the signal, the lower the threshold (easier to detect signal) Larger the signal, the more false positives
25 FDR: Example Verbal fluency data second blocks ABABAB... A: Two syllable words presented aurally B: Silence Imaging parameters 2Tesla scanner, TR = 7 sec 84 64x64x64 images of 3 x 3 x 3 mm voxels

26 fmri verbal fluency block design example FDR 0.05 t 0 = FWER 0.05 Bonferroni t 0 = 5.485
27 Random Field Theory Assumptions Images need to follow Gaussian Constructed statistics need to be sufficiently smooth. If underlying images are smooth, constructed statistics are smooth. The data need to be stationary (uniform FWHM within a search region). If not, we average FWHM across voxels.
28 Stationary Random Field The mean zero random field T(t) is stationary (homogeneous) if the joint distribution of are invariant under translations. A Stationary field has the following form of covariance function: R(t,s) = E[T(t)T(s)]=E[T(t+a)T(s+a)]=R(t+a,s+a) Stationarity Now let a=-s. R(t,s) = R(t-s,0). This implies that the covariance function is a function of t-s only.
29 Property of Stationary Random Field Let R(t,s)=f(t-s). Var T(t)=R(t,t)= f(t-t)=f(0)=const. A stationary field has constant variance.
30 Isotropic Fields A special case of stationary fields is an isotropic field. R(t,s)=f( t-s ) The correlation of random variables T(t) and T(s) is given by It is natural to assume a decreasing correlation function.
31 Decreasing correlation function Black: fmri autocorrelation in amygdala Red: autocorrelation after whitening process


 * E(+(A h )) %")
32 Random Field Approach: Adler s formula Excursion set h = -10 h = 0 h = 10 $ ' P& supt(t) > h) * E(+(A h )) % ( t "#

33 Computing Euler characteristic (topological measure) Partition search region into voxels. EC = # volume - # faces + # edges - # vertices

34 Heuristic Motivation for Adler s formula $ ' P& supt(t) > h) * P(+(A h ) > 0) * E(+(A h )) % ( t "# For very high h value, the Euler characteristic counts the number of clusters, which is one.
35 Plot of expected EC over threshold P-value estimation only valid for high threshold

36 Expected Euler Characteristic Smoothness of random field Hidden in this formula

37 Expected EC for a stationary Gaussian field Smoothness of random field. Proportional to 1/FWHM
38 Unified Resel Approach (works for irregular search volume, small ROI, surface) RESEL EC-density: differently defined from one paper to another: the main cause of confusion. Note: Do not interpret it as the number of independent clusters. Geometric measure of search region (volume, area etc)
39 T-stat result for 3D convex search volume These terms are small compared to the 3D Resel term.
40 1st order approximation The last term dominates the expansion. In practice, it is sufficient to use the last term only.
41 Smoothness in random field theory Gaussian random field Arbitrary random field Determinant of the covariance matrix of derivative of field
42 Smoothness Estimation % 1 ' 0 L 0 2 $ # ' 2 1 " = ' 0 0 M ' 2 $ # 2 ' M 0 O 0 ' 0 L 0 & 1 2 $ # 2 ( * * * * * * ) For anisotropic kernel, we obtain symmetric positive definite covariance matrix. " 1/ 2 = 1 2 N / 2 ( $ #) N Small Large --> more smooth --> less smooth

43 FWHM (full width at half maximum) Linear relationship between FWHM and bandwidth
44 Smoothness term FWHM = " # 8ln2 " 1/ 2 = 1 2 N / 2 ( $ #) N = (4 log2)n / 2 FWHM N
45 Main issue in estimating smoothness of noise component Unbiased estimate of FWHM is important for P-value computation Enable us to compare results across different studies properly.
46 Main issue on FWHM estimation Linear model at each voxel t: Gaussian white noise Spatially varying parameter: After smoothing we have the following model: Smoothness of kernel and smoothness of residual may not match.
47 Large kernel bandwidth For large kernel smoothing bandwidth, No need for estimating FWHM from the residual of a linear model.
48 Small kernel bandwidth It provides more accurate P-value computation. Any nonstandard smoothing approach surface-based smoothing and anisotropic smoothing require this approach.
49 Smoothness of linear model 1. Estimate the residual at each voxel: 2. Compute the partial derivatives using the finite difference "R(t) # R(t + $t i) % R(t) "t i $t i For 3D image, 3 partial derivatives are required. For 2D image (or surface), 2 partial derivatives.
50 3. At each voxel, construct the partial derivative vector "R "t = # % % % % % % $ "R(t) "t 1 "R(t) "t 2 "R(t) "t 3 & ( ( ( ( ( ( ' 4. Compute the covariance matrix using the sample covariance matrix $ " = cov #R ' & ) % #t ( 5. Compute the determinant (It will not be uniform in majority of studies. Weakness of this approach). 6. Average the determinant across voxel.
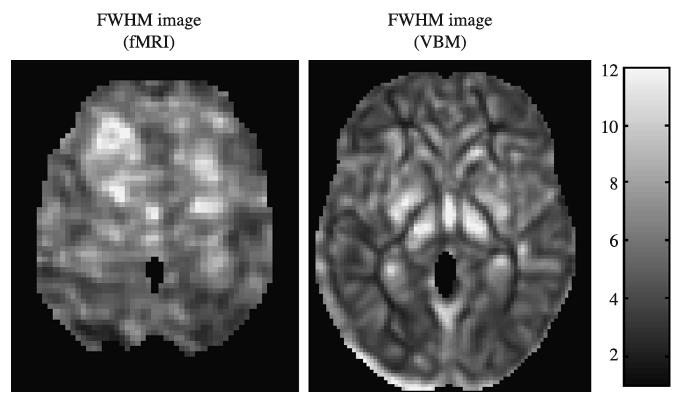
51 Nonuniformity of FWHM

52 For nonstationary images, we figure out the deformation that makes image stationary and estimate the smoothness. See Hayasaka et al. NeuroImage 22:
53 Permutation Method Simulation based approach to numerically estimate the distribution of the sup T(t) under the null hypothesis. Find units exchangeable under the null hypothesis. There may be a situation we may not able to exchange.

54 Two sample example Group A (n subjects) vs. Group B (m subjects) Null hypothesis: equal distribution between groups. Mix all subjects together. Separate the mixed subjects into n subjects and m subjects. There are possible permutations. " n + m% $ ' # n & Need to assume the joint distribution of each permutation is identical.
55 Example Group A (AAA) Group B (BBB) # permutation = =20 " 3 + 3% $ ' # 3 &
 and threshold at 5% level.")
56 Compute the sup T(t) for each permutation. Construct histogram of sup T(t) and threshold at 5% level. Pantazis et al. NeuroImage 2005.
57 Permutation test - model free statistical inference Not recommended for most of studies. 5% More than 1500 permutations are needed to guarantee the convergence of the thresholding. 8 hours of running time in MATLAB.
58 Lecture 11 Topics Anisotropic Smoothing & Anisotropic Diffusion Lecture 12 Topics Guest Lecture by Prof. Li Shen
Correction for multiple comparisons. Cyril Pernet, PhD SBIRC/SINAPSE University of Edinburgh
 Correction for multiple comparisons Cyril Pernet, PhD SBIRC/SINAPSE University of Edinburgh Overview Multiple comparisons correction procedures Levels of inferences (set, cluster, voxel) Circularity issues
Multiple comparisons problem and solutions
 Multiple comparisons problem and solutions James M. Kilner http://sites.google.com/site/kilnerlab/home What is the multiple comparisons problem How can it be avoided Ways to correct for the multiple comparisons
Multiple Testing and Thresholding
 Multiple Testing and Thresholding UCLA Advanced NeuroImaging Summer School, 2007 Thanks for the slides Tom Nichols! Overview Multiple Testing Problem Which of my 100,000 voxels are active? Two methods
Extending the GLM. Outline. Mixed effects motivation Evaluating mixed effects methods Three methods. Conclusions. Overview
 Extending the GLM So far, we have considered the GLM for one run in one subject The same logic can be applied to multiple runs and multiple subjects GLM Stats For any given region, we can evaluate the
Multiple Testing and Thresholding
 Multiple Testing and Thresholding NITP, 2009 Thanks for the slides Tom Nichols! Overview Multiple Testing Problem Which of my 100,000 voxels are active? Two methods for controlling false positives Familywise
New and best-practice approaches to thresholding
 New and best-practice approaches to thresholding Thomas Nichols, Ph.D. Department of Statistics & Warwick Manufacturing Group University of Warwick FIL SPM Course 17 May, 2012 1 Overview Why threshold?
Introductory Concepts for Voxel-Based Statistical Analysis
 Introductory Concepts for Voxel-Based Statistical Analysis John Kornak University of California, San Francisco Department of Radiology and Biomedical Imaging Department of Epidemiology and Biostatistics
Multiple Testing and Thresholding
 Multiple Testing and Thresholding NITP, 2010 Thanks for the slides Tom Nichols! Overview Multiple Testing Problem Which of my 100,000 voxels are active? Two methods for controlling false positives Familywise
Controlling for multiple comparisons in imaging analysis. Wednesday, Lecture 2 Jeanette Mumford University of Wisconsin - Madison
 Controlling for multiple comparisons in imaging analysis Wednesday, Lecture 2 Jeanette Mumford University of Wisconsin - Madison Motivation Run 100 hypothesis tests on null data using p
Linear Models in Medical Imaging. John Kornak MI square February 22, 2011
 Linear Models in Medical Imaging John Kornak MI square February 22, 2011 Acknowledgement / Disclaimer Many of the slides in this lecture have been adapted from slides available in talks available on the
Advances in FDR for fmri -p.1
 Advances in FDR for fmri Ruth Heller Department of Statistics, University of Pennsylvania Joint work with: Yoav Benjamini, Nava Rubin, Damian Stanley, Daniel Yekutieli, Yulia Golland, Rafael Malach Advances
Contents. comparison. Multiple comparison problem. Recap & Introduction Inference & multiple. «Take home» message. DISCOS SPM course, CRC, Liège, 2009
 DISCOS SPM course, CRC, Liège, 2009 Contents Multiple comparison problem Recap & Introduction Inference & multiple comparison «Take home» message C. Phillips, Centre de Recherches du Cyclotron, ULg, Belgium
Linear Models in Medical Imaging. John Kornak MI square February 19, 2013
 Linear Models in Medical Imaging John Kornak MI square February 19, 2013 Acknowledgement / Disclaimer Many of the slides in this lecture have been adapted from slides available in talks available on the
Linear Models in Medical Imaging. John Kornak MI square February 23, 2010
 Linear Models in Medical Imaging John Kornak MI square February 23, 2010 Acknowledgement / Disclaimer Many of the slides in this lecture have been adapted from slides available in talks available on the
Controlling for mul2ple comparisons in imaging analysis. Where we re going. Where we re going 8/15/16
 Controlling for mul2ple comparisons in imaging analysis Wednesday, Lecture 2 Jeane?e Mumford University of Wisconsin - Madison Where we re going Review of hypothesis tes2ng introduce mul2ple tes2ng problem
Controlling for mul-ple comparisons in imaging analysis. Wednesday, Lecture 2 Jeane:e Mumford University of Wisconsin - Madison
 Controlling for mul-ple comparisons in imaging analysis Wednesday, Lecture 2 Jeane:e Mumford University of Wisconsin - Madison Where we re going Review of hypothesis tes-ng introduce mul-ple tes-ng problem
Linear Models in Medical Imaging. John Kornak MI square February 21, 2012
 Linear Models in Medical Imaging John Kornak MI square February 21, 2012 Acknowledgement / Disclaimer Many of the slides in this lecture have been adapted from slides available in talks available on the
7/15/2016 ARE YOUR ANALYSES TOO WHY IS YOUR ANALYSIS PARAMETRIC? PARAMETRIC? That s not Normal!
 ARE YOUR ANALYSES TOO PARAMETRIC? That s not Normal! Martin M Monti http://montilab.psych.ucla.edu WHY IS YOUR ANALYSIS PARAMETRIC? i. Optimal power (defined as the probability to detect a real difference)
Detecting Changes In Non-Isotropic Images
 Detecting Changes In Non-Isotropic Images K.J. Worsley 1, M. Andermann 1, T. Koulis 1, D. MacDonald, 2 and A.C. Evans 2 August 4, 1999 1 Department of Mathematics and Statistics, 2 Montreal Neurological
Introduction to fmri. Pre-processing
 Introduction to fmri Pre-processing Tibor Auer Department of Psychology Research Fellow in MRI Data Types Anatomical data: T 1 -weighted, 3D, 1/subject or session - (ME)MPRAGE/FLASH sequence, undistorted
Statistical inference on images
 7 Statistical inference on images The goal of statistical inference is to make decisions based on our data, while accounting for uncertainty due to noise in the data. From a broad perspective, statistical
SnPM is an SPM toolbox developed by Andrew Holmes & Tom Nichols
 1 of 14 3/30/2005 9:24 PM SnPM A Worked fmri Example SnPM is an SPM toolbox developed by Andrew Holmes & Tom Nichols This page... introduction example data background design setup computation viewing results
Introduction to Neuroimaging Janaina Mourao-Miranda
 Introduction to Neuroimaging Janaina Mourao-Miranda Neuroimaging techniques have changed the way neuroscientists address questions about functional anatomy, especially in relation to behavior and clinical
An improved theoretical P-value for SPMs based on discrete local maxima
 An improved theoretical P-value for SPMs based on discrete local maxima K.J. Worsley August 9, 25 Department of Mathematics and Statistics, McGill University, 85 Sherbrooke St. West, Montreal, Québec,
Statistical Methods in functional MRI. False Discovery Rate. Issues with FWER. Lecture 7.2: Multiple Comparisons ( ) 04/25/13
 04/25/13") Statistical Methods in functional MRI Lecture 7.2: Multiple Comparisons 04/25/13 Martin Lindquist Department of iostatistics Johns Hopkins University Issues with FWER Methods that control the FWER (onferroni,
Statistical Methods in functional MRI Lecture 7.2: Multiple Comparisons 04/25/13 Martin Lindquist Department of iostatistics Johns Hopkins University Issues with FWER Methods that control the FWER (onferroni,
EMPIRICALLY INVESTIGATING THE STATISTICAL VALIDITY OF SPM, FSL AND AFNI FOR SINGLE SUBJECT FMRI ANALYSIS
 EMPIRICALLY INVESTIGATING THE STATISTICAL VALIDITY OF SPM, FSL AND AFNI FOR SINGLE SUBJECT FMRI ANALYSIS Anders Eklund a,b,c, Thomas Nichols d, Mats Andersson a,c, Hans Knutsson a,c a Department of Biomedical
Bias in Resampling-Based Thresholding of Statistical Maps in fmri
 Bias in Resampling-Based Thresholding of Statistical Maps in fmri Ola Friman and Carl-Fredrik Westin Laboratory of Mathematics in Imaging, Department of Radiology Brigham and Women s Hospital, Harvard
Power analysis. Wednesday, Lecture 3 Jeanette Mumford University of Wisconsin - Madison
 Power analysis Wednesday, Lecture 3 Jeanette Mumford University of Wisconsin - Madison Power Analysis-Why? To answer the question. How many subjects do I need for my study? How many runs per subject should
Network statistics and thresholding
 Network statistics and thresholding Andrew Zalesky azalesky@unimelb.edu.au HBM Educational Course June 25, 2017 Network thresholding Unthresholded Moderate thresholding Severe thresholding Strong link
Neuroimage Processing
 Neuroimage Processing Instructor: Moo K. Chung mkchung@wisc.edu Lecture 2-3. General Linear Models (GLM) Voxel-based Morphometry (VBM) September 11, 2009 What is GLM The general linear model (GLM) is a
CHAPTER 2. Morphometry on rodent brains. A.E.H. Scheenstra J. Dijkstra L. van der Weerd
 CHAPTER 2 Morphometry on rodent brains A.E.H. Scheenstra J. Dijkstra L. van der Weerd This chapter was adapted from: Volumetry and other quantitative measurements to assess the rodent brain, In vivo NMR
Chapter 6: Linear Model Selection and Regularization
 Chapter 6: Linear Model Selection and Regularization As p (the number of predictors) comes close to or exceeds n (the sample size) standard linear regression is faced with problems. The variance of the
First-level fmri modeling
 First-level fmri modeling Monday, Lecture 3 Jeanette Mumford University of Wisconsin - Madison What do we need to remember from the last lecture? What is the general structure of a t- statistic? How about
Basic fmri Design and Analysis. Preprocessing
 Basic fmri Design and Analysis Preprocessing fmri Preprocessing Slice timing correction Geometric distortion correction Head motion correction Temporal filtering Intensity normalization Spatial filtering
Cluster failure: Why fmri inferences for spatial extent have inflated false positive rates
 Supporting Information Appendix Cluster failure: Why fmri inferences for spatial extent have inflated false positive rates Anders Eklund, Thomas Nichols, Hans Knutsson Methods Resting state fmri data Resting
Functional MRI in Clinical Research and Practice Preprocessing
 Functional MRI in Clinical Research and Practice Preprocessing fmri Preprocessing Slice timing correction Geometric distortion correction Head motion correction Temporal filtering Intensity normalization
SPM8 for Basic and Clinical Investigators. Preprocessing. fmri Preprocessing
 SPM8 for Basic and Clinical Investigators Preprocessing fmri Preprocessing Slice timing correction Geometric distortion correction Head motion correction Temporal filtering Intensity normalization Spatial
Statistical Methods in functional MRI. Standard Analysis. Data Processing Pipeline. Multiple Comparisons Problem. Multiple Comparisons Problem
 Statistical Methods in fnctional MRI Lectre 7: Mltiple Comparisons 04/3/13 Martin Lindqist Department of Biostatistics Johns Hopkins University Data Processing Pipeline Standard Analysis Data Acqisition
1 Introduction Motivation and Aims Functional Imaging Computational Neuroanatomy... 12
 Contents 1 Introduction 10 1.1 Motivation and Aims....... 10 1.1.1 Functional Imaging.... 10 1.1.2 Computational Neuroanatomy... 12 1.2 Overview of Chapters... 14 2 Rigid Body Registration 18 2.1 Introduction.....
Set up of the data is similar to the Randomized Block Design situation. A. Chang 1. 1) Setting up the data sheet
 Setting up the data sheet") Repeated Measure Analysis (Univariate Mixed Effect Model Approach) (Treatment as the Fixed Effect and the Subject as the Random Effect) (This univariate approach can be used for randomized block design
Repeated Measure Analysis (Univariate Mixed Effect Model Approach) (Treatment as the Fixed Effect and the Subject as the Random Effect) (This univariate approach can be used for randomized block design
Statistical topological data analysis using. Persistence landscapes
 Motivation Persistence landscape Statistical topological data analysis using persistence landscapes Cleveland State University February 3, 2014 funded by AFOSR Motivation Persistence landscape Topological
Computational Methods in NeuroImage Analysis!
 Computational Methods in NeuroImage Analysis! Instructor: Moo K. Chung" mkchung@wisc.edu" Lecture 8" Geometric computation" October 29, 2010" NOTICE! Final Exam: December 3 9:00-12:00am (35%)" Topics:
The Effect of Correlation and Error Rate Specification on Thresholding Methods in fmri Analysis
 The Effect of Correlation and Error Rate Specification on Thresholding Methods in fmri Analysis Brent R. Logan and Daniel B. Rowe, Division of Biostatistics and Department of Biophysics Division of Biostatistics
Group Sta*s*cs in MEG/EEG
 Group Sta*s*cs in MEG/EEG Will Woods NIF Fellow Brain and Psychological Sciences Research Centre Swinburne University of Technology A Cau*onary tale. A Cau*onary tale. A Cau*onary tale. Overview Introduc*on
Statistical Analysis of Neuroimaging Data. Phebe Kemmer BIOS 516 Sept 24, 2015
 Statistical Analysis of Neuroimaging Data Phebe Kemmer BIOS 516 Sept 24, 2015 Review from last time Structural Imaging modalities MRI, CAT, DTI (diffusion tensor imaging) Functional Imaging modalities
Pattern Recognition for Neuroimaging Data
 Pattern Recognition for Neuroimaging Data Edinburgh, SPM course April 2013 C. Phillips, Cyclotron Research Centre, ULg, Belgium http://www.cyclotron.ulg.ac.be Overview Introduction Univariate & multivariate
Region-based Segmentation
 Region-based Segmentation Image Segmentation Group similar components (such as, pixels in an image, image frames in a video) to obtain a compact representation. Applications: Finding tumors, veins, etc.
FMRI Pre-Processing and Model- Based Statistics
 FMRI Pre-Processing and Model- Based Statistics Brief intro to FMRI experiments and analysis FMRI pre-stats image processing Simple Single-Subject Statistics Multi-Level FMRI Analysis Advanced FMRI Analysis
Bayesian Inference in fmri Will Penny
 Bayesian Inference in fmri Will Penny Bayesian Approaches in Neuroscience Karolinska Institutet, Stockholm February 2016 Overview Posterior Probability Maps Hemodynamic Response Functions Population
MultiVariate Bayesian (MVB) decoding of brain images
 decoding of brain images") MultiVariate Bayesian (MVB) decoding of brain images Alexa Morcom Edinburgh SPM course 2015 With thanks to J. Daunizeau, K. Brodersen for slides stimulus behaviour encoding of sensorial or cognitive state?
MultiVariate Bayesian (MVB) decoding of brain images Alexa Morcom Edinburgh SPM course 2015 With thanks to J. Daunizeau, K. Brodersen for slides stimulus behaviour encoding of sensorial or cognitive state?
Controlling the Familywise Error Rate in Functional Neuroimaging: A Comparative Review
 Controlling the Familywise Error Rate in Functional Neuroimaging: A Comparative Review Thomas Nichols & Satoru Hayasaka Departments of Biostatistics University of Michigan, Ann Arbor, MI 48109, U.S.A.
Quantitative Biology II!
 Quantitative Biology II! Lecture 3: Markov Chain Monte Carlo! March 9, 2015! 2! Plan for Today!! Introduction to Sampling!! Introduction to MCMC!! Metropolis Algorithm!! Metropolis-Hastings Algorithm!!
Quality Checking an fmri Group Result (art_groupcheck)
") Quality Checking an fmri Group Result (art_groupcheck) Paul Mazaika, Feb. 24, 2009 A statistical parameter map of fmri group analyses relies on the assumptions of the General Linear Model (GLM). The assumptions
Quality Checking an fmri Group Result (art_groupcheck) Paul Mazaika, Feb. 24, 2009 A statistical parameter map of fmri group analyses relies on the assumptions of the General Linear Model (GLM). The assumptions
Final Exam Assigned: 11/21/02 Due: 12/05/02 at 2:30pm
 6.801/6.866 Machine Vision Final Exam Assigned: 11/21/02 Due: 12/05/02 at 2:30pm Problem 1 Line Fitting through Segmentation (Matlab) a) Write a Matlab function to generate noisy line segment data with
Clustering Lecture 5: Mixture Model
 Clustering Lecture 5: Mixture Model Jing Gao SUNY Buffalo 1 Outline Basics Motivation, definition, evaluation Methods Partitional Hierarchical Density-based Mixture model Spectral methods Advanced topics
Function-Structure Integration in FreeSurfer
 Function-Structure Integration in FreeSurfer Outline Function-Structure Integration Function-Structure Registration in FreeSurfer fmri Analysis Preprocessing First-Level Analysis Higher-Level (Group) Analysis
A Non-Parametric Approach
 Andrew P. Holmes. Ph.D., 1994. Chapter Six A Non-Parametric Approach In this chapter, a non-parametric approach to assessing functional mapping experiments is presented. A multiple comparisons randomisation
EPI Data Are Acquired Serially. EPI Data Are Acquired Serially 10/23/2011. Functional Connectivity Preprocessing. fmri Preprocessing
 Functional Connectivity Preprocessing Geometric distortion Head motion Geometric distortion Head motion EPI Data Are Acquired Serially EPI Data Are Acquired Serially descending 1 EPI Data Are Acquired
Fields. J-B. Poline A.P. Holmes K.J. Worsley K.J. Friston. 1 Introduction 2. 2 Testing for the intensity of an activation in SPMs 3
 Statistical Inference and the Theory of Random Fields J-B. Poline A.P. Holmes K.J. Worsley K.J. Friston Contents 1 Introduction 2 2 Testing for the intensity of an activation in SPMs 3 2.1 Theory : : :
HST.583 Functional Magnetic Resonance Imaging: Data Acquisition and Analysis Fall 2006
 MIT OpenCourseWare http://ocw.mit.edu HST.583 Functional Magnetic Resonance Imaging: Data Acquisition and Analysis Fall 2006 For information about citing these materials or our Terms of Use, visit: http://ocw.mit.edu/terms.
The organization of the human cerebral cortex estimated by intrinsic functional connectivity
 1 The organization of the human cerebral cortex estimated by intrinsic functional connectivity Journal: Journal of Neurophysiology Author: B. T. Thomas Yeo, et al Link: https://www.ncbi.nlm.nih.gov/pubmed/21653723
Fmri Spatial Processing
 Educational Course: Fmri Spatial Processing Ray Razlighi Jun. 8, 2014 Spatial Processing Spatial Re-alignment Geometric distortion correction Spatial Normalization Smoothing Why, When, How, Which Why is
STATISTICS (STAT) Statistics (STAT) 1
 Statistics (STAT) 1") Statistics (STAT) 1 STATISTICS (STAT) STAT 2013 Elementary Statistics (A) Prerequisites: MATH 1483 or MATH 1513, each with a grade of "C" or better; or an acceptable placement score (see placement.okstate.edu).
Statistics (STAT) 1 STATISTICS (STAT) STAT 2013 Elementary Statistics (A) Prerequisites: MATH 1483 or MATH 1513, each with a grade of "C" or better; or an acceptable placement score (see placement.okstate.edu).
5. Feature Extraction from Images
 5. Feature Extraction from Images Aim of this Chapter: Learn the Basic Feature Extraction Methods for Images Main features: Color Texture Edges Wie funktioniert ein Mustererkennungssystem Test Data x i
TOPOLOGICAL INFERENCE FOR EEG AND MEG 1. BY JAMES M. KILNER AND KARL J. FRISTON University College London
 The Annals of Applied Statistics 2010, Vol. 4, No. 3, 1272 1290 DOI: 10.1214/10-AOAS337 Institute of Mathematical Statistics, 2010 TOPOLOGICAL INFERENCE FOR EEG AND MEG 1 BY JAMES M. KILNER AND KARL J.
Data Visualisation in SPM: An introduction
 Data Visualisation in SPM: An introduction Alexa Morcom Edinburgh SPM course, April 2015 SPMmip [-30, 3, -9] 3 Visualising results remembered vs. fixation contrast(s) < < After the results table - what
Data Visualisation in SPM: An introduction
 Data Visualisation in SPM: An introduction Alexa Morcom Edinburgh SPM course, April 2010 Centre for Cognitive & Neural Systems/ Department of Psychology University of Edinburgh Visualising results remembered
Conditional Volatility Estimation by. Conditional Quantile Autoregression
 International Journal of Mathematical Analysis Vol. 8, 2014, no. 41, 2033-2046 HIKARI Ltd, www.m-hikari.com http://dx.doi.org/10.12988/ijma.2014.47210 Conditional Volatility Estimation by Conditional Quantile
Single Subject Demo Data Instructions 1) click "New" and answer "No" to the "spatially preprocess" question.
 click New and answer No to the spatially preprocess question.") (1) conn - Functional connectivity toolbox v1.0 Single Subject Demo Data Instructions 1) click "New" and answer "No" to the "spatially preprocess" question. 2) in "Basic" enter "1" subject, "6" seconds
(1) conn - Functional connectivity toolbox v1.0 Single Subject Demo Data Instructions 1) click "New" and answer "No" to the "spatially preprocess" question. 2) in "Basic" enter "1" subject, "6" seconds
Analysis of Functional MRI Timeseries Data Using Signal Processing Techniques
 Analysis of Functional MRI Timeseries Data Using Signal Processing Techniques Sea Chen Department of Biomedical Engineering Advisors: Dr. Charles A. Bouman and Dr. Mark J. Lowe S. Chen Final Exam October
SPM8 for Basic and Clinical Investigators. Preprocessing
 SPM8 for Basic and Clinical Investigators Preprocessing fmri Preprocessing Slice timing correction Geometric distortion correction Head motion correction Temporal filtering Intensity normalization Spatial
Supervised vs. Unsupervised Learning
 Clustering Supervised vs. Unsupervised Learning So far we have assumed that the training samples used to design the classifier were labeled by their class membership (supervised learning) We assume now
3D Computer Vision. Structured Light II. Prof. Didier Stricker. Kaiserlautern University.
 3D Computer Vision Structured Light II Prof. Didier Stricker Kaiserlautern University http://ags.cs.uni-kl.de/ DFKI Deutsches Forschungszentrum für Künstliche Intelligenz http://av.dfki.de 1 Introduction
Missing Data Analysis for the Employee Dataset
 Missing Data Analysis for the Employee Dataset 67% of the observations have missing values! Modeling Setup For our analysis goals we would like to do: Y X N (X, 2 I) and then interpret the coefficients
Supplementary methods
 Supplementary methods This section provides additional technical details on the sample, the applied imaging and analysis steps and methods. Structural imaging Trained radiographers placed all participants
Computational Neuroanatomy
 Computational Neuroanatomy John Ashburner john@fil.ion.ucl.ac.uk Smoothing Motion Correction Between Modality Co-registration Spatial Normalisation Segmentation Morphometry Overview fmri time-series kernel
The expected Euler characteristic approximation for Gaussian vectorapril fields1, / 21
 The expected Euler characteristic approximation for Gaussian vector fields Dan Cheng Texas Tech University (joint work with Yimin Xiao) April 1, 2017 The expected Euler characteristic approximation for
Statistical Parametric Maps for Functional MRI Experiments in R: The Package fmri
 Weierstrass Institute for Applied Analysis and Stochastics Statistical Parametric Maps for Functional MRI Experiments in R: The Package fmri Karsten Tabelow UseR!2011 Mohrenstrasse 39 10117 Berlin Germany
Structured Light II. Thanks to Ronen Gvili, Szymon Rusinkiewicz and Maks Ovsjanikov
 Structured Light II Johannes Köhler Johannes.koehler@dfki.de Thanks to Ronen Gvili, Szymon Rusinkiewicz and Maks Ovsjanikov Introduction Previous lecture: Structured Light I Active Scanning Camera/emitter
Topics in Machine Learning-EE 5359 Model Assessment and Selection
 Topics in Machine Learning-EE 5359 Model Assessment and Selection Ioannis D. Schizas Electrical Engineering Department University of Texas at Arlington 1 Training and Generalization Training stage: Utilizing
Wavelet Applications. Texture analysis&synthesis. Gloria Menegaz 1
 Wavelet Applications Texture analysis&synthesis Gloria Menegaz 1 Wavelet based IP Compression and Coding The good approximation properties of wavelets allow to represent reasonably smooth signals with
An Introduction to PDF Estimation and Clustering
 Sigmedia, Electronic Engineering Dept., Trinity College, Dublin. 1 An Introduction to PDF Estimation and Clustering David Corrigan corrigad@tcd.ie Electrical and Electronic Engineering Dept., University
Lecture 10: Image Descriptors and Representation
 I2200: Digital Image processing Lecture 10: Image Descriptors and Representation Prof. YingLi Tian Nov. 15, 2017 Department of Electrical Engineering The City College of New York The City University of
Mixture Models and EM
 Mixture Models and EM Goal: Introduction to probabilistic mixture models and the expectationmaximization (EM) algorithm. Motivation: simultaneous fitting of multiple model instances unsupervised clustering
arxiv: v1 [stat.ap] 1 Jun 2016
![arxiv: v1 [stat.ap] 1 Jun 2016](/thumbs/81/83094240.jpg "arxiv: v1 [stat.ap] 1 Jun 2016") Permutation-based cluster size correction for voxel-based lesion-symptom mapping arxiv:1606.00475v1 [stat.ap] 1 Jun 2016 June 3, 2016 Daniel Mirman a,b,1 Jon-Frederick Landrigan a Spiro Kokolis a Sean
Permutation-based cluster size correction for voxel-based lesion-symptom mapping arxiv:1606.00475v1 [stat.ap] 1 Jun 2016 June 3, 2016 Daniel Mirman a,b,1 Jon-Frederick Landrigan a Spiro Kokolis a Sean
Overview Citation. ML Introduction. Overview Schedule. ML Intro Dataset. Introduction to Semi-Supervised Learning Review 10/4/2010
 INFORMATICS SEMINAR SEPT. 27 & OCT. 4, 2010 Introduction to Semi-Supervised Learning Review 2 Overview Citation X. Zhu and A.B. Goldberg, Introduction to Semi- Supervised Learning, Morgan & Claypool Publishers,
Voxel-Based Morphometry & DARTEL. Ged Ridgway, London With thanks to John Ashburner and the FIL Methods Group
 Zurich SPM Course 2012 Voxel-Based Morphometry & DARTEL Ged Ridgway, London With thanks to John Ashburner and the FIL Methods Group Aims of computational neuroanatomy * Many interesting and clinically
Package MixSim. April 29, 2017
 Version 1.1-3 Date 2017-04-22 Package MixSim April 29, 2017 Title Simulating Data to Study Performance of Clustering Algorithms Depends R (>= 3.0.0), MASS Enhances mclust, cluster LazyLoad yes LazyData
Computational Methods in NeuroImage Analysis
 Computational Methods in NeuroImage Analysis Instructor: Moo K. Chung mchung@wisc.edu September3, 2010 Instructor Moo K. Chung Associate Professor of Biostatistics and Medical Informatics University of
2D Image Processing INFORMATIK. Kaiserlautern University. DFKI Deutsches Forschungszentrum für Künstliche Intelligenz
 2D Image Processing - Filtering Prof. Didier Stricker Kaiserlautern University http://ags.cs.uni-kl.de/ DFKI Deutsches Forschungszentrum für Künstliche Intelligenz http://av.dfki.de 1 What is image filtering?
Methods for data preprocessing
 Methods for data preprocessing John Ashburner Wellcome Trust Centre for Neuroimaging, 12 Queen Square, London, UK. Overview Voxel-Based Morphometry Morphometry in general Volumetrics VBM preprocessing
Data Mining Chapter 3: Visualizing and Exploring Data Fall 2011 Ming Li Department of Computer Science and Technology Nanjing University
 Data Mining Chapter 3: Visualizing and Exploring Data Fall 2011 Ming Li Department of Computer Science and Technology Nanjing University Exploratory data analysis tasks Examine the data, in search of structures
Attention modulates spatial priority maps in human occipital, parietal, and frontal cortex
 Attention modulates spatial priority maps in human occipital, parietal, and frontal cortex Thomas C. Sprague 1 and John T. Serences 1,2 1 Neuroscience Graduate Program, University of California San Diego
Time Series Analysis by State Space Methods
 Time Series Analysis by State Space Methods Second Edition J. Durbin London School of Economics and Political Science and University College London S. J. Koopman Vrije Universiteit Amsterdam OXFORD UNIVERSITY
Schedule for Rest of Semester
 Schedule for Rest of Semester Date Lecture Topic 11/20 24 Texture 11/27 25 Review of Statistics & Linear Algebra, Eigenvectors 11/29 26 Eigenvector expansions, Pattern Recognition 12/4 27 Cameras & calibration
Parametric Texture Model based on Joint Statistics
 Parametric Texture Model based on Joint Statistics Gowtham Bellala, Kumar Sricharan, Jayanth Srinivasa Department of Electrical Engineering, University of Michigan, Ann Arbor 1. INTRODUCTION Texture images
CS 229 Midterm Review
 CS 229 Midterm Review Course Staff Fall 2018 11/2/2018 Outline Today: SVMs Kernels Tree Ensembles EM Algorithm / Mixture Models [ Focus on building intuition, less so on solving specific problems. Ask
Independent Component Analysis of fmri Data
 Independent Component Analysis of fmri Data Denise Miller April 2005 Introduction Techniques employed to analyze functional magnetic resonance imaging (fmri) data typically use some form of univariate
Neuroimaging and mathematical modelling Lesson 2: Voxel Based Morphometry
 Neuroimaging and mathematical modelling Lesson 2: Voxel Based Morphometry Nivedita Agarwal, MD Nivedita.agarwal@apss.tn.it Nivedita.agarwal@unitn.it Volume and surface morphometry Brain volume White matter
Chapter 3 Image Registration. Chapter 3 Image Registration
 Chapter 3 Image Registration Distributed Algorithms for Introduction (1) Definition: Image Registration Input: 2 images of the same scene but taken from different perspectives Goal: Identify transformation