Visualization, Lecture #2d. Part 3 (of 3)
|
|
|
- Arabella Hensley
- 5 years ago
- Views:
Transcription
1 Visualization, Lecture #2d Flow visualization Flow visualization, Part 3 (of 3)
2 Retrospect: Lecture #2c Flow Visualization, Part 2: FlowVis with arrows numerical integration Euler-integration Runge-Kutta-integration streamlines in 2D particle paths in 3D, sweeps illuminated streamlines streamline placement Helwig Hauser 2
3 Overview: Lecture #2d Flow Visualization, Part 3: flow visualization with integral objects streamribbons, streamsurfaces, stream arrows line integral convolution algorithm examples, alternatives glyphs & icons, flow topology summary Helwig Hauser 3
4 Flow Visualization with Integral Objects Streamribbons, Streamsurfaces, etc.
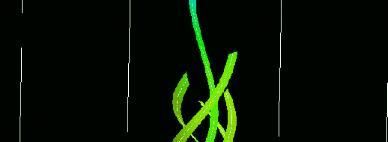
5 Integral Objects in 3D 1/3 Streamribbons Helwig Hauser 5
6 Streamribbon Generation Start with a 3D point x i=0 and a 2 nd one y i=0 in a particular dist. d, i.e. (x i -y i )²=d² Loop: Do an integration step from x i to yield x i+1 Do an integration step from y i to yield z renormalize the dist. between x i+1 & z to d, ie i.e. y i+1 =x i+1 +d (z-x i+1 )/ z-x i+1 End streamribbon integration ti if wanted Helwig Hauser, Eduard Gröller 6


7 Integral Objects in 3D 2/3 Streamsurfaces Helwig Hauser 7


8 Streamsurfaces split / merge Helwig Hauser 8


9 Helwig Hauser 9 Stream Arrows


")
10 Integral Objects in 3D 3/3 Flow volumes vs. streamtubes (similar to streamribbon) Helwig Hauser 10
11 Relation to Seed Objects IntegralObj. Dim. SeedObj. Dim. Streamline, 1D Point 0D Streamribbon 1D++ Point+pt. 0D+0D Streamtubet 1D++ Pt.+cont. t 0D+1D Streamsurface 2D Curve 1D Flow volume 3D Patch 2D Helwig Hauser 11
12 Line Integral Convolution Flow Visualization Flow Visualization in 2D or on surfaces


13 LIC Introduction Aspects: goal: general overview of flow Approach: usage of textures Idea: flow visual correlation Example: Helwig Hauser 13
14 LIC Approach LIC idea: for every texel: let the texture value correlate with neighboring texture values along the flow (in flow direction) not correlate with neighboring texture values across the flow (normal to flow dir.) result: along streamlines the texture t values are correlated visually coherent! approach: smudge white noise (no a priori correlations) along flow Helwig Hauser, Eduard Gröller 14
15 LIC Steps Calculation of a texture value: look at streamline through point filter white noise along streamline Flow Data Streamline (DDA) White Noise Integration Convolution with results in LIC Texel Helwig Hauser 15
16 LIC Convolution with Noise Calculation of LIC texture: input 1: flow data v(x): R n R n, analytically or interpolated input 2: white noise n(x): ( ) R n RR 1, normally precomputed as texture streamline s )th h R x (u) through x: R 1 R n, s x (u) = x + sgn(u) 0 t u v(s x (sgn(u) t)) dt input 3: filter h(t): R 1 RR 1, e.g., Gauss result: texture value lic(x): R n R 1, lic(x) = lic(s x (0)) = n(s x (u)) h( u)du Helwig Hauser 16
17 More Explanation So: LIC lic(x) is a convolution of white noise n (or ) and a smoothing filter h (e.g. a Gaussian) The noise texture values are picked up along streamlines s x through x Helwig Hauser 17
18 LIC Example in 2D quite laminar flow quite turbulent flow Helwig Hauser 18
19 LIC in 2D Further Example Helwig Hauser 19


20 LIC Examples on Surfaces Helwig Hauser 20


21 Arrows vs. StrLines vs. Textures Streamlines: selective Arrows: well.. Textures: 2D-filling Helwig Hauser 21


22 LIC in 3D??! Correlation also possible in 3D: problem of rendering: DVR of 3D LIC Destruction of correlational information! Hence: selective use Helwig Hauser 22
23 Literature Papers (more details): B. Cabral & L. Leedom: Imaging Vector Fields Using Line Integral Convolution in Proceedings of SIGGRAPH 93 = Computer Graphics 27, 1993, pp D. Stalling & H.-C. Hege: Fast and Resolution Independent Line Integral Convolution in Proceedings of SIGGRAPH 95 = Computer Graphics 29, 1995, pp Helwig Hauser 23
24 LIC-Variants OLIC = Oriented Line Integral Convolution visualization of directional information Helwig Hauser 24


25 Texture Advection Steady Flows Helwig Hauser 25


26 Texture Advect. Unsteady Flows Helwig Hauser 26


27 Alternatives to LIC Similar approaches: spot noise vector kernel line bundles /splats textured splats particle systems flow volumes textured splats spot noise flow volume Helwig Hauser 27 motion blurred particles
28 Flow Visualization dependent on local props. Visualization of v


29 Glyphs resp. Icons Local / topological properties Helwig Hauser 29


30 Helwig Hauser 30 Icons in 2D


31 Icons & Glyphs in 3D Helwig Hauser 31
32 Flow Topology Topology: abstract structure of a flow different elements, e.g.: checkpoints, defined through v(x)=0 cycles, defined through s x x( (t+t)=s x x( (t) connecting structures (separatrices, etc.) Helwig Hauser 32
33 Flow Topology in 3D Topology on surfaces: fixed points separati trices Helwig Hauser 33
34 Flow Topology in 3D Lorenz system: 1 saddle 2 saddle foci 1 chaotic attractor Helwig Hauser 34
35 Timesurfaces Idea: start surface, e.g. part of a plane move whole surface along flow over time time surface: surface at one point in time Helwig Hauser 35
36 Flow Visualization summary Overview, Solutions
37 Important Questions Dimensionality? 2D, Surface, 3D? User-Goal? overview, details? Examples: 2D/surfaces+overview LIC (or ), evenly- placed streamlines, hedgehog plots 3D+exemplary selected streamlines, streamsurfaces, etc., 3D arrows on slices unsteady/2d+overview animated texture advection, etc. unsteady/3d+idea animated particles Helwig Hauser 37
38 2D+Overview Helwig Hauser 38


39 3D exemplary Helwig Hauser 39
40 Unsteady/2D+Overview Helwig Hauser 40
41 Unsteady/3D+Idea Helwig Hauser 41
42 Acknowledgements For material used in this lecture: Hans-Georg Pagendarm, Bruno Jobard Jeff Hultquist Lukas Mroz, Rainer Wegenkittl Nelson Max, Will Schroeder et al. Brian Cabral & Leith Leedom David Kenwright Rüdiger Westermann Jack van Wijk, Freik Reinders, Frits Post, Alexandru Telea, Ari Sadarjoen Helwig Hauser 42
Flow Visualization with Integral Objects. Visualization, Lecture #2d. Streamribbons, Streamsurfaces, etc. Flow visualization, Part 3 (of 3)
") Visualization, Lecture #2d Flow visualization, Part 3 (of 3) Flow Visualization with Integral Objects Streamribbons, Streamsurfaces, etc. Retrospect: Lecture #2c Flow Visualization, Part 2: FlowVis with
Visualization, Lecture #2d Flow visualization, Part 3 (of 3) Flow Visualization with Integral Objects Streamribbons, Streamsurfaces, etc. Retrospect: Lecture #2c Flow Visualization, Part 2: FlowVis with
Simulation vs. measurement vs. modelling 2D vs. surfaces vs. 3D Steady vs time-dependent d t flow Direct vs. indirect flow visualization
 Flow Visualization Overview: Flow Visualization (1) Introduction, overview Flow data Simulation vs. measurement vs. modelling 2D vs. surfaces vs. 3D Steady vs time-dependent d t flow Direct vs. indirect
2D vector fields 3. Contents. Line Integral Convolution (LIC) Image based flow visualization Vector field topology. Fast LIC Oriented LIC
 Image based flow visualization Vector field topology. Fast LIC Oriented LIC") 2D vector fields 3 Scientific Visualization (Part 8) PD Dr.-Ing. Peter Hastreiter Contents Line Integral Convolution (LIC) Fast LIC Oriented LIC Image based flow visualization Vector field topology 2 Applied
2D vector fields 3 Scientific Visualization (Part 8) PD Dr.-Ing. Peter Hastreiter Contents Line Integral Convolution (LIC) Fast LIC Oriented LIC Image based flow visualization Vector field topology 2 Applied
Flow Visualisation 1
 Flow Visualisation Visualisation Lecture 13 Institute for Perception, Action & Behaviour School of Informatics Flow Visualisation 1 Flow Visualisation... so far Vector Field Visualisation vector fields
Vector Field Visualisation
 Vector Field Visualisation Computer Animation and Visualization Lecture 14 Institute for Perception, Action & Behaviour School of Informatics Visualising Vectors Examples of vector data: meteorological
Chapter 6 Visualization Techniques for Vector Fields
 Chapter 6 Visualization Techniques for Vector Fields 6.1 Introduction 6.2 Vector Glyphs 6.3 Particle Advection 6.4 Streamlines 6.5 Line Integral Convolution 6.6 Vector Topology 6.7 References 2006 Burkhard
Flow Visualization: The State-of-the-Art
 Flow Visualization: The State-of-the-Art The Visual and Interactive Computing Group Computer Science Department Swansea University Swansea, Wales, UK 1 Overview Introduction to Flow Visualization (FlowViz)
Texture Advection. Ronald Peikert SciVis Texture Advection 6-1
 Texture Advection Ronald Peikert SciVis 2007 - Texture Advection 6-1 Texture advection Motivation: dense visualization of vector fields, no seed points needed. Methods for static fields: LIC - Line integral
The State of the Art in Flow Visualization, part 1: Direct, Texture-based, and Geometric Techniques
 Volume 22 (2003), Number 2, yet unknown pages The State of the Art in Flow Visualization, part 1: Direct, Texture-based, and Geometric Techniques Helwig Hauser, Robert S. Laramee, Helmut Doleisch, Frits
Vector Field Visualization: Introduction
 Vector Field Visualization: Introduction What is a Vector Field? Why It is Important? Vector Fields in Engineering and Science Automotive design [Chen et al. TVCG07,TVCG08] Weather study [Bhatia and Chen
Lecture notes: Visualization I Visualization of vector fields using Line Integral Convolution and volume rendering
 Lecture notes: Visualization I Visualization of vector fields using Line Integral Convolution and volume rendering Anders Helgeland FFI Chapter 1 Visualization techniques for vector fields Vector fields
Vector Field Visualization: Introduction
 Vector Field Visualization: Introduction What is a Vector Field? A simple 2D steady vector field A vector valued function that assigns a vector (with direction and magnitude) to any given point. It typically
Vector Visualization
 Vector Visualization 5-1 Vector Algorithms Vector data is a three-dimensional representation of direction and magnitude. Vector data often results from the study of fluid flow, or when examining derivatives,
The State of the Art in Flow Visualization: Dense and Texture-Based Techniques
 Volume 22 (2003), Number 2, yet unknown pages The State of the Art in Flow Visualization: Dense and Texture-Based Techniques Robert S. Laramee, 1 Helwig Hauser, 1 Helmut Doleisch, 1 Benjamin Vrolijk, 2
Interactive 3D Flow Visualization Based on Textures and Geometric Primitives
 Interactive 3D Flow Visualization Based on Textures and Geometric Primitives Robert S. Laramee and Helwig Hauser www.vrvis.at 1 SUMMARY As the size of CFD simulation data sets expand, the job of the engineer
The State of the Art in Flow Visualization: Dense and Texture-Based Techniques
 Volume 23 (2004), number 2 pp. 203 221 COMPUTER GRAPHICS forum The State of the Art in Flow Visualization: Dense and Texture-Based Techniques Robert S. Laramee, 1 Helwig Hauser, 1 Helmut Doleisch, 1 Benjamin
Vector Visualization. CSC 7443: Scientific Information Visualization
 Vector Visualization Vector data A vector is an object with direction and length v = (v x,v y,v z ) A vector field is a field which associates a vector with each point in space The vector data is 3D representation
Comparing LIC and Spot Noise
 Comparing LIC and Spot Noise Wim de Leeuw Robert van Liere Center for Mathematics and Computer Science, CWI Abstract Spot noise and line integral convolution (LIC) are two texture synthesis techniques
Hierarchical Streamarrows for the Visualization of Dynamical Systems
 Hierarchical Streamarrows for the Visualization of Dynamical Systems Helwig Löffelmann Lukas Mroz Eduard Gröller Institute of Computer Graphics, Vienna University of Technology Abstract. Streamarrows are
Interactive 3D Flow Visualization Based on Textures and Geometric Primitives
 Interactive 3D Flow Visualization Based on Textures and Geometric Primitives Robert S. Laramee and Helwig Hauser www.vrvis.at September 14, 2004 Abstract As the size of CFD simulation data sets expand,
Flow Visualization with Integral Surfaces
 Flow Visualization with Integral Surfaces Visual and Interactive Computing Group Department of Computer Science Swansea University R.S.Laramee@swansea.ac.uk 1 1 Overview Flow Visualization with Integral
Data Visualization (CIS/DSC 468)
") Data Visualization (CIS/DSC 468) Vector Visualization Dr. David Koop Visualizing Volume (3D) Data 2D visualization slice images (or multi-planar reformating MPR) Indirect 3D visualization isosurfaces (or
Data Visualization (CIS/DSC 468) Vector Visualization Dr. David Koop Visualizing Volume (3D) Data 2D visualization slice images (or multi-planar reformating MPR) Indirect 3D visualization isosurfaces (or
Over Two Decades of IntegrationBased, Geometric Vector Field. Visualization
 Over Two Decades of IntegrationBased, Geometric Vector Field Visualization Tony McLoughlin1, 1, Ronald Peikert2, Frits H. Post3, and Min Chen1 1 The Visual and Interactive Computing Group Computer Science
Introduction to Scientific Visualization
 Visualization Definition Introduction to Scientific Visualization Stefan Bruckner visualization: to form a mental vision, image, or picture of (something not visible or present to the sight, or of an abstraction);
AMCS / CS 247 Scientific Visualization Lecture 4: Data Representation, Pt. 1. Markus Hadwiger, KAUST
 AMCS / CS 247 Scientific Visualization Lecture 4: Data Representation, Pt. 1 Markus Hadwiger, KAUST Reading Assignment #2 (until Sep 1) Read (required): Data Visualization book, finish Chapter 2 Data Visualization
Vector Visualization
 Vector Visualization Vector Visulization Divergence and Vorticity Vector Glyphs Vector Color Coding Displacement Plots Stream Objects Texture-Based Vector Visualization Simplified Representation of Vector
A Volume Rendering Framework for Visualizing 3D Flow Fields
 A Volume Rendering Framework for Visualizing 3D Flow Fields Hsien-Hsi HSIEH,, Liya LI, Han-Wei SHEN and Wen-Kai TAI Department of Computer Science and Engineering, The Ohio State University Columbus, OH
Visualizing 3D Velocity Fields Near Contour Surfaces
 Visualizing 3D Velocity Fields Near Contour Surfaces Nelson Max Roger Crawfis Charles Grant Lawrence Livermore National Laboratory Livermore, California 94551 Abstract Vector field rendering is difficult
A Texture-Based Hardware-Independent Technique for Time-Varying Volume Flow Visualization
 Journal of Visualization, Vol. 8, No. 3 (2005) 235-244 A Texture-Based Hardware-Independent Technique for Time-Varying Volume Flow Visualization Liu, Zhanping* and Moorhead II, Robert J.* * ERC / GeoResources
A Level-Set Method for Flow Visualization
 A Level-Set Method for Flow Visualization Rüdiger Westermann, Christopher Johnson, and Thomas Ertl Scientific Computing and Visualization Group, University of Technology Aachen Scientific Computing and
Color-Table Animation of Fast Oriented Line Integral Convolution for Vector Field Visualization
 Color-Table Animation of Fast Oriented Line Integral Convolution for Vector Field Visualization Siegrun Berger, Eduard Gröller Institute of Computer Graphics, Vienna University of Technology Karlsplatz
Flow Visualisation - Background. CITS4241 Visualisation Lectures 20 and 21
 CITS4241 Visualisation Lectures 20 and 21 Flow Visualisation Flow visualisation is important in both science and engineering From a "theoretical" study of o turbulence or o a fusion reactor plasma, to
Visualisierung W, VU, 2.0h, 3.0EC
 Visualisierung 1 2014W, VU, 2.0h, 3.0EC 186.827 Eduard Gröller Johanna Schmidt Oana Moraru Institute of Computer Graphics and Algorithms (ICGA), VUT Austria Visualization Examples VolVis InfoVis FlowVis
Hardware Accelerated Interactive Vector Field Visualization: A level of detail approach
 EUROGRAPHICS 2002 / G. Drettakis and H.-P. Seidel (Guest Editors) Volume 21 (2002), Number 3 Hardware Accelerated Interactive Vector Field Visualization: A level of detail approach Udeepta Bordoloi and
Lecture overview. Visualisatie BMT. Vector algorithms. Vector algorithms. Time animation. Time animation
 Visualisatie BMT Lecture overview Vector algorithms Tensor algorithms Modeling algorithms Algorithms - 2 Arjan Kok a.j.f.kok@tue.nl 1 2 Vector algorithms Vector 2 or 3 dimensional representation of direction
Texture-Based Visualization of Uncertainty in Flow Fields
 Texture-Based Visualization of Uncertainty in Flow Fields Ralf P. Botchen 1 Daniel Weiskopf 1,2 Thomas Ertl 1 1 University of Stuttgart 2 Simon Fraser University Figure 1: Three different advection schemes
Rendering Implicit Flow Volumes
 Rendering Implicit Flow Volumes Daqing Xue, Caixia Zhang, Roger Crawfis* Department of Computer Science and Engineering The Ohio State University (a) (b) (c) Figure 1: Visualization using implicit flow
Vector Visualization Chap. 6 March 7, 2013 March 26, Jie Zhang Copyright
 ector isualization Chap. 6 March 7, 2013 March 26, 2013 Jie Zhang Copyright CDS 301 Spring, 2013 Outline 6.1. Divergence and orticity 6.2. ector Glyphs 6.3. ector Color Coding 6.4. Displacement Plots (skip)
CIS 467/602-01: Data Visualization
 CIS 467/602-01: Data Visualization Vector Field Visualization Dr. David Koop Fields Tables Networks & Trees Fields Geometry Clusters, Sets, Lists Items Items (nodes) Grids Items Items Attributes Links
Data Visualization. Fall 2017
 Data Visualization Fall 2017 Vector Fields Vector field v: D R n D is typically 2D planar surface or 2D surface embedded in 3D n = 2 fields tangent to 2D surface n = 3 volumetric fields When visualizing
Vector Visualisation 1. global view
 Vector Field Visualisation : global view Visualisation Lecture 12 Institute for Perception, Action & Behaviour School of Informatics Vector Visualisation 1 Vector Field Visualisation : local & global Vector
Part I: Theoretical Background and Integration-Based Methods
 Large Vector Field Visualization: Theory and Practice Part I: Theoretical Background and Integration-Based Methods Christoph Garth Overview Foundations Time-Varying Vector Fields Numerical Integration
A Hybrid Physical/Device-Space Approach for Spatio-Temporally Coherent Interactive Texture Advection on Curved Surfaces
 A Hybrid Physical/Device-Space Approach for Spatio-Temporally Coherent Interactive Texture Advection on Curved Surfaces Daniel Weiskopf Thomas Ertl Institute of Visualization and Interactive Systems University
Using Integral Surfaces to Visualize CFD Data
 Using Integral Surfaces to Visualize CFD Data Tony Mcloughlin, Matthew Edmunds,, Mark W. Jones, Guoning Chen, Eugene Zhang 1 1 Overview Flow Visualization with Integral Surfaces: Introduction to flow visualization
FLOW VISUALIZATION TECHNIQUES FOR CFD USING VOLUME RENDERING
 9TH. INTERNATIONAL SYMPOSIUM ON FLOW VISUALIZATION, 2000 FLOW VISUALIZATION TECHNIQUES FOR CFD USING VOLUME RENDERING Roger A. Crawfis, The Ohio State University Han-Wei Shen, The Ohio State University
Volume Visualization
 Volume Visualization Part 1 (out of 3) Overview: Volume Visualization Introduction to volume visualization On volume data Surface vs. volume rendering Overview: Techniques Simple methods Slicing, cuberille
Flow Visualization Using Natural Textures. Technical Report
 Flow Visualization Using Natural Textures Technical Report Department of Computer Science and Engineering University of Minnesota 4-192 EECS Building 200 Union Street SE Minneapolis, MN 55455-0159 USA
A DISSERTATION SUBMITTED TO THE FACULTY OF THE GRADUATE SCHOOL OF THE UNIVERSITY OF MINNESOTA BY. Sheng-Wen Wang
 Effectively Identifying and Segmenting Individual Vortices in 3D Turbulent Flow A DISSERTATION SUBMITTED TO THE FACULTY OF THE GRADUATE SCHOOL OF THE UNIVERSITY OF MINNESOTA BY Sheng-Wen Wang IN PARTIAL
8. Tensor Field Visualization
 8. Tensor Field Visualization Tensor: extension of concept of scalar and vector Tensor data for a tensor of level k is given by t i1,i2,,ik (x 1,,x n ) Second-order tensor often represented by matrix Examples:
EFFECTIVE VISUALIZATION OF HEAT TRANSFER
 12TH INTERNATIONAL SYMPOSIUM ON FLOW VISUALIZATION September 10-14, 2006, German Aerospace Center (DLR), Göttingen, Germany EFFECTIVE VISUALIZATION OF HEAT TRANSFER Robert S. Laramee Department of Computer
Volume Visualization. Part 1 (out of 3) Volume Data. Where do the data come from? 3D Data Space How are volume data organized?
 Volume Data. Where do the data come from? 3D Data Space How are volume data organized?") Volume Data Volume Visualization Part 1 (out of 3) Where do the data come from? Medical Application Computed Tomographie (CT) Magnetic Resonance Imaging (MR) Materials testing Industrial-CT Simulation
Volume Data Volume Visualization Part 1 (out of 3) Where do the data come from? Medical Application Computed Tomographie (CT) Magnetic Resonance Imaging (MR) Materials testing Industrial-CT Simulation
Hardware-Accelerated Visualization of Time-Varying 2D and 3D Vector Fields by Texture Advection via Programmable Per-Pixel Operations
 Hardware-Accelerated Visualization of Time-Varying 2D and 3D Vector Fields by Texture Advection via Programmable Per-Pixel Operations Daniel Weiskopf Matthias Hopf Thomas Ertl University of Stuttgart,
Hardware-Accelerated Lagrangian-Eulerian Texture Advection for 2D Flow Visualization
 Hardware-Accelerated Lagrangian-Eulerian Texture Advection for 2D Flow Visualization Daniel Weiskopf 1 Gordon Erlebacher 2 Matthias Hopf 1 Thomas Ertl 1 1 Visualization and Interactive Systems Group, University
A Texture-Based Framework for Spacetime-Coherent Visualization of Time-Dependent Vector Fields
 A Texture-Based Framework for Spacetime-Coherent Visualization of Time-Dependent Vector Fields Daniel Weiskopf 1 Gordon Erlebacher 2 Thomas Ertl 1 1 Institute of Visualization and Interactive Systems,
Techniques for Visualizing Multi-Valued Flow Data
 Joint EUROGRAPHICS - IEEE TCVG Symposium on Visualization (2004) O. Deussen, C. Hansen, D.A. Keim, D. Saupe (Editors) Techniques for Visualizing Multi-Valued Flow Data Timothy Urness 1 Victoria Interrante
Directional Enhancement in Texture-based Vector Field Visualization
 Directional Enhancement in Texture-based Vector Field Visualization Francesca Taponecco GRIS Dept. Darmstadt University Timothy Urness Mathematics and Computer Science Dept. Drake University Victoria Interrante
Visualizing Vector Fields Using Line Integral Convolution and Dye Advection
 Visualizing Vector Fields Using Line Integral Convolution and Dye Advection Han-Wei Shent Christopher R. Johnsont Kwan-Liu Mat t Department of Computer Science $ ICASE University of Utah NASA Langley Research
ADVANCED FLOW VISUALIZATION
 ADVANCED FLOW VISUALIZATION DISSERTATION Presented in Partial Fulfillment of the Requirements for the Degree Doctor of Philosophy in the Graduate School of The Ohio State University By Liya Li, B.E., M.S.
Region of interest specification. with a region of interest (ROI) thus. substantially better results by applying. the input texture before LIC rather
 thus. substantially better results by applying. the input texture before LIC rather") Visualizing 3D Flow An elegant and versatile technique, line integral convolution (LIC) 1,2 represents directional information via patterns of correlation in a texture. Although most commonly used to depict
Visualizing 3D Flow An elegant and versatile technique, line integral convolution (LIC) 1,2 represents directional information via patterns of correlation in a texture. Although most commonly used to depict
GPUFLIC: Interactive and Accurate Dense Visualization of Unsteady Flows
 Eurographics/ IEEE-VGTC Symposium on Visualization (2006) Thomas Ertl, Ken Joy, and Beatriz Santos (Editors) GPUFLIC: Interactive and Accurate Dense Visualization of Unsteady Flows Guo-Shi Li 1 and Xavier
Imaging Vector Fields Using Line Integral Convolution
 Imaging Vector Fields Using Line Integral Convolution Brian Cabral Leith (Casey) Leedom* Lawrence Livermore National Laboratory ABSTRACT Imaging vector fields has applications in science, art, image processing
INTERACTIVE FOCUS+CONTEXT GLYPH AND STREAMLINE VECTOR VISUALIZATION
 INTERACTIVE FOCUS+CONTEXT GLYPH AND STREAMLINE VECTOR VISUALIZATION by Joshua Joseph Anghel A thesis submitted in partial fulfillment of the requirements for the degree of Master of Science in Computer
3D vector fields. Contents. Introduction 3D vector field topology Representation of particle lines. 3D LIC Combining different techniques
 3D vector fields Scientific Visualization (Part 9) PD Dr.-Ing. Peter Hastreiter Contents Introduction 3D vector field topology Representation of particle lines Path lines Ribbons Balls Tubes Stream tetrahedra
Multi-variate Visualization of 3D Turbulent Flow Data
 Multi-variate Visualization of 3D Turbulent Flow Data Sheng-Wen Wang a, Victoria Interrante a, Ellen Longmire b a University of Minnesota, 4-192 EE/CS Building, 200 Union St. SE, Minneapolis, MN b University
Scientific Visualization
 Scientific Visualization Dr. Ronald Peikert Summer 2007 Ronald Peikert SciVis 2007 - Introduction 1-1 Introduction to Scientific Visualization Ronald Peikert SciVis 2007 - Introduction 1-2 What is Scientific
AMCS / CS 247 Scientific Visualization Lecture 10: (GPU) Texture Mapping. Markus Hadwiger, KAUST
 Texture Mapping. Markus Hadwiger, KAUST") AMCS / CS 247 Scientific Visualization Lecture 10: (GPU) Texture Mapping Markus Hadwiger, KAUST Reading Assignment #5 (until Oct. 8) Read (required): Real-Time Volume Graphics, Chapter 2 (GPU Programming)
AMCS / CS 247 Scientific Visualization Lecture 10: (GPU) Texture Mapping Markus Hadwiger, KAUST Reading Assignment #5 (until Oct. 8) Read (required): Real-Time Volume Graphics, Chapter 2 (GPU Programming)
Stream Hulls: A 3D Visualization Technique for Chaotic Dynamical Systems
 Stream Hulls: A 3D Visualization Technique for Chaotic Dynamical Systems Kenny Gruchalla Elizabeth Bradley Department of Computer Science, University of Colorado at Boulder, Boulder, Colorado 80309 gruchall@cs.colorado.edu
Separation in three-dimensional steady flows. Part 2 : DETACHMENT AND ATTACHMENT SEPARATION LINES DETACHMENT AND ATTACHMENT SEPARATION SURFACES
 Separation in three-dimensional steady flows Part 2 : DETACHMENT AND ATTACHMENT SEPARATION LINES DETACHMENT AND ATTACHMENT SEPARATION SURFACES Separation lines or separatrices A separation line is a skin
Function Based 2D Flow Animation
 VISUAL 2000: MEXICO CITY SEPTEMBER 18-22 100 Function Based 2D Flow Animation Ergun Akleman, Sajan Skaria, Jeff S. Haberl Abstract This paper summarizes a function-based approach to create 2D flow animations.
Interactive Visualization of Divergence in Unsteady Flow by Level-Set Dye Advection
 Interactive Visualization of Divergence in Unsteady Flow by Level-Set Dye Advection Daniel Weiskopf Ralf Botchen Thomas Ertl Universität Stuttgart Abstract Dye advection is an intuitive and versatile technique
Multiscale Image Based Flow Visualization
 Multiscale Image Based Flow Visualization Alexandru Telea a and Robert Strzodka b a Department of Mathematics and Computer Science, Eindhoven University of Technology, Netherlands b Centre of Advanced
Visualization Computer Graphics I Lecture 20
 15-462 Computer Graphics I Lecture 20 Visualization Height Fields and Contours Scalar Fields Volume Rendering Vector Fields [Angel Ch. 12] November 20, 2003 Doug James Carnegie Mellon University http://www.cs.cmu.edu/~djames/15-462/fall03
Real-Time Techniques for 3D Flow Visualization
 Real-Time Techniques for 3D Flow Visualization Anton Fuhrmann and Eduard Gröller Institute of Computer Graphics, Vienna University of Technology æ Abstract Visualization of three dimensional flow has to
An Introduction to Flow Visualization (1) Christoph Garth
 Christoph Garth") An Introduction to Flow Visualization (1) Christoph Garth cgarth@ucdavis.edu Motivation What will I be talking about? Classical: Physical experiments to understand flow. 2 Motivation What will I be talking
An Introduction to Flow Visualization (1) Christoph Garth cgarth@ucdavis.edu Motivation What will I be talking about? Classical: Physical experiments to understand flow. 2 Motivation What will I be talking
Volume Illumination & Vector Field Visualisation
 Volume Illumination & Vector Field Visualisation Visualisation Lecture 11 Institute for Perception, Action & Behaviour School of Informatics Volume Illumination & Vector Vis. 1 Previously : Volume Rendering
Flow Web: A Graph Based User Interface for 3D Flow Field Exploration
 Flow Web: A Graph Based User Interface for 3D Flow Field Exploration Lijie Xu and Han-Wei Shen Ohio State University, 395 Dreese Laboratories 2015 Neil Avenue, Columbus Ohio, USA ABSTRACT While there have
Fast Visualization of Object Contours by Non-Photorealistic Volume Rendering
 Fast Visualization of Object Contours by Non-Photorealistic Volume Rendering Balázs Csébfalvi bfalvi,, Lukas Mroz, Helwig Hauser, Andreas König, Eduard Gröller Institute of Computer Graphics and Algorithms
Image-Guided Streamline Placement
 Image-Guided Streamline Placement Greg Turk, University of North Carolina at Chapel Hill David Banks, Mississippi State University Abstract Accurate control of streamline density is key to producing several
Image-Guided Streamline Placement Greg Turk, University of North Carolina at Chapel Hill David Banks, Mississippi State University
 Image-Guided Streamline Placement Greg Turk, University of North Carolina at Chapel Hill David Banks, Mississippi State University Abstract Accurate control of streamline density is key to producing several
11/1/13. Visualization. Scientific Visualization. Types of Data. Height Field. Contour Curves. Meshes
 CSCI 420 Computer Graphics Lecture 26 Visualization Height Fields and Contours Scalar Fields Volume Rendering Vector Fields [Angel Ch. 2.11] Jernej Barbic University of Southern California Scientific Visualization
Visualization. CSCI 420 Computer Graphics Lecture 26
 CSCI 420 Computer Graphics Lecture 26 Visualization Height Fields and Contours Scalar Fields Volume Rendering Vector Fields [Angel Ch. 11] Jernej Barbic University of Southern California 1 Scientific Visualization
 ! "$#% &'( )*,+- W.0/1325476/98:4:;
 A Crowdsourcing System for Integrated and Reproducible Evaluation in Scientific Visualization Appendix: Application Cases
 A Crowdsourcing System for Integrated and Reproducible Evaluation in Scientific Visualization Appendix: Application Cases Rickard Englund1 * 1 2 Sathish Kottravel1 Timo Ropinski2 Interactive Visualization
Feature-based adaptive texture visualization for vector field
 . RESEARCH PAPER. SCIENCE CHINA Information Sciences September 2013, Vol. 56 092115:1 092115:14 doi: 10.1007/s11432-011-4505-3 Feature-based adaptive texture visualization for vector field XU HuaXun, LI
Multi-dimensional Transfer Functions for Interactive 3D Flow Visualization
 Multi-dimensional Transfer Functions for Interactive 3D Flow Visualization Sung W. Park Brian Budge Lars Linsen Bernd Hamann Kenneth I. Joy Institute for Data Analysis and Visualization (IDAV) Department
Visualization of Turbulent Flow by Spot Noise
 Visualization of Turbulent Flow by Spot Noise Willem C. de Leeuw Frits H. Post Remko W. Vaatstra Delft University of Technology, Faculty of Technical Mathematics and Informatics, P.O.Box 356, 2600AJ Delft,
Distributed Visualization and Analysis of Fluid Dynamics Data
 Distributed Visualization and Analysis of Fluid Dynamics Data Hans-Christian HEGE, Tino WEINKAUF, Steffen PROHASKA, and Andrei HUTANU Zuse Institute Berlin, Scientific Visualization Group, Germany {hege,weinkauf,prohaska,hutanu}@zib.de,
Eyelet Particle Tracing Steady Visualization of Unsteady Flow
 Eyelet Particle Tracing Steady Visualization of Unsteady Flow Alexander Wiebel Gerik Scheuermann Image and Signal Processing Group Department of Computer Science University of Leipzig Figure 1: left: Path
Scientific Visualization
 Scientific Visualization Topics Motivation Color InfoVis vs. SciVis VisTrails Core Techniques Advanced Techniques 1 Check Assumptions: Why Visualize? Problem: How do you apprehend 100k tuples? when your
University of Groningen. 3D IBFV Telea, Alexandru; Wijk, Jarke J. van. Published in: EPRINTS-BOOK-TITLE
 University of Groningen 3D IBFV Telea, Alexandru; Wijk, Jarke J. van Published in: EPRINTS-BOOK-TITLE IMPORTANT NOTE: You are advised to consult the publisher's version (publisher's PDF) if you wish to
Fundamental Algorithms
 Fundamental Algorithms Fundamental Algorithms 3-1 Overview This chapter introduces some basic techniques for visualizing different types of scientific data sets. We will categorize visualization methods
Image Based Flow Visualization
 Image Based Flow Visualization Jarke J. van Wijk Technische Universiteit Eindhoven Dept. of Mathematics and Computer Science Abstract A new method for the visualization of two-dimensional fluid flow is
Point-based Stream Surfaces and Path Surfaces
 Point-based Stream Surfaces and Path Surfaces Tobias Schafhitzel Universität Stuttgart schafhitzel@vis.uni-stuttgart.de Eduardo Tejada Universität Stuttgart tejada@vis.uni-stuttgart.de Daniel Weiskopf
Edge Detection Lecture 03 Computer Vision
 Edge Detection Lecture 3 Computer Vision Suggested readings Chapter 5 Linda G. Shapiro and George Stockman, Computer Vision, Upper Saddle River, NJ, Prentice Hall,. Chapter David A. Forsyth and Jean Ponce,
IEEE TRANSACTIONS ON VISUALIZATION AND COMPUTER GRAPHICS, VOL. 13, NO. 3, MAY/JUNE Image-Based Streamline Generation and Rendering
 IEEE TRANSACTIONS ON VISUALIZATION AND COMPUTER GRAPHICS, VOL. 13, NO. 3, MAY/JUNE 2007 1 Image-Based Streamline Generation and Rendering Liya Li and Han-Wei Shen Abstract Seeding streamlines in 3D flow
SINCE the introduction of the Line Integral Convolution
 IEEE TRANSACTIONS ON VISUALIZATION AND COMPUTER GRAPHICS, VOL. 9, NO. 3, JULY-SEPTEMBER 2003 273 Dynamic Line Integral Convolution for Visualizing Streamline Evolution Andreas Sundquist Abstract The depiction
First Steps in Hardware Two-Level Volume Rendering
 First Steps in Hardware Two-Level Volume Rendering Markus Hadwiger, Helwig Hauser Abstract We describe first steps toward implementing two-level volume rendering (abbreviated as 2lVR) on consumer PC graphics
Texture Particles: Interactive Visualization of Volumetric Vector Fields
 Texture Particles: Interactive Visualization of Volumetric Vector Fields Stefan Guthe, Stefan Gumhold, Wolfgang Straßer WSI/GRIS University of Tübingen guthe@gris.uni-tuebingen.de ABSTRACT This paper introduces
Structure-accentuating Dense Flow Visualization
 Eurographics/ IEEE-VGTC Symposium on Visualization (2006) Thomas Ertl, Ken Joy, and Beatriz Santos (Editors) Structure-accentuating Dense Flow Visualization Sung W. Park 1 Hongfeng Yu 1 Ingrid Hotz 1 Oliver
Computational Strategies
 Computational Strategies How can the basic ingredients be combined: Image Order Ray casting (many options) Object Order (in world coordinate) splatting, texture mapping Combination (neither) Shear warp,