Chpt 2. Frequency Distributions and Graphs. 2-4 Pareto chart, time series graph, Pie chart / 35
|
|
|
- Timothy Snow
- 6 years ago
- Views:
Transcription

1 Chpt 2 Frequency Distributions and Graphs 2-4 Pareto chart, time series graph, Pie chart 1
2 Chpt Read pages p76 Applying the Concepts p77 1, 7, 9, 11, 13, 14, 15 Homework 2
3 Chpt 2 Objectives Represent data using Bar Graphs, Pareto Charts, Time Series Graphs, and Pie Graphs. 3
4 More Graphical Objective: Represent data using Pareto Representations Pareto Chart Time Series Graph Pie Chart (Pie Graph) Stem and Leaf Plot 4

5 Bar Graph A bar chart is very much like a histogram. A bar chart is strictly used with categorical data. With no continuity, there are gaps between the bars. The height of the bar represents the frequency of the class. 5
6 Pareto Chart Pareto charts - a Pareto chart is used to represent a frequency distribution for a categorical variable. Used with Categorical (Nominal) Data Bar chart with classes arranged in descending order of frequency (highest to lowest) Make the bars the same width. Make the units that are used for the frequency equal in size. 6


7 Pareto Chart 7
8 Time Series Graph A time series graph represents data that occur over a specific period of time. Frequency Polygon Horizontal axis = time (year, month, day, hour, etc.) Designed to show trends of data over time 8

9 Time Series Graph 9

10 Time Series Graph 10
11 Pie Graph (Pie Chart) A pie graph (pie chart) is a circle that is divided into sections or wedges representing the relative frequencies in each category of the distribution. Circle with wedges (slices) indicating portion representing class relative frequency. Shows proportions, highlights portion of whole population First appeared with line graph and bar chart in late 18 th century from William Playfair (Scotland) Made famous by Florence Nightingale during Crimean War. 11
12 Pie Graph (Pie Chart) To determine size of slice f = m α total 360 Relative frequency 360 = α (central angle of slice) Determine the appropriate central angle for each of the categories in the table. Yellow 2/23 32 Black 1/23 15 Color f Rel f Blue 9 9/23 Red 6 6/23 Green 5 5/23 Yellow 2 2/23 Black 1 1/23 9 = m α α Green 5/23 78 Red 6/23 94 Blue 9/
13 Stem and Leaf Plot A stem and leaf plot (stemplot) is a data plot that uses part of a data value as the stem and part of the data value as the leaf to form groups or classes. A stemplot has the advantage over grouped frequency distribution of retaining the actual data while also showing them in graphic form. Keeps the data List the data using part of the data (stem) as a class and the last single digit of the data value (leaf). To read the data value attach the leaf to the stem. 13
14 Stem and Leaf Plot 32, 18, 47, 65, 22, 33, 64, 44, 32, 15, 9, 16, 48, 77, 31, 25, 28, 55, 56, 12, 7, 10, 28, 22, 65, 47, 18, 32, 55, 15, è = Be sure to include a key for the stemplot 14


15 Stem and Leaf Plot 12.3, 6.2, 12.4, 9.8, 15.7, 7.4, 6.4, 7.7, 8.5, 10.5, 9.1, DO NOT FORGET to include = a key for the stemplot


16 Words of Caution Graphs represent data using pictures (worth a thousand words) but sometimes the words perceived by the reader may not be accurate. 16
17 Words of Caution Clever may lead to different perception Who eats more cantaloupe, men or women? Servings per Month The observer sees this in two dimensions, but only one dimension has relevance. Male Female Ensure the area of the display has the appropriate proportion. 17
18 Words of Caution Make certain the display is complete The graph should have a title explaining the subject. Horizontal & Vertical axes should be clearly labeled Missing labels show no information. Graphs should also include source reference 18
19 Huh? 19

20 Forest - Trees Who can make sense of this? 20
21 Maybe 21

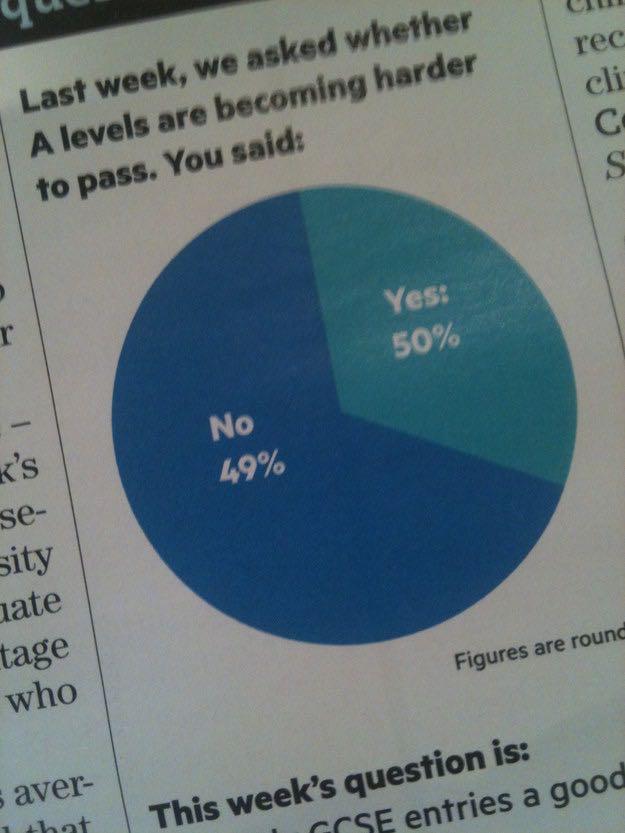
22 37 > > 50 22

23

24 Soared? 24
25 Magic Objective: Represent data using Pareto 25
26 This Just In hlp:// 26
 Key +,,, Keys Enter Key")
27 TI-84 Objective: Represent data using Pareto Window Key 2 nd TBLSET Y = Key 2 nd STAT PLOT 2nd Key MATH Key x 2 Key 2 nd On Key 2 nd OFF Trace Key 2 nd CALC Scrolling arrows 2 nd Screen contrast Stat Key 2 nd LIST VARS Key 2 nd DISTR ^ (Carat) Key +,,, Keys Enter Key 27
28 TI-84 BASIC INSTRUCTIONS First turn it on 2 nd ON will turn it off Let us put in your name PRGM NEW ENTER ALPHA YOURNAME ENTER 2 ND QUIT 28
29 TI-84 Return to home screen 2 ND QUIT Basic arithmetic operations (4+5) (4 5) ENTER 4 x 5 ENTER (4 5) 4 5 ENTER 4 2 OR 4 x 2 ENTER 4 ^ 2 ENTER 29
30 TI-84 More basic arithmetic operations (4 5 ) 4 ^ 5 ENTER 4 2 ND 4 ENTER ND ENTER ND ENTER If you prefer your answer in fraction form MATH 1:>Frac ENTER 30
31 TI-84 To create a list (6 preinstalled lists) STAT 1:EDIT Select List Enter first datum ENTER Repeat to end of list 2 ND QUIT To clear a list STAT 1:EDIT Select List To Heading CLEAR ENTER Or NOT DELETE STAT 4:ClrList 2 ND List Number ENTER 31
32 TI-84 Enter the data from your wingspans Stat 1:Edit Select List L1 Enter first value 20 Enter Enter 2nd value 30 Enter Repeat to end of list To draw a histogram of your data values (STAT PLOT) L1 2nd y= Enter ON TYPE: XList 2nd 1 Freq: 1 Zoom 9 32

33 Using the data from your m&m frequency distribution of the colors of the candies create a bar chart, and pie chart of the colors. Blue Brown Green Orange Red Yellow Repeat for Skittles. 33
Section 2-2 Frequency Distributions. Copyright 2010, 2007, 2004 Pearson Education, Inc
 Section 2-2 Frequency Distributions Copyright 2010, 2007, 2004 Pearson Education, Inc. 2.1-1 Frequency Distribution Frequency Distribution (or Frequency Table) It shows how a data set is partitioned among
2.1: Frequency Distributions
 2.1: Frequency Distributions Frequency Distribution: organization of data into groups called. A: Categorical Frequency Distribution used for and level qualitative data that can be put into categories.
Minitab Lab #1 Math 120 Nguyen 1 of 7
 Minitab Lab #1 Math 120 Nguyen 1 of 7 Objectives: 1) Retrieve a MiniTab file 2) Generate a list of random integers 3) Draw a bar chart, pie chart, histogram, boxplot, stem-and-leaf diagram 4) Calculate
This chapter will show how to organize data and then construct appropriate graphs to represent the data in a concise, easy-to-understand form.
 CHAPTER 2 Frequency Distributions and Graphs Objectives Organize data using frequency distributions. Represent data in frequency distributions graphically using histograms, frequency polygons, and ogives.
Chpt 1. Functions and Graphs. 1.1 Graphs and Graphing Utilities 1 /19
 Chpt 1 Functions and Graphs 1.1 Graphs and Graphing Utilities 1 /19 Chpt 1 Homework 1.1 14, 18, 22, 24, 28, 42, 46, 52, 54, 56, 78, 79, 80, 82 2 /19 Objectives Functions and Graphs Plot points in the rectangular
Basic Commands. Consider the data set: {15, 22, 32, 31, 52, 41, 11}
 Entering Data: Basic Commands Consider the data set: {15, 22, 32, 31, 52, 41, 11} Data is stored in Lists on the calculator. Locate and press the STAT button on the calculator. Choose EDIT. The calculator
2.1: Frequency Distributions and Their Graphs
 2.1: Frequency Distributions and Their Graphs Frequency Distribution - way to display data that has many entries - table that shows classes or intervals of data entries and the number of entries in each
Overview. Frequency Distributions. Chapter 2 Summarizing & Graphing Data. Descriptive Statistics. Inferential Statistics. Frequency Distribution
 Chapter 2 Summarizing & Graphing Data Slide 1 Overview Descriptive Statistics Slide 2 A) Overview B) Frequency Distributions C) Visualizing Data summarize or describe the important characteristics of a
Key Strokes To make a histogram or box-and-whisker plot: (Using canned program in TI)
") Key Strokes To make a histogram or box-and-whisker plot: (Using canned program in TI) 1. ing Data: To enter the variable, use the following keystrokes: Press STAT (directly underneath the DEL key) Leave
Key Strokes To make a histogram or box-and-whisker plot: (Using canned program in TI) 1. ing Data: To enter the variable, use the following keystrokes: Press STAT (directly underneath the DEL key) Leave
Select Cases. Select Cases GRAPHS. The Select Cases command excludes from further. selection criteria. Select Use filter variables
 Select Cases GRAPHS The Select Cases command excludes from further analysis all those cases that do not meet specified selection criteria. Select Cases For a subset of the datafile, use Select Cases. In
a. divided by the. 1) Always round!! a) Even if class width comes out to a, go up one.
 Always round!! a) Even if class width comes out to a, go up one.") Probability and Statistics Chapter 2 Notes I Section 2-1 A Steps to Constructing Frequency Distributions 1 Determine number of (may be given to you) a Should be between and classes 2 Find the Range a The
Probability and Statistics Chapter 2 Notes I Section 2-1 A Steps to Constructing Frequency Distributions 1 Determine number of (may be given to you) a Should be between and classes 2 Find the Range a The
CHAPTER 2. Objectives. Frequency Distributions and Graphs. Basic Vocabulary. Introduction. Organise data using frequency distributions.
 CHAPTER 2 Objectives Organise data using frequency distributions. Distributions and Graphs Represent data in frequency distributions graphically using histograms, frequency polygons, and ogives. Represent
Chapter 2 - Frequency Distributions and Graphs
 1. Which of the following does not need to be done when constructing a frequency distribution? A) select the number of classes desired B) find the range C) make the class width an even number D) use classes
Organizing and Summarizing Data
 Section 2.2 9 Organizing and Summarizing Data Section 2.2 C H A P T E R 2 4 Example 2 (pg. 72) A Histogram for Discrete Data To create a histogram, you have two choices: 1): enter all the individual data
Chapter 2. Descriptive Statistics: Organizing, Displaying and Summarizing Data
 Chapter 2 Descriptive Statistics: Organizing, Displaying and Summarizing Data Objectives Student should be able to Organize data Tabulate data into frequency/relative frequency tables Display data graphically
Chapter 2. Frequency Distributions and Graphs. Bluman, Chapter 2
 Chapter 2 Frequency Distributions and Graphs 1 Chapter 2 Overview Introduction 2-1 Organizing Data 2-2 Histograms, Frequency Polygons, and Ogives 2-3 Other Types of Graphs 2 Chapter 2 Objectives 1. Organize
Chapter 2: Descriptive Statistics (Part 1)
") Frequency 0 2 4 6 8 12 Chapter 2: Descriptive Statistics (Part 1) 2.1: Frequency Distributions and their Graphs Definition A frequency distribution is something (usually a table) that shows what values
Frequency 0 2 4 6 8 12 Chapter 2: Descriptive Statistics (Part 1) 2.1: Frequency Distributions and their Graphs Definition A frequency distribution is something (usually a table) that shows what values
Sharp EL-9900 Graphing Calculator
 Sharp EL-9900 Graphing Calculator Basic Keyboard Activities General Mathematics Algebra Programming Advanced Keyboard Activities Algebra Calculus Statistics Trigonometry Programming Sharp EL-9900 Graphing
8 Organizing and Displaying
 CHAPTER 8 Organizing and Displaying Data for Comparison Chapter Outline 8.1 BASIC GRAPH TYPES 8.2 DOUBLE LINE GRAPHS 8.3 TWO-SIDED STEM-AND-LEAF PLOTS 8.4 DOUBLE BAR GRAPHS 8.5 DOUBLE BOX-AND-WHISKER PLOTS
STP 226 ELEMENTARY STATISTICS NOTES
 ELEMENTARY STATISTICS NOTES PART 2 - DESCRIPTIVE STATISTICS CHAPTER 2 ORGANIZING DATA Descriptive Statistics - include methods for organizing and summarizing information clearly and effectively. - classify
Raw Data is data before it has been arranged in a useful manner or analyzed using statistical techniques.
 Section 2.1 - Introduction Graphs are commonly used to organize, summarize, and analyze collections of data. Using a graph to visually present a data set makes it easy to comprehend and to describe the
Chapter 1 Histograms, Scatterplots, and Graphs of Functions
 Chapter 1 Histograms, Scatterplots, and Graphs of Functions 1.1 Using Lists for Data Entry To enter data into the calculator you use the statistics menu. You can store data into lists labeled L1 through
MATH 117 Statistical Methods for Management I Chapter Two
 Jubail University College MATH 117 Statistical Methods for Management I Chapter Two There are a wide variety of ways to summarize, organize, and present data: I. Tables 1. Distribution Table (Categorical
STAT STATISTICAL METHODS. Statistics: The science of using data to make decisions and draw conclusions
 STAT 515 --- STATISTICAL METHODS Statistics: The science of using data to make decisions and draw conclusions Two branches: Descriptive Statistics: The collection and presentation (through graphical and
Section 1.2. Displaying Quantitative Data with Graphs. Mrs. Daniel AP Stats 8/22/2013. Dotplots. How to Make a Dotplot. Mrs. Daniel AP Statistics
 Section. Displaying Quantitative Data with Graphs Mrs. Daniel AP Statistics Section. Displaying Quantitative Data with Graphs After this section, you should be able to CONSTRUCT and INTERPRET dotplots,
CHAPTER 2: SAMPLING AND DATA
 CHAPTER 2: SAMPLING AND DATA This presentation is based on material and graphs from Open Stax and is copyrighted by Open Stax and Georgia Highlands College. OUTLINE 2.1 Stem-and-Leaf Graphs (Stemplots),
Frequency Distributions and Graphs
 //05 C H A P T E R T W O s and s and Outline CHAPTER - Organizing Data - Histograms, Polygons, and - Other Types of -4 Paired Data and Scatter Plots Learning Objectives Organize data using a frequency
B. Graphing Representation of Data
 B Graphing Representation of Data The second way of displaying data is by use of graphs Although such visual aids are even easier to read than tables, they often do not give the same detail It is essential
Lecture Slides. Elementary Statistics Twelfth Edition. by Mario F. Triola. and the Triola Statistics Series. Section 2.1- #
 Lecture Slides Elementary Statistics Twelfth Edition and the Triola Statistics Series by Mario F. Triola Chapter 2 Summarizing and Graphing Data 2-1 Review and Preview 2-2 Frequency Distributions 2-3 Histograms
2.1 Objectives. Math Chapter 2. Chapter 2. Variable. Categorical Variable EXPLORING DATA WITH GRAPHS AND NUMERICAL SUMMARIES
 EXPLORING DATA WITH GRAPHS AND NUMERICAL SUMMARIES Chapter 2 2.1 Objectives 2.1 What Are the Types of Data? www.managementscientist.org 1. Know the definitions of a. Variable b. Categorical versus quantitative
Graphics calculator instructions
 Graphics calculator instructions Contents: A B C D E F G Basic calculations Basic functions Secondary function and alpha keys Memory Lists Statistical graphs Working with functions 10 GRAPHICS CALCULATOR
Graphical Presentation for Statistical Data (Relevant to AAT Examination Paper 4: Business Economics and Financial Mathematics) Introduction
 Introduction") Graphical Presentation for Statistical Data (Relevant to AAT Examination Paper 4: Business Economics and Financial Mathematics) Y O Lam, SCOPE, City University of Hong Kong Introduction The most convenient
Graphical Presentation for Statistical Data (Relevant to AAT Examination Paper 4: Business Economics and Financial Mathematics) Y O Lam, SCOPE, City University of Hong Kong Introduction The most convenient
if you have anything on the screen you can clear it by pressing: CLEAR
 Graphing Calculators are really very powerful hand held computing devices. The allow mathematics problems to be investigated by those whose learning styles range from the symbolic to the visual to the
Name Date Types of Graphs and Creating Graphs Notes
 Name Date Types of Graphs and Creating Graphs Notes Graphs are helpful visual representations of data. Different graphs display data in different ways. Some graphs show individual data, but many do not.
2.4-Statistical Graphs
 2.4-Statistical Graphs Frequency Polygon: A frequency polygon uses line segments connected to points directly above class midpoint values. Example: Given the following frequency table for the pulse rate
MATH1635, Statistics (2)
") MATH1635, Statistics (2) Chapter 2 Histograms and Frequency Distributions I. A Histogram is a form of bar graph in which: A. The width of a bar is designated by an interval or ratio data value and thus
MATH1635, Statistics (2) Chapter 2 Histograms and Frequency Distributions I. A Histogram is a form of bar graph in which: A. The width of a bar is designated by an interval or ratio data value and thus
Graphics calculator instructions
 Graphics calculator instructions Contents: A Basic calculations B Basic functions C Secondary function and alpha keys D Memory E Lists F Statistical graphs G Working with functions H Two variable analysis
The basic arrangement of numeric data is called an ARRAY. Array is the derived data from fundamental data Example :- To store marks of 50 student
 Organizing data Learning Outcome 1. make an array 2. divide the array into class intervals 3. describe the characteristics of a table 4. construct a frequency distribution table 5. constructing a composite
TI-83 Graphing Functions & Relations
 To graph a function: 1. The equation must be written in functional notation in explicit (or y equals ) form. (Y is the dependent variable and X is the independent variable.) For instance, we may need to
Chapter 2: Graphical Summaries of Data 2.1 Graphical Summaries for Qualitative Data. Frequency: Frequency distribution:
 Chapter 2: Graphical Summaries of Data 2.1 Graphical Summaries for Qualitative Data Frequency: Frequency distribution: Example 2.1 The following are survey results from Fall 2014 Statistics class regarding
Lecture Slides. Elementary Statistics Tenth Edition. by Mario F. Triola. and the Triola Statistics Series. Slide 1
 Lecture Slides Elementary Statistics Tenth Edition and the Triola Statistics Series by Mario F. Triola Slide 1 Chapter 2 Summarizing and Graphing Data 2-1 Overview 2-2 Frequency Distributions 2-3 Histograms
RECALLING PREVIOUS EXPRESSIONS
 The variable Ans holds the most recent evaluated expression, and can be used in calculations by pressing SHIFT ( ). For example, suppose you evaluate 3 4, and then wish to subtract this from 17. This can
Getting Started with the TI-83/TI-84 Plus Family of Calculators
 Appendix C Getting Started with the TI-83/TI-84 Plus Family of Calculators ON-OFF To turn on the calculator, press the ON key. To turn off the calculator, press 2nd and then ON. Most keys on the calculator
Graphing Calculator Graphing with the TI-85
 Graphing Calculator Graphing with the TI-85 I. Introduction The TI-85 has fifty keys, many of which will perform multiple functions when used in combination. Each key has a symbol printed on its face.
Math 165 Guided Activity to study ahead some concepts from sections 1.1 and 1.2 Name Section Distance and Midpoint Formula
 Math 165 Guided Activity to study ahead some concepts from sections 1.1 and 1. Name Section 1.1 - Distance and Midpoint Formula Use the power point presentation for sections 1.1 and 1. to answer the following
Spell out your full name (first, middle and last)
") Spell out your full name (first, middle and last) Be ready to share the following counts: Number of letters in your full name. Number of vowels Number of consonants Section 2-1 Organizing Data After completing
Spell out your full name (first, middle and last) Be ready to share the following counts: Number of letters in your full name. Number of vowels Number of consonants Section 2-1 Organizing Data After completing
Raw Data. Statistics 1/8/2016. Relative Frequency Distribution. Frequency Distributions for Qualitative Data
 Statistics Raw Data Raw data is random and unranked data. Organizing Data Frequency distributions list all the categories and the numbers of elements that belong to each category Frequency Distributions
AND NUMERICAL SUMMARIES. Chapter 2
 EXPLORING DATA WITH GRAPHS AND NUMERICAL SUMMARIES Chapter 2 2.1 What Are the Types of Data? 2.1 Objectives www.managementscientist.org 1. Know the definitions of a. Variable b. Categorical versus quantitative
Bar Charts and Frequency Distributions
 Bar Charts and Frequency Distributions Use to display the distribution of categorical (nominal or ordinal) variables. For the continuous (numeric) variables, see the page Histograms, Descriptive Stats
Statistical Methods. Instructor: Lingsong Zhang. Any questions, ask me during the office hour, or me, I will answer promptly.
 Statistical Methods Instructor: Lingsong Zhang 1 Issues before Class Statistical Methods Lingsong Zhang Office: Math 544 Email: lingsong@purdue.edu Phone: 765-494-7913 Office Hour: Monday 1:00 pm - 2:00
At the end of the chapter, you will learn to: Present data in textual form. Construct different types of table and graphs
 DATA PRESENTATION At the end of the chapter, you will learn to: Present data in textual form Construct different types of table and graphs Identify the characteristics of a good table and graph Identify
Chapters 1.5 and 2.5 Statistics: Collecting and Displaying Data
 Chapters 1.5 and 2.5 Statistics: Collecting and Displaying Data Chapter Objectives: Decide which data is relevant, know methods to collect and organize data ; Design and use a data collection sheet or
Chapter 2 Organizing and Graphing Data. 2.1 Organizing and Graphing Qualitative Data
 Chapter 2 Organizing and Graphing Data 2.1 Organizing and Graphing Qualitative Data 2.2 Organizing and Graphing Quantitative Data 2.3 Stem-and-leaf Displays 2.4 Dotplots 2.1 Organizing and Graphing Qualitative
1.2. Pictorial and Tabular Methods in Descriptive Statistics
 1.2. Pictorial and Tabular Methods in Descriptive Statistics Section Objectives. 1. Stem-and-Leaf displays. 2. Dotplots. 3. Histogram. Types of histogram shapes. Common notation. Sample size n : the number
28 CHAPTER 2 Summarizing and Graphing Data
 8 CHAPTER Summarizing and Graphing Data. The two requested histograms are given below. They give very different visual images of the shape of the distribution. An outlier can have a significant effect
Math Tech IIII, Sep 14
 Math Tech IIII, Sep 14 Variations on the Frequency Histogram 2 Book Sections: 2.3 Essential Questions: What are the methods for displaying data, and how can I build them? What are variations of the frequency
Middle Years Data Analysis Display Methods
 Middle Years Data Analysis Display Methods Double Bar Graph A double bar graph is an extension of a single bar graph. Any bar graph involves categories and counts of the number of people or things (frequency)
SKILL: Fraction arithmetic and reducing fractions back to top
 Table of Contents 050 Skills 1) Fraction Arithmetic 2) Check Solution 3) Graphing and Ordered Pairs 4) Finding Intercepts From a Graph 5) Solve a System of Equations 6) Evaluate an Expression with Exponents
EXAMPLE. 1. Enter y = x 2 + 8x + 9.
 VI. FINDING INTERCEPTS OF GRAPHS As we have seen, TRACE allows us to find a specific point on the graph. Thus TRACE can be used to solve a number of important problems in algebra. For example, it can be
Unit 7 Statistics. AFM Mrs. Valentine. 7.1 Samples and Surveys
 Unit 7 Statistics AFM Mrs. Valentine 7.1 Samples and Surveys v Obj.: I will understand the different methods of sampling and studying data. I will be able to determine the type used in an example, and
12. A(n) is the number of times an item or number occurs in a data set.
 is the number of times an item or number occurs in a data set.") Chapter 15 Vocabulary Practice Match each definition to its corresponding term. a. data b. statistical question c. population d. sample e. data analysis f. parameter g. statistic h. survey i. experiment
Chapter 15 Vocabulary Practice Match each definition to its corresponding term. a. data b. statistical question c. population d. sample e. data analysis f. parameter g. statistic h. survey i. experiment
GRAPHING CALCULATOR REFERENCE BOOK
 John T. Baker Middle School GRAPHING CALCULATOR REFERENCE BOOK Name: Teacher: - 1 - To Graph an Equation: Graphing Linear Equations 1.) Press Y= and enter the equation into Y 1. 2.) To see the graph in
Chpt 3. Data Description. 3-2 Measures of Central Tendency /40
 Chpt 3 Data Description 3-2 Measures of Central Tendency 1 /40 Chpt 3 Homework 3-2 Read pages 96-109 p109 Applying the Concepts p110 1, 8, 11, 15, 27, 33 2 /40 Chpt 3 3.2 Objectives l Summarize data using
MATH 1070 Introductory Statistics Lecture notes Descriptive Statistics and Graphical Representation
 MATH 1070 Introductory Statistics Lecture notes Descriptive Statistics and Graphical Representation Objectives: 1. Learn the meaning of descriptive versus inferential statistics 2. Identify bar graphs,
Prob and Stats, Sep 4
 Prob and Stats, Sep 4 Variations on the Frequency Histogram Book Sections: N/A Essential Questions: What are the methods for displaying data, and how can I build them? What are variations of the frequency
Organizing and Summarizing Data
 1 Organizing and Summarizing Data Key Definitions Frequency Distribution: This lists each category of data and how often they occur. : The percent of observations within the one of the categories. This
Lesson 18-1 Lesson Lesson 18-1 Lesson Lesson 18-2 Lesson 18-2
 Topic 18 Set A Words survey data Topic 18 Set A Words Lesson 18-1 Lesson 18-1 sample line plot Lesson 18-1 Lesson 18-1 frequency table bar graph Lesson 18-2 Lesson 18-2 Instead of making 2-sided copies
Downloaded from
 UNIT 2 WHAT IS STATISTICS? Researchers deal with a large amount of data and have to draw dependable conclusions on the basis of data collected for the purpose. Statistics help the researchers in making
6 Using Technology Wisely
 6 Using Technology Wisely Concepts: Advantages and Disadvantages of Graphing Calculators How Do Calculators Sketch Graphs? When Do Calculators Produce Incorrect Graphs? The Greatest Integer Function Graphing
TMTH 3360 NOTES ON COMMON GRAPHS AND CHARTS
 To Describe Data, consider: Symmetry Skewness TMTH 3360 NOTES ON COMMON GRAPHS AND CHARTS Unimodal or bimodal or uniform Extreme values Range of Values and mid-range Most frequently occurring values In
Statistical Tables and Graphs
 Unit 5C Statistical Tables and Graphs Ms. Young Slide 5-1 Frequency Tables A basic frequency table has two columns: The first column lists the categories of data. The second column lists the frequency
Graphics Calculators
 Graphics Calculators Starting in ninth grade, you may use school provided calculators on exams. Today you will learn many of the features available on TI graphics calculators. Plain Vanilla The number
Table of Contents (As covered from textbook)
") Table of Contents (As covered from textbook) Ch 1 Data and Decisions Ch 2 Displaying and Describing Categorical Data Ch 3 Displaying and Describing Quantitative Data Ch 4 Correlation and Linear Regression
Table of Contents (As covered from textbook) Ch 1 Data and Decisions Ch 2 Displaying and Describing Categorical Data Ch 3 Displaying and Describing Quantitative Data Ch 4 Correlation and Linear Regression
Statistics 1 - Basic Commands. Basic Commands. Consider the data set: {15, 22, 32, 31, 52, 41, 11}
 Statistics 1 - Basic Commands http://mathbits.com/mathbits/tisection/statistics1/basiccommands.htm Page 1 of 3 Entering Data: Basic Commands Consider the data set: {15, 22, 32, 31, 52, 41, 11} Data is
Written by Donna Hiestand-Tupper CCBC - Essex TI 83 TUTORIAL. Version 3.0 to accompany Elementary Statistics by Mario Triola, 9 th edition
 TI 83 TUTORIAL Version 3.0 to accompany Elementary Statistics by Mario Triola, 9 th edition Written by Donna Hiestand-Tupper CCBC - Essex 1 2 Math 153 - Introduction to Statistical Methods TI 83 (PLUS)
YEAR 7 MATHS SCHEMES OF WORK
 YEAR 7 MATHS SCHEMES OF WORK 2018-19 Autumn Term (September-December) SOW: We follow the STP Mathematics course in year 7, published by Oxford University Press. fanez@al-ashraf.gloucs.sch.uk Unit Topic
Tabular & Graphical Presentation of data
 Tabular & Graphical Presentation of data bjectives: To know how to make frequency distributions and its importance To know different terminology in frequency distribution table To learn different graphs/diagrams
Making Science Graphs and Interpreting Data
 Making Science Graphs and Interpreting Data Eye Opener: 5 mins What do you see? What do you think? Look up terms you don t know What do Graphs Tell You? A graph is a way of expressing a relationship between
Chapter 2 - Graphical Summaries of Data
 Chapter 2 - Graphical Summaries of Data Data recorded in the sequence in which they are collected and before they are processed or ranked are called raw data. Raw data is often difficult to make sense
Descriptive Statistics: Box Plot
 Connexions module: m16296 1 Descriptive Statistics: Box Plot Susan Dean Barbara Illowsky, Ph.D. This work is produced by The Connexions Project and licensed under the Creative Commons Attribution License
Chapter 2 Describing, Exploring, and Comparing Data
 Slide 1 Chapter 2 Describing, Exploring, and Comparing Data Slide 2 2-1 Overview 2-2 Frequency Distributions 2-3 Visualizing Data 2-4 Measures of Center 2-5 Measures of Variation 2-6 Measures of Relative
University of Florida CISE department Gator Engineering. Visualization
 Visualization Dr. Sanjay Ranka Professor Computer and Information Science and Engineering University of Florida What is visualization? Visualization is the process of converting data (information) in to
Graphing Calculator Workshop
 Graphing Calculator Workshop Marian K. Hukle, hukle@math.ku.edu; Amy Kim, akim@math.ku.edu; Chris Valle, cvalle@math.ku.edu POWER ON/OFF ON to turn on calculator. 2nd OFF to turn off calculator. SCREEN
Describing Data: Frequency Tables, Frequency Distributions, and Graphic Presentation
 Describing Data: Frequency Tables, Frequency Distributions, and Graphic Presentation Chapter 2 McGraw-Hill/Irwin Copyright 2010 by The McGraw-Hill Companies, Inc. All rights reserved. GOALS 1. Organize
STAT - Edit Scroll up the appropriate list to highlight the list name at the very top Press CLEAR, followed by the down arrow or ENTER
 Entering/Editing Data Use arrows to scroll to the appropriate list and position Enter or edit data, pressing ENTER after each (including the last) Deleting Data (One Value at a Time) Use arrows to scroll
Chapter 2: Descriptive Statistics
 Chapter 2: Descriptive Statistics Student Learning Outcomes By the end of this chapter, you should be able to: Display data graphically and interpret graphs: stemplots, histograms and boxplots. Recognize,
8. MINITAB COMMANDS WEEK-BY-WEEK
 8. MINITAB COMMANDS WEEK-BY-WEEK In this section of the Study Guide, we give brief information about the Minitab commands that are needed to apply the statistical methods in each week s study. They are
Chapter Two: Descriptive Methods 1/50
 Chapter Two: Descriptive Methods 1/50 2.1 Introduction 2/50 2.1 Introduction We previously said that descriptive statistics is made up of various techniques used to summarize the information contained
Brief Guide on Using SPSS 10.0
 Brief Guide on Using SPSS 10.0 (Use student data, 22 cases, studentp.dat in Dr. Chang s Data Directory Page) (Page address: http://www.cis.ysu.edu/~chang/stat/) I. Processing File and Data To open a new
Graphing Calculator Graphing with the TI-89
 Graphing Calculator Graphing with the TI-89 I. Introduction The TI-89 has fifty keys, many of which will perform multiple functions when used in combination. Each key has a symbol printed on its face.
Complete Assignment #1 listed below on WK #1 in packet. Textbook required!!!
 400Algebra 2H ASSIGNMENT SHEETrev14 CHAPTER 3: Linear Functions with Review of Chapter 1 and 2 (3-1 to 3-4 Highlights on reverse side) Directions: 1. Review classwork and read each section in textbook
+ Statistical Methods in
 + Statistical Methods in Practice STA/MTH 3379 + Dr. A. B. W. Manage Associate Professor of Statistics Department of Mathematics & Statistics Sam Houston State University Discovering Statistics 2nd Edition
Math 227 EXCEL / MEGASTAT Guide
 Math 227 EXCEL / MEGASTAT Guide Introduction Introduction: Ch2: Frequency Distributions and Graphs Construct Frequency Distributions and various types of graphs: Histograms, Polygons, Pie Charts, Stem-and-Leaf
Math 121 Project 4: Graphs
 Math 121 Project 4: Graphs Purpose: To review the types of graphs, and use MS Excel to create them from a dataset. Outline: You will be provided with several datasets and will use MS Excel to create graphs.
Aston Hall s A-Z of mathematical terms
 Aston Hall s A-Z of mathematical terms The following guide is a glossary of mathematical terms, covering the concepts children are taught in FS2, KS1 and KS2. This may be useful to clear up any homework
Graphing Calculator Overview
 Graphing Calculator Overview Workshop One Objectives Learn the general layout of the calculator Learn how to navigate the menus Learn basic operating procedures Perform linear regression LEARNING CENTER
download instant at Summarizing Data: Listing and Grouping
 Ch. 2 download instant at www.easysemester.com Summarizing Data: Listing and Grouping 2.1 Multiple Choice Questions MULTIPLE CHOICE. Choose the one alternative that best completes the statement or answers
Chapter 1 Section 3. Page 22. A graph is a visual display of information or data. There are three types of graphs.
 Chapter 1 Section 3 Page 22 A graph is a visual display of information or data. There are three types of graphs. Graphs are pictures that help us understand amounts. These amounts are called data. There
Basic Calculator Functions
 Algebra I Common Graphing Calculator Directions Name Date Throughout our course, we have used the graphing calculator to help us graph functions and perform a variety of calculations. The graphing calculator
Chapter 2 Exploring Data with Graphs and Numerical Summaries
 Chapter 2 Exploring Data with Graphs and Numerical Summaries Constructing a Histogram on the TI-83 Suppose we have a small class with the following scores on a quiz: 4.5, 5, 5, 6, 6, 7, 8, 8, 8, 8, 9,