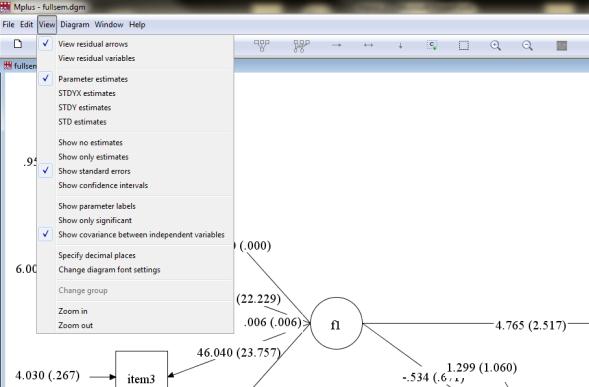
About Me. Mplus: A Tutorial. Today. Contacting Me. Today. Today. Hands-on training. Intermediate functions
|
|
|
- Alexis Carson
- 5 years ago
- Views:
Transcription
 2-year postdoc from NIAAA Two great loves: Alcohol research Complex data modeling 1 2 Contacting Me Handouts for this workshop series (and others) https://sites.")
1 About Me Mplus: A Tutorial Abby L. Braitman, Ph.D. Old Dominion University November 7, 2014 NOTE: Multigroup Analysis code was updated May 3, 2016 B.A. from UMD Briefly at NYU Ph.D. from ODU in 2012 (AE) 2-year postdoc from NIAAA Two great loves: Alcohol research Complex data modeling 1 2 Contacting Me Handouts for this workshop series (and others) /handouts abraitma@odu.edu MGB 132-B 3 Today Introduction to Mplus and basic functions Intro: Exporting data from SPSS Code terminology Reading output Basics: Path analyses Latent variable modeling Full SEM Indirect effects (mediation) Bootstrapping Troubleshooting 4 Today Today Intermediate functions Latent growth modeling Fixing and freeing paths Non-continuous outcomes Multilevel modeling Other forms of estimation Adding and relaxing equality constraints LPA/LCA Hands-on training Sample dataset and suggested activities and models Walk through an example together I will give immediate hands-on training for those who are able to bring the software on their laptop I will also provide ad hoc hands-on training for those who want help as they explore the software in their labs and offices for up to one week after the workshop ends 5 6 1


 Mixture modeling (latent profiles, latent classes, growth")


 The Users Guide (in")

2 Why Mplus? Wide choice of data estimators and algorithms It excels at handling categorical, nominal, binary, censored, and continuous non-normal data Several output options Beyond traditional SEM: Multilevel modeling (longitudinal and cross-sectional, up to three levels of nesting) Mixture modeling (latent profiles, latent classes, growth mixture) Simulation analyses (Monte Carlo) Error messages are somewhat helpful (model is not identified versus need more iterations to reach convergence) Support: manual, website, Muthéns themselves New: Pictures! Helpful for double-checking yourself, and sharing with others What You Need The editor (a big, grey expanse) The Users Guide (in Program Files by default) Data 7 8 Exporting Your Data Exporting Your Data Must be numeric NAMES must be 8 characters y1-y4 X1-x Exporting Your Data Make sure it s the right encoding Exporting Your Data Make sure you do not export the variable NAMES
 5, 7, 8, 999, 32 becomes 5, 7, 8, [missing], 32 You must tell Mplus what your")

![16 Getting Started Title: Optional, but helpful Data: Required Exported from SPSS Variable: Required NAMES ARE [your variable names]; Lists ALL variables in the dataset USEVARIABLES ARE: Required if](/docs-images/87/97059988/images/3-2.jpg "you re using only some of the variables in the dataset for your model MISSING IS all (999); Saying 999 is the missing data indicator, and that s true for all variables Model: How you specify what")
3 Data File Exporting Missing Data 13 Missing data cannot be blank 5, 7, 8, [.], 32 becomes 5, 7, 8, 32 X1 X2 X3 Drinks You need some sort of indicator (that is not a plausible value) 5, 7, 8, 999, 32 becomes 5, 7, 8, [missing], 32 You must tell Mplus what your indicator is The language gets longer if you use different indicators for different variables, but it is possible 14 Exporting Your Data Getting Started You may want to copy-paste your variable names from SPSS into Mplus when it s time to enter them If you accidentally omit one typing by hand, data will be mis-matched This is the time to shorten them if you haven t already: PROBLEMSt2 PROBSt Getting Started Title: Optional, but helpful Data: Required Exported from SPSS Variable: Required NAMES ARE [your variable names]; Lists ALL variables in the dataset USEVARIABLES ARE: Required if you re using only some of the variables in the dataset for your model MISSING IS all (999); Saying 999 is the missing data indicator, and that s true for all variables Model: How you specify what analysis you want 17 y ON x1 x2 x3 (regression) x1 WITH x2 (correlation) Basic Model Language f BY item1 item2 item3 item4 item5 (factors or latent variables) X1 X2 y f X1 X2 X3 i1 i2 i3 i4 18i5 3
 Every statement must end with it. Exclamation Points are how you make notes to yourself (or inactivate code).")

4 Semi-Colons and Exclamation Points Semi-Colons and Exclamation Points Today s Uses of a Semicolon Semi-colons are how you complete a command/item in mplus. faces ;) Every statement must end with it. Exclamation Points are how you make notes to yourself (or inactivate code). To separate sentences To make winky Double-Checking Double-Checking Make sure your data were read correctly by asking for descriptives Match with your descriptives from SPSS Analysis: TYPE = BASIC; Double-Checking Path Analysis Series of regressions: but DV s can now also be IV s! Great for testing models/theories PICTURE and CODE and OUTPUT
 B, SE, t, p Can easily request additional information stand = standardized")
5 Path Analysis: Health Belief Model Path Analysis Suscep CostBenR Perceived Susceptibility Perceived Severity Perceived Benefits and Barriers Perceived Threat Cues to Action Likelihood of Taking Action Severity PThreat Cues2Act Intent Output Reading Your Output Defaults: Fit statistics (not always relevant) B, SE, t, p Can easily request additional information stand = standardized values (e.g., βs) CINT = confidence intervals Gives 99%, 95%, 90%, Reading Your Output Reading Your Output B SE t p

6 Reading Your Output Reading Your Output Indirect Effects Indirect Effects Perceived Threat Also called mediation Neuroticism Self- Efficacy Intent c = total effect c' = direct effect ab = indirect effect 33 MODEL INDIRECT: y IND mediator x 34 Indirect Effects Perceived Threat Bootstrapping Neuroticism Self- Efficacy Intent Bootstrapping example with means: Original sample 1 sample 2 sample 3 sample 1000 μ's: Notice that some values are repeated in the samples because they were sampled with replacement

 37 38 Bootstrapping No longer requires normally distributed variables (or coefficients) Create our own (normal) sampling distribution Assess significance using 95% CI (no 0 ~ p <.")
7 Applied to mediation: Bootstrapping sample 1 sample 2 sample 3 sample 4 Each parameter estimate gets a set of possible values (in this case, 1000 of them) Bootstrapping Final estimate = midpoint of ordered estimates Significance assessed with middle 95% of ordered estimates a 1.031, b 0.762, ab Indirect effect = (95% CI: 0.719,0.829) Bootstrapping No longer requires normally distributed variables (or coefficients) Create our own (normal) sampling distribution Assess significance using 95% CI (no 0 ~ p <.05) Latent Variable Modeling (CFAs) Crux of SEM (1 minute review) Assumes underlying, unobserved, latent construct is driving observed items Different from composite scores Allows for Measurement Error Allows for best combination weighting of items Latent Variable Modeling (CFAs) Latent Variable Modeling (CFAs) Latent Factor item1 item2 item3 item4 item5 e1 e2 e3 e4 e5 Default is to set first item loading to 1 (to scale factor) Alternative is to set variance of factor to


8 Latent Variable Modeling (CFAs) Latent Factor item1 item2 item3 item4 item5 e1 e2 e3 e4 e5 Full SEM Models Combining CFAs with Path Analyses gen1 gen2 gen3 gen4 gen5 F1 Typical Drinking F2 Age Marry target1 target2 target3 target4 target Full SEM Models Code (old and new) Full SEM Models Paths Factor Loadings Full SEM Models Full SEM Models Factor Loadings Main Paths Covariate Paths


9

10


11
")

12 67 68 Troubleshooting The Software The manual The website The software itself Using the Manual Lots of examples (hundreds) Start with their code and alter to fit your data/model Using the Manual Examples include code, pictures, and written explanation


13 Using the Manual Using the Website Explain defaults when relevant Setting factor metric Correlating factors Correlating exogenous variables Using the Website Using the Website Individual Troubleshooting! BREAK Section 2 Advanced model language Latent Growth Models Non-continuous outcomes Multi-group analyses Fixing and freeing paths Adding and relaxing equality constraints Latent Profile/Class Analysis Multilevel Modeling

; DepSum = SUM (dep1 dep2 dep3 dep4 dep5); IF-THEN NewVariable transformation statements; IF (gender EQ 1")
14 y ON x1 x2 x3 (regression) x1 WITH x2 (correlation) Basic Model Language f BY item1 item2 item3 item4 item5 (factors or latent variables) X1 X2 y f X1 X2 X3 i1 i2 i3 i4 79i5 Symbol CODE CODE Mathematical Operators Definition Definition EQ Equal == NE Not Equal /= GE Greater than or Equal to >= LE Less than or Equal to <= GT Greater Than > LT Less Than < Example + Addition y + x; - Subtraction y x; * Multiplication y * x; / Division y / x; ** Exponentiation y**2; Alternate Symbol CODE CODE AND OR NOT Definition logical and logical or logical not 80 Advanced Model Language: DEFINE DEFINE NewVariable = mathematical expression; Depress = MEAN (dep1 dep2 dep3 dep4 dep5); DepSum = SUM (dep1 dep2 dep3 dep4 dep5); IF-THEN NewVariable transformation statements; IF (gender EQ 1 AND ses EQ 1) THEN group = 1; IF (gender EQ 1 AND ses EQ 2) THEN group = 2; IF (gender EQ 2 AND ses EQ 1) THEN group = 3; IF (gender EQ 2 AND ses EQ 2) THEN group = 4; CUT variable or list of variables (cutpoints); CUT y1 (30 40); 0 = less than or equal to 30, 1 = greater than 30 and less than or equal to 40 2 = greater than 40 _MISSING IF (y EQ 0) THEN newvar = _MISSING; IF (y = _MISSING) THEN newvar = 0; Decided to create composite instead of CFA Continuous into ordered groups; Variable keeps same name; Cutpoint is included is lower group; Changing a value to MISSING, or MISSING to a value Advanced Model Language USEOBS or USEOBSERVATIONS conditional statement to select observations USEOBS ARE gender EQ 1 USEOBS ARE x3 NE 1 USEOBS ARE age GE 18 Running the model with just males Use everyone EXCEPT group 1 Excluding those who are underage Combine with DEFINE DEFINE: IF (drinks LT 5 AND probs EQ Identifying low to moderate drinkers 0) THEN group = 1; (< 5 drinks, no problems) USEOBS ARE group NE 1; Use everyone EXCEPT them Language Matters Advanced Model Language 83 Constraints * frees a parameter, or denotes a specific starting value - The variance of y1 will be freely estimated, starting example: y1*.5; with examining the likelihood that it is fixes a parameter at a a specific value example: y1@0; - The variance of y1 is constrained or set to 0 (number) constrains parameters to be equal example: f1 ON x1 (1); f2 ON x1 (1); The influence of x1 predicting f1 is the same as the influence of x1 predicting f
![Advanced Model Language Latent Growth Models [intercept] versus not list of variables without brackets refers to variances and residual variances example: f1 y1-y9; f1@0; - The variance of f1 is set](/docs-images/87/97059988/images/15-0.jpg "to 0 [list of variables] refers to means, intercepts, thresholds example: [f1, y1-y9]; [f1]@0; - The mean of f1 is set to 0 Var. if exogenous; resid. var. if endogenous Mean if exogenous; intcpt if endogenous Time 1 Score Intercept 1 1 1 1 Time 2 Score Linear Slope 0 1 2 Time 3 Score Quad.")
15 Advanced Model Language Latent Growth Models [intercept] versus not list of variables without brackets refers to variances and residual variances example: f1 y1-y9; - The variance of f1 is set to 0 [list of variables] refers to means, intercepts, thresholds example: [f1, y1-y9]; [f1]@0; - The mean of f1 is set to 0 Var. if exogenous; resid. var. if endogenous Mean if exogenous; intcpt if endogenous Time 1 Score Intercept Time 2 Score Linear Slope Time 3 Score Quad. Slope Time 4 Score OPTIONAL Latent Growth Models Can specify with long code: Int BY time1@1; Int BY time2@1; Int BY time2@1; Int BY time2@1; Slope BY time1@0; Slope BY time2@1; Slope BY time3@2; Slope BY time4@3; Int WITH Slope; [time1 time2 time3 time4]@0; Or use Mplus shortcut Int and Slope are names I created. - Not already in the data. - Mplus does not require any specific name. time1-time4 are variable names Intercept slope time1@0 time2@1 time3@2 time4@3; Assumes intercept is 1 s all around Creates paths you specify for slope Allows intercept and slope to correlate Sets variable intercepts to 0 so that all prediction is in the mean of the latent variables (Intercept and Slope) Intercept and slope are still labels I created. Can be whatever you want. 87 Latent Growth Models I shortened intercept and slope to i and s ; they can be whatever name you want time1-time4 are labeled y11-y14 (studying adolescents) 88 Loadings we specified. Latent Growth Models All 1 s for intercept. 0,1,2,3 for linear growth slope. Intercept Linear Slope Quad. Slope Focus of analysis. What is initial value for construct? What is growth? Set to zero so that prediction is all captured in the means Time 1 Score Time 2 Score Time 3 Score Time 4 Score
 Latent Growth Models Intercept Linear Slope - Not in dataset. Create in DEFINE.")

16 Latent Growth Models Latent Growth Models Added q for the quadratic term Assigned loadings for linear term Mplus knows to square loadings for q Q loadings are squared S loadings Construct starts at Grows each year/week/etc. Quadratic growth term was not sig Latent Growth Models x1 x2 mod (x1*x2) Latent Growth Models Intercept Linear Slope - Not in dataset. Create in DEFINE. - LGM language ON statements (path analyses) Time 1 Score Time 2 Score Time 3 Score Time 4 Score Combining LGM language with ON statements Time-invariant predictors for i and s Time-varying predictors for individual timepoints a1 a2 a3 a Multigroup Analyses Males: x1 x2 x3 f1 f2 - Predictors influence on baseline values y1 y2 y3 y4 y5 y6 - Predictors influence on growth slopes Females: x1 x2 x3 f1 f2 - Controlling for timespecific covariates (or main predictors) 95 y1 y2 y3 y4 y5 y
17 Multigroup Analysis Code Approach changed in newer versions Version 6 and older The MODEL describes the overall model to be estimated for each group Default is that ALL code under the MODEL command was constrained to equality across groups unless an exception was made Exceptions were specified using MODEL [group] command after the overall command Version 7 and newer The MODEL describes the overall model to be estimated for each group Default is for measurement to be constrained, but structure to be different Factor loadings are held equal across groups Intercepts (for continuous variables) and thresholds (for categorical variables) are held equal across groups Paths such as ON and WITH are estimated separately for each group Exceptions were specified using MODEL [group] command after the overall command 97 Multigroup Analyses: Version 6 and older How you indicate you are doing a multigroup analysis: Specifying grouping variable AND group labels Second set of model code allows estimates to be different from original model Inactivated CFA code because construct needs to be consistently measured across groups 98 Multigroup Analyses: Version 7 and newer Males: Multigroup Analyses x1 x2 x3 f1 f2 a b c d e f How you indicate you are doing a multigroup analysis: Specifying grouping variable AND group labels Second set of model code allows estimates to be different from original model Inactivated CFA code because construct needs to be consistently measured across groups Inactivated path code because new default for v7+ is to allow these to vary across groups 99 Females: y1 y2 y3 y4 y5 y6 x1 x2 x3 f1 f2 a b c d e f y1 y2 y3 y4 y5 y6 100 Multigroup Analyses Multigroup Analyses Factor loadings (identical) Factor loadings Predictive paths Predictive paths (unique)
 103 χ 2 (6) = 567.696, p <.")
18 Testing Measurement Invariance Testing Measurement Invariance Constrained Model Unconstrained Model Activated CFA code for females Run with factor loadings free, and constrained Compare model fit Can conduct likelihood ratio test (nested models) 103 χ 2 (6) = , p <.001 Significant Misfit 104 Males: Testing to see if paths (structural models) are consistent across groups Females: Multigroup Analyses Cont d a f1 y1 y2 y3 a f1 b b y1 y2 y3 x1 x2 x3 c d x1 x2 x3 c f2 e y4 y5 y6 d f2 e y4 y5 y6 f f constrained loadings constrained loadings 105 Multigroup Analyses Cont d: Version 6 and older Equality Constraints Making each path consistent across groups Paths with the same (#) are constrained to equality with one another Not technically necessary under MODEL female because default is to keep everything the same unless otherwise specified Does not hurt to include them to be sure software is doing exactly what you want. 106 Multigroup Analyses Cont d: Version 7 and newer Multigroup Analyses Cont d Equality Constraints Making each path consistent across groups Paths with the same (#) are constrained to equality with one another Are definitely necessary under MODEL female because default in V7+ is to allow ON paths to be estimated separately for each group unless otherwise specified. This code specifies that they should be the same across groups. 107 Factor loadings equal (like before) Predictive/structural paths
: names of binary and ordered categorical (ordinal) variables; NOMINAL ARE (or IS): names of")
 EXAMPLE: Marital status = 6 groups (unordered) f1 f2 age marry DrinkTyp 111 112 Noncontinuous Variables CAN run analyses with")
19 Multigroup Analyses Cont d Multigroup Analyses Cont d Constrained Model Unconstrained Model Factor loadings equal (like before) Predictive/structural paths now ALSO equal 109 χ 2 (7) = , p =.001 Significant Misfit 110 Noncontinuous Variables Noncontinuous Variables CATEGORICAL ARE (or IS): names of binary and ordered categorical (ordinal) variables; NOMINAL ARE (or IS): names of unordered categorical (nominal) variables; COUNT ARE (or IS): names of count variables; Poisson distribution models Zero-Inflated Poisson (ZIP) models Still must follow rules of SEM (and regression) No nominal predictors Need to dummy code into relevant groups (0,1) EXAMPLE: Marital status = 6 groups (unordered) f1 f2 age marry DrinkTyp Noncontinuous Variables CAN run analyses with categorical outcomes Somewhat equivalent to logistic regressions Noncontinuous Variables Traditional structural paths f1 f2 age DrinkTyp marry 113 Logistic structural paths For k classes, has k-1 estimates: Reflect probability of being in current class versus final class, given x Default is to use final class for comparison purposes (may want to recode prior to analysis)
 Traditional")


20 Noncontinuous Variables Poisson (count) variables Processing Noncontinuous Variables Noncontinuous Variables Zero-Inflated Poisson (ZIP models) Traditional coefficients (adjusted) Noncontinuous Variables Traditional coefficients Additional logit coefficients If they are a drinker, how does age/f1/f2 impact how much they drink? How does age/f1/f2 impact the probability of being a drinker (a 119 non-zero)? Noncontinuous Variables One exception to rule: LATENT VARIABLES may be nominal predictors Most common version of this
 Longitudinal version is often called Growth Mixture Modeling (chapter 8) Only covering cross-section data today (LPA/LCA), but same principles apply to")
.")
21 Latent Profile/Class Analysis LPA x1 x2 x1 x2 C y1 y2 y3 y4 y5 c is a latent CLASS variable (unordered categories) LCA C u1 u2 u3 u4 u5 Latent Profile/Class Analysis Mplus calls this mixture modeling with crosssectional data (chapter 7) Longitudinal version is often called Growth Mixture Modeling (chapter 8) Only covering cross-section data today (LPA/LCA), but same principles apply to longitudinal data (GMM) y1-y5 = continuous indicators u1-u5 = categorical indicators Latent Profile/Class Analysis Zimbardo s Time Perspective (5 Facets) Latent Profile/Class Analysis C How many classes in c? Run separate models where c = 1, 2, 3, 4, 5, etc. and compare model fit C does not exist in the data. Creating it (like any other latent factor). (3) indicates we believe there are three groups/profiles. Default type is GENERAL, so need to include code to change it to MIXTURE Number of initial starts and final stage optimizations. Default of 10, 2 is often not enough. Past Positive Past Negative Present Hedonistic Present Fatalistic Future Allows you to save the probabilities of being in each class for each participant. Helpful if you plan on predicting classes from covariates, or using class to predict outcomes. Not necessary YET. 123 Tech11 output includes Lo-Mendell-Rubin Adjusted LRT (compares fit for current number of classes to one fewer) 124 Latent Profile/Class Analysis Warning! Latent Profile/Class Analysis Fit (abbreviated list) Already took care of this with STARTS 20 5; Should say HELPFUL TIP: When estimating
 Classes: AIC BIC Adjusted")

22 Latent Profile/Class Analysis Relative Entropy and class counts/proportions Latent Profile/Class Analysis Lo-Mendell-Rubin adjusted LRT 7.3% of sample in class Latent Profile/Class Analysis Compare model fit across number of classes Latent Profile/Class Analysis Class Means (for final set of classes) Classes: AIC BIC Adjusted BIC Relative Entropy LMR p Proportion of smallest group Groups with ptn < Class 1 Class 2 Class 3 Past Positive Past Negative Present Hedonistic Present Fatalistic Future Separate Analyses: CLASSES = c(1), CLASSES = c(2), CLASSES = c(3), CLASSES = c(4), CLASSES = c(5), CLASSES = c(6), CLASSES = c(7) Latent Profile/Class Analysis Zimbardo s Time Perspective (5 Facets) Gender No nominal predictors, so Dummy Code! Latent Profile/Class Analysis Model with classes predicting drinking C Alcohol Use Gender Class1 Past Positive Past Negative Present Hedon. Present Fatalistic Future Class3 Alcohol Use Copy-pasted classifications from cprob.dat into my original dataset Exported into LPAwithclasses.dat class = nominal variable (1, 2, 3) class1 and class3 are dummy coded (0,1) with second class as category of reference (largest class)
 133 Remember, CATEGORICAL means binary or ordinal.")


23 Latent Profile/Class Analysis Prediction results Latent Profile/Class Analysis Dummy coding: B = average number of drinks increase/decrease compared to class 2 C Remember, dummy coding is one of the cases where we only want to standardize Y, because now β represents the standardized increase for one class versus another (x=0 versus x=1) 133 Remember, CATEGORICAL means binary or ordinal. If you have unordered 3+ categories, you need to use NOMINAL. u1 u2 u3 u4 134 Latent Profile/Class Analysis Latent Profile/Class Analysis Model Fit Probability of membership for each indicator by class u1 u2 u3 u4 Class 1 no no yes yes Class 2 yes yes no no Entropy and proportions Lo-Mendell-Rubin adjusted LRT available, but omitted for space Member 1 Member 2 Multilevel Modeling Leader Member 3 Person Member 4 What do you do when one picture/model does not represent all of your data? Not just some missing datapoints, but total mismatch. Member 5 Member B1 LeaderB Member B2 PersonB Member B3 Multilevel Modeling ABANDON SEM! Latent variables/structures are not appropriate Different number of units within cluster, different spacing of time, etc. Conduct Multilevel Modeling (MLM), Hierarchical Linear Modeling (HLM), nested models, mixed models, random effects models, random coefficient models, etc. Day 1 Day5 Day6 Day 11 Day 14 Day8 Day 3 Day4 Day

24 Multilevel Modeling Other than LGMs (with matching timepoints), multilevel modeling is impossible in most SEM software packages Can use HLM (software by SSI) Limited functionality beyond HLM No bootstrapping No path analyses where outcomes are also predictors (e.g., mediation) Can use SAS, MIXOR, MLWIN, VARCL, BUGS, or R, but need to learn another language 139 Level 1: Multilevel Modeling Drinks ti = π 0i + π 1i (Bar ti ) + π 2i (Rest ti )+ π 3i (Party ti )+ π 4i (Other ti )+π 5i (PBS ti )+e ti Level 2: π 0i = β 00 + β 01 Gender i + r 0i π 1i = β 10, π 2i = β 20, π 3i = β 30, π 4i = β 40, π 5i = β 50 Level 1: Drinks for person i at time t depends on: their personal intercept, plus where they drank that day (dummy coded across 4 variables), plus their PBS that day, plus random error Level 2: A person s personal intercept depends on: their gender. The effect of location does not vary by gender. The influence of PBS does not vary by gender. 140 Multilevel Modeling in Mplus TYPE = TWOLEVEL RANDOM %WITHIN% drinks ON Home Bar Rest Party Other PBS; %BETWEEN% drinks ON gendd; TYPE = COMPLEX Level 1: Regress drinks on level-1 predictors (location and PBS). Drinks for person i at time t depends on: where they drank that day and plus their PBS that day. Personal intercept (π 0i ) and random error (e ti ) are included as default. Level 2: Regress drinks on level-2 predictor (gender). Personal intercept is influenced by gender. Drinks ON Home Bar Rest Party Other pbsdo; Drinks ON gendd; Same interpretation as above. 141 Multilevel Modeling in Mplus Code relevant to both: TYPE=COMPLEX & TYPE=TWOLEVEL RANDOM CLUSTER = name of grouping variable; CENTERING IS GRANDMEAN (variable names); GROUPMEAN (variable names); TYPE = TWOLEVEL RANDOM code only WITHIN ARE names of level-1 observed variables; BETWEEN ARE names of level-2 observed variables; 142 Multilevel Modeling: TWOLEVEL RANDOM Multilevel Modeling: TWOLEVEL RANDOM Note drinks is not under WITHIN or BETWEEN. Outcome does not need to be specified by level


 X1 X2 y f X1 X2 X3 i1 i2 i3 i4")
25 Multilevel Modeling: COMPLEX Multilevel Modeling: COMPLEX No WITHIN or BETWEEN anywhere Remember Language Matters BREAK This Section Analyze examples together I provide SPSS data Together: export datafile Write necessary language for Mplus to read data Write model language for desired analyses Full SEM with continuous outcomes Latent Growth Models 149 y ON x1 x2 x3 (regression) x1 WITH x2 (correlation) Basic Model Language f BY item1 item2 item3 item4 item5 (factors or latent variables) X1 X2 y f X1 X2 X3 i1 i2 i3 i4 150i5 25
 Don t Write variable names 151 Main Model Combining CFAs with Path Analyses gen1 gen2 gen3 gen4 gen5 target1 target2 target3 target4 target5 F1 F2 PBS Typical Drinking Probs 152")

26 Data Mplus3_fullSEM.sav No missing data Convert to Mplus-compatible file Save as.dat (tab delimited),.cvs (comma delimited),.dat (fixed ASCII) Don t Write variable names 151 Main Model Combining CFAs with Path Analyses gen1 gen2 gen3 gen4 gen5 target1 target2 target3 target4 target5 F1 F2 PBS Typical Drinking Probs 152 Fill In The Blanks Variable List NAMES ARE Q3 Q4 Q5 Q6 Q7 Q8 Q9 Q10 Q11 Q12 Q13 Q14 Q15 Q16 Q17 Q18 Q19 Q20 Q21 Q22 Q23 Q24 Q25 Q26 Q27 Q28 Q29 Q30 Q31 Q32 Q33 Q34 Q35 Q36 Q37 Q38 Q39 Q40 Q41 Q42 Q43 Q44 Q45 Q46 Q47 Q48 Q49 Q50 Q51 Q52 Q53 Q54 Q55 Q56 Q57 Q58 Q59 Q60 Q61 Q62 Q63 Q64 Q65 Q66 Q67 Q68 Q69 Q70 Q71 gen1 gen2 gen3 gen4 gen5 target1 target2 target3 target4 target5 age FTPT res greek gpa race hisp year athlete gender marry DrinkTyp DrinkHvy Probs PBS; Double-Check Double-Check


 variables; NOMINAL ARE (or IS): names of unordered categorical (nominal) variables; COUNT ARE (or")
27 Main Model Combining CFAs with Path Analyses gen1 gen2 gen3 gen4 gen5 target1 target2 target3 target4 target5 CFA language F1 F2 PBS Path language Typical Drinking Probs 157 Main Model: Don t End Up With USEVARIABLES are gen1 gen2 gen3 gen4 gen5 target1 target2 target3 target4 target5 F1 F2 PBS Q1 Q3 Q2 Typical Drinking Q4 Q6 Q5 Q7 Q9 Q8 Q10 Probs 158 Model:??? Run It! But Wait! Noncontinuous Variables DrinkTyp PBS: Skewness < 1 Kurtosis < 1 Probs CATEGORICAL ARE (or IS): names of binary and ordered categorical (ordinal) variables; NOMINAL ARE (or IS): names of unordered categorical (nominal) variables; COUNT ARE (or IS): names of count variables; Poisson distribution models Zero-Inflated Poisson (ZIP) models
28 INDIRECT EFFECT: But Wait! gen1 Run It! gen2 gen3 gen4 gen5 target1 F1 PBS Typical Drinking Probs target2 target3 F2 target4 163 target5 164 But Wait! We cannot assume that indirect effects (the combined ab paths) are normally distributed) What do we do? Run It! Bootstrap!! Can delete Poisson code (bootstrap also corrects for non-normality) On Your Own Time Latent Growth Model gender athlete Intercept Linear Slope Time 1 (Q66) Time 2 (Q67) Time 3 (Q68)


 means zero-inflated, and is")
29 Model:??? Coming up! Answers Almost There ANSWERS! Main Model But seriously, stop peaking if this is prior to the workshop. Factor loadings (BY) Paths (ON) Results ANSWERS! Zero-Inflated Poisson Factor Loadings Paths Remember (i) means zero-inflated, and is associated with the DV#1 code. Can omit for regular Poisson distributions
 175 176 Results Results Combined impact of both indirect effects Estimates of each individual indirect effect 177")
30 Results ANSWERS! Bootstrapping and Indirect Effects Paths from original model New paths (#1) identifying impact on likelihood of drinking at all (anything other than 0). Bootstrap samples of n = 5,000 Assessing two different indirect effects (y IND m x) Results Results Combined impact of both indirect effects Estimates of each individual indirect effect % CI s use 2.5% upper and lower boundaries Zero is in all three intervals, so no indirect effects are significant 178 Latent Growth Models Remember: Mplus shortcut i s time1@0 time2@1 time3@2; Assumes intercept is 1 s all around Creates paths you specify for slope Allows intercept and slope to correlate Sets variable intercepts to 0 so that all prediction is in the mean of the latent variables (Intercept and Slope) i and s are still labels I created for the latent variables. Can be whatever you want. Answers! LGM First row = LGM Second row = prediction paths
 and linear growth over time")
31 Results Thank You!! Loadings Influence of gender and athletic status on baseline levels (i) and linear growth over time (s) Baseline levels for female nonathletes (i) and their growth over time (s)
Mplus: A Tutorial. About Me
 Mplus: A Tutorial Abby L. Braitman, Ph.D. Old Dominion University November 7, 2014 NOTE: Multigroup Analysis code was updated May 3, 2016 1 About Me B.A. from UMD Briefly at NYU Ph.D. from ODU in 2012
CHAPTER 7 EXAMPLES: MIXTURE MODELING WITH CROSS- SECTIONAL DATA
 Examples: Mixture Modeling With Cross-Sectional Data CHAPTER 7 EXAMPLES: MIXTURE MODELING WITH CROSS- SECTIONAL DATA Mixture modeling refers to modeling with categorical latent variables that represent
Introduction to Mplus
 Introduction to Mplus May 12, 2010 SPONSORED BY: Research Data Centre Population and Life Course Studies PLCS Interdisciplinary Development Initiative Piotr Wilk piotr.wilk@schulich.uwo.ca OVERVIEW Mplus
Introduction to Mixed Models: Multivariate Regression
 Introduction to Mixed Models: Multivariate Regression EPSY 905: Multivariate Analysis Spring 2016 Lecture #9 March 30, 2016 EPSY 905: Multivariate Regression via Path Analysis Today s Lecture Multivariate
CHAPTER 11 EXAMPLES: MISSING DATA MODELING AND BAYESIAN ANALYSIS
 Examples: Missing Data Modeling And Bayesian Analysis CHAPTER 11 EXAMPLES: MISSING DATA MODELING AND BAYESIAN ANALYSIS Mplus provides estimation of models with missing data using both frequentist and Bayesian
CHAPTER 1 INTRODUCTION
 Introduction CHAPTER 1 INTRODUCTION Mplus is a statistical modeling program that provides researchers with a flexible tool to analyze their data. Mplus offers researchers a wide choice of models, estimators,
CHAPTER 18 OUTPUT, SAVEDATA, AND PLOT COMMANDS
 OUTPUT, SAVEDATA, And PLOT Commands CHAPTER 18 OUTPUT, SAVEDATA, AND PLOT COMMANDS THE OUTPUT COMMAND OUTPUT: In this chapter, the OUTPUT, SAVEDATA, and PLOT commands are discussed. The OUTPUT command
PRI Workshop Introduction to AMOS
 PRI Workshop Introduction to AMOS Krissy Zeiser Pennsylvania State University klz24@pop.psu.edu 2-pm /3/2008 Setting up the Dataset Missing values should be recoded in another program (preferably with
Binary IFA-IRT Models in Mplus version 7.11
 Binary IFA-IRT Models in Mplus version 7.11 Example data: 635 older adults (age 80-100) self-reporting on 7 items assessing the Instrumental Activities of Daily Living (IADL) as follows: 1. Housework (cleaning
PSY 9556B (Feb 5) Latent Growth Modeling
 Latent Growth Modeling") PSY 9556B (Feb 5) Latent Growth Modeling Fixed and random word confusion Simplest LGM knowing how to calculate dfs How many time points needed? Power, sample size Nonlinear growth quadratic Nonlinear growth
PSY 9556B (Feb 5) Latent Growth Modeling Fixed and random word confusion Simplest LGM knowing how to calculate dfs How many time points needed? Power, sample size Nonlinear growth quadratic Nonlinear growth
CHAPTER 5. BASIC STEPS FOR MODEL DEVELOPMENT
 CHAPTER 5. BASIC STEPS FOR MODEL DEVELOPMENT This chapter provides step by step instructions on how to define and estimate each of the three types of LC models (Cluster, DFactor or Regression) and also
Introduction. About this Document. What is SPSS. ohow to get SPSS. oopening Data
 Introduction About this Document This manual was written by members of the Statistical Consulting Program as an introduction to SPSS 12.0. It is designed to assist new users in familiarizing themselves
The Mplus modelling framework
 The Mplus modelling framework Continuous variables Categorical variables 1 Mplus syntax structure TITLE: a title for the analysis (not part of the syntax) DATA: (required) information about the data set
Study Guide. Module 1. Key Terms
 Study Guide Module 1 Key Terms general linear model dummy variable multiple regression model ANOVA model ANCOVA model confounding variable squared multiple correlation adjusted squared multiple correlation
Motivating Example. Missing Data Theory. An Introduction to Multiple Imputation and its Application. Background
 An Introduction to Multiple Imputation and its Application Craig K. Enders University of California - Los Angeles Department of Psychology cenders@psych.ucla.edu Background Work supported by Institute
Last updated January 4, 2012
 Last updated January 4, 2012 This document provides a description of Mplus code for implementing mixture factor analysis with four latent class components with and without covariates described in the following
An Introduction to Growth Curve Analysis using Structural Equation Modeling
 An Introduction to Growth Curve Analysis using Structural Equation Modeling James Jaccard New York University 1 Overview Will introduce the basics of growth curve analysis (GCA) and the fundamental questions
HLM versus SEM Perspectives on Growth Curve Modeling. Hsueh-Sheng Wu CFDR Workshop Series August 3, 2015
 HLM versus SEM Perspectives on Growth Curve Modeling Hsueh-Sheng Wu CFDR Workshop Series August 3, 2015 1 Outline What is Growth Curve Modeling (GCM) Advantages of GCM Disadvantages of GCM Graphs of trajectories
Hierarchical Generalized Linear Models
 Generalized Multilevel Linear Models Introduction to Multilevel Models Workshop University of Georgia: Institute for Interdisciplinary Research in Education and Human Development 07 Generalized Multilevel
MPLUS Analysis Examples Replication Chapter 10
 MPLUS Analysis Examples Replication Chapter 10 Mplus includes all input code and output in the *.out file. This document contains selected output from each analysis for Chapter 10. All data preparation
Generalized least squares (GLS) estimates of the level-2 coefficients,
 estimates of the level-2 coefficients,") Contents 1 Conceptual and Statistical Background for Two-Level Models...7 1.1 The general two-level model... 7 1.1.1 Level-1 model... 8 1.1.2 Level-2 model... 8 1.2 Parameter estimation... 9 1.3 Empirical
Contents 1 Conceptual and Statistical Background for Two-Level Models...7 1.1 The general two-level model... 7 1.1.1 Level-1 model... 8 1.1.2 Level-2 model... 8 1.2 Parameter estimation... 9 1.3 Empirical
Data-Analysis Exercise Fitting and Extending the Discrete-Time Survival Analysis Model (ALDA, Chapters 11 & 12, pp )
") Applied Longitudinal Data Analysis Page 1 Data-Analysis Exercise Fitting and Extending the Discrete-Time Survival Analysis Model (ALDA, Chapters 11 & 12, pp. 357-467) Purpose of the Exercise This data-analytic
Applied Longitudinal Data Analysis Page 1 Data-Analysis Exercise Fitting and Extending the Discrete-Time Survival Analysis Model (ALDA, Chapters 11 & 12, pp. 357-467) Purpose of the Exercise This data-analytic
SPSS TRAINING SPSS VIEWS
 SPSS TRAINING SPSS VIEWS Dataset Data file Data View o Full data set, structured same as excel (variable = column name, row = record) Variable View o Provides details for each variable (column in Data
Introduction (SPSS) Opening SPSS Start All Programs SPSS Inc SPSS 21. SPSS Menus
 Opening SPSS Start All Programs SPSS Inc SPSS 21. SPSS Menus") Introduction (SPSS) SPSS is the acronym of Statistical Package for the Social Sciences. SPSS is one of the most popular statistical packages which can perform highly complex data manipulation and analysis
Introduction (SPSS) SPSS is the acronym of Statistical Package for the Social Sciences. SPSS is one of the most popular statistical packages which can perform highly complex data manipulation and analysis
Right-click on whatever it is you are trying to change Get help about the screen you are on Help Help Get help interpreting a table
 Q Cheat Sheets What to do when you cannot figure out how to use Q What to do when the data looks wrong Right-click on whatever it is you are trying to change Get help about the screen you are on Help Help
Handbook of Statistical Modeling for the Social and Behavioral Sciences
 Handbook of Statistical Modeling for the Social and Behavioral Sciences Edited by Gerhard Arminger Bergische Universität Wuppertal Wuppertal, Germany Clifford С. Clogg Late of Pennsylvania State University
ANNOUNCING THE RELEASE OF LISREL VERSION BACKGROUND 2 COMBINING LISREL AND PRELIS FUNCTIONALITY 2 FIML FOR ORDINAL AND CONTINUOUS VARIABLES 3
 ANNOUNCING THE RELEASE OF LISREL VERSION 9.1 2 BACKGROUND 2 COMBINING LISREL AND PRELIS FUNCTIONALITY 2 FIML FOR ORDINAL AND CONTINUOUS VARIABLES 3 THREE-LEVEL MULTILEVEL GENERALIZED LINEAR MODELS 3 FOUR
Ronald H. Heck 1 EDEP 606 (F2015): Multivariate Methods rev. November 16, 2015 The University of Hawai i at Mānoa
: Multivariate Methods rev. November 16, 2015 The University of Hawai i at Mānoa") Ronald H. Heck 1 In this handout, we will address a number of issues regarding missing data. It is often the case that the weakest point of a study is the quality of the data that can be brought to bear
Ronald H. Heck 1 In this handout, we will address a number of issues regarding missing data. It is often the case that the weakest point of a study is the quality of the data that can be brought to bear
Estimating DCMs Using Mplus. Chapter 9 Example Data
 Estimating DCMs Using Mplus 1 NCME 2012: Diagnostic Measurement Workshop Chapter 9 Example Data Example assessment 7 items Measuring 3 attributes Q matrix Item Attribute 1 Attribute 2 Attribute 3 1 1 0
Creating a data file and entering data
 4 Creating a data file and entering data There are a number of stages in the process of setting up a data file and analysing the data. The flow chart shown on the next page outlines the main steps that
Example Using Missing Data 1
 Ronald H. Heck and Lynn N. Tabata 1 Example Using Missing Data 1 Creating the Missing Data Variable (Miss) Here is a data set (achieve subset MANOVAmiss.sav) with the actual missing data on the outcomes.
Dr. Barbara Morgan Quantitative Methods
 Dr. Barbara Morgan Quantitative Methods 195.650 Basic Stata This is a brief guide to using the most basic operations in Stata. Stata also has an on-line tutorial. At the initial prompt type tutorial. In
Zero-Inflated Poisson Regression
 Chapter 329 Zero-Inflated Poisson Regression Introduction The zero-inflated Poisson (ZIP) regression is used for count data that exhibit overdispersion and excess zeros. The data distribution combines
Regression. Dr. G. Bharadwaja Kumar VIT Chennai
 Regression Dr. G. Bharadwaja Kumar VIT Chennai Introduction Statistical models normally specify how one set of variables, called dependent variables, functionally depend on another set of variables, called
Also, for all analyses, two other files are produced upon program completion.
 MIXOR for Windows Overview MIXOR is a program that provides estimates for mixed-effects ordinal (and binary) regression models. This model can be used for analysis of clustered or longitudinal (i.e., 2-level)
Correctly Compute Complex Samples Statistics
 SPSS Complex Samples 15.0 Specifications Correctly Compute Complex Samples Statistics When you conduct sample surveys, use a statistics package dedicated to producing correct estimates for complex sample
Lecture on Modeling Tools for Clustering & Regression
 Lecture on Modeling Tools for Clustering & Regression CS 590.21 Analysis and Modeling of Brain Networks Department of Computer Science University of Crete Data Clustering Overview Organizing data into
Predict Outcomes and Reveal Relationships in Categorical Data
 PASW Categories 18 Specifications Predict Outcomes and Reveal Relationships in Categorical Data Unleash the full potential of your data through predictive analysis, statistical learning, perceptual mapping,
An introduction to SPSS
 An introduction to SPSS To open the SPSS software using U of Iowa Virtual Desktop... Go to https://virtualdesktop.uiowa.edu and choose SPSS 24. Contents NOTE: Save data files in a drive that is accessible
Correctly Compute Complex Samples Statistics
 PASW Complex Samples 17.0 Specifications Correctly Compute Complex Samples Statistics When you conduct sample surveys, use a statistics package dedicated to producing correct estimates for complex sample
Missing Data Missing Data Methods in ML Multiple Imputation
 Missing Data Missing Data Methods in ML Multiple Imputation PRE 905: Multivariate Analysis Lecture 11: April 22, 2014 PRE 905: Lecture 11 Missing Data Methods Today s Lecture The basics of missing data:
Multidimensional Latent Regression
 Multidimensional Latent Regression Ray Adams and Margaret Wu, 29 August 2010 In tutorial seven, we illustrated how ConQuest can be used to fit multidimensional item response models; and in tutorial five,
Tutorial #1: Using Latent GOLD choice to Estimate Discrete Choice Models
 Tutorial #1: Using Latent GOLD choice to Estimate Discrete Choice Models In this tutorial, we analyze data from a simple choice-based conjoint (CBC) experiment designed to estimate market shares (choice
Show how the LG-Syntax can be generated from a GUI model. Modify the LG-Equations to specify a different LC regression model
 Tutorial #S1: Getting Started with LG-Syntax DemoData = 'conjoint.sav' This tutorial introduces the use of the LG-Syntax module, an add-on to the Advanced version of Latent GOLD. In this tutorial we utilize
22/10/16. Data Coding in SPSS. Data Coding in SPSS. Data Coding in SPSS. Data Coding in SPSS
 DATA CODING IN SPSS STAFF TRAINING WORKSHOP March 28, 2017 Delivered by Dr. Director of Applied Economics Unit African Heritage Institution Enugu Nigeria To code data in SPSS, Lunch the SPSS The Data Editor
ST Lab 1 - The basics of SAS
 ST 512 - Lab 1 - The basics of SAS What is SAS? SAS is a programming language based in C. For the most part SAS works in procedures called proc s. For instance, to do a correlation analysis there is proc
STATISTICS FOR PSYCHOLOGISTS
 STATISTICS FOR PSYCHOLOGISTS SECTION: JAMOVI CHAPTER: USING THE SOFTWARE Section Abstract: This section provides step-by-step instructions on how to obtain basic statistical output using JAMOVI, both visually
Using Machine Learning to Optimize Storage Systems
 Using Machine Learning to Optimize Storage Systems Dr. Kiran Gunnam 1 Outline 1. Overview 2. Building Flash Models using Logistic Regression. 3. Storage Object classification 4. Storage Allocation recommendation
STATISTICS (STAT) Statistics (STAT) 1
 Statistics (STAT) 1") Statistics (STAT) 1 STATISTICS (STAT) STAT 2013 Elementary Statistics (A) Prerequisites: MATH 1483 or MATH 1513, each with a grade of "C" or better; or an acceptable placement score (see placement.okstate.edu).
Statistics (STAT) 1 STATISTICS (STAT) STAT 2013 Elementary Statistics (A) Prerequisites: MATH 1483 or MATH 1513, each with a grade of "C" or better; or an acceptable placement score (see placement.okstate.edu).
Estimation of a hierarchical Exploratory Structural Equation Model (ESEM) using ESEMwithin-CFA
 using ESEMwithin-CFA") Estimation of a hierarchical Exploratory Structural Equation Model (ESEM) using ESEMwithin-CFA Alexandre J.S. Morin, Substantive Methodological Synergy Research Laboratory, Department of Psychology, Concordia
Estimation of a hierarchical Exploratory Structural Equation Model (ESEM) using ESEMwithin-CFA Alexandre J.S. Morin, Substantive Methodological Synergy Research Laboratory, Department of Psychology, Concordia
Multiple Imputation for Missing Data. Benjamin Cooper, MPH Public Health Data & Training Center Institute for Public Health
 Multiple Imputation for Missing Data Benjamin Cooper, MPH Public Health Data & Training Center Institute for Public Health Outline Missing data mechanisms What is Multiple Imputation? Software Options
Estimation of Item Response Models
 Estimation of Item Response Models Lecture #5 ICPSR Item Response Theory Workshop Lecture #5: 1of 39 The Big Picture of Estimation ESTIMATOR = Maximum Likelihood; Mplus Any questions? answers Lecture #5:
Opening a Data File in SPSS. Defining Variables in SPSS
 Opening a Data File in SPSS To open an existing SPSS file: 1. Click File Open Data. Go to the appropriate directory and find the name of the appropriate file. SPSS defaults to opening SPSS data files with
SPSS QM II. SPSS Manual Quantitative methods II (7.5hp) SHORT INSTRUCTIONS BE CAREFUL
 SHORT INSTRUCTIONS BE CAREFUL") SPSS QM II SHORT INSTRUCTIONS This presentation contains only relatively short instructions on how to perform some statistical analyses in SPSS. Details around a certain function/analysis method not covered
SPSS QM II SHORT INSTRUCTIONS This presentation contains only relatively short instructions on how to perform some statistical analyses in SPSS. Details around a certain function/analysis method not covered
Applied Regression Modeling: A Business Approach
 i Applied Regression Modeling: A Business Approach Computer software help: SPSS SPSS (originally Statistical Package for the Social Sciences ) is a commercial statistical software package with an easy-to-use
D-Optimal Designs. Chapter 888. Introduction. D-Optimal Design Overview
 Chapter 888 Introduction This procedure generates D-optimal designs for multi-factor experiments with both quantitative and qualitative factors. The factors can have a mixed number of levels. For example,
Multiple Imputation with Mplus
 Multiple Imputation with Mplus Tihomir Asparouhov and Bengt Muthén Version 2 September 29, 2010 1 1 Introduction Conducting multiple imputation (MI) can sometimes be quite intricate. In this note we provide
Multiple Group CFA in AMOS (And Modification Indices and Nested Models)
") Multiple Group CFA in AMOS (And Modification Indices and Nested Models) For this lab we will use the Self-Esteem data. An Excel file of the data is available at _www.biostat.umn.edu/~melanie/ph5482/data/index.html
Multiple Group CFA in AMOS (And Modification Indices and Nested Models) For this lab we will use the Self-Esteem data. An Excel file of the data is available at _www.biostat.umn.edu/~melanie/ph5482/data/index.html
RKWard: IRT analyses and person scoring with ltm
 Software Corner Software Corner: RKWard: IRT analyses and person scoring with ltm Aaron Olaf Batty abatty@sfc.keio.ac.jp Keio University Lancaster University In SRB 16(2), I introduced the ever-improving,
1. What specialist uses information obtained from bones to help police solve crimes?
 Mathematics: Modeling Our World Unit 4: PREDICTION HANDOUT VIDEO VIEWING GUIDE H4.1 1. What specialist uses information obtained from bones to help police solve crimes? 2.What are some things that can
1. Basic Steps for Data Analysis Data Editor. 2.4.To create a new SPSS file
 1 SPSS Guide 2009 Content 1. Basic Steps for Data Analysis. 3 2. Data Editor. 2.4.To create a new SPSS file 3 4 3. Data Analysis/ Frequencies. 5 4. Recoding the variable into classes.. 5 5. Data Analysis/
Performance of Latent Growth Curve Models with Binary Variables
 Performance of Latent Growth Curve Models with Binary Variables Jason T. Newsom & Nicholas A. Smith Department of Psychology Portland State University 1 Goal Examine estimation of latent growth curve models
Missing Data Analysis with SPSS
 Missing Data Analysis with SPSS Meng-Ting Lo (lo.194@osu.edu) Department of Educational Studies Quantitative Research, Evaluation and Measurement Program (QREM) Research Methodology Center (RMC) Outline
RUDIMENTS OF STATA. After entering this command the data file WAGE1.DTA is loaded into memory.
 J.M. Wooldridge Michigan State University RUDIMENTS OF STATA This handout covers the most often encountered Stata commands. It is not comprehensive, but the summary will allow you to do basic data management
Mr. Kongmany Chaleunvong. GFMER - WHO - UNFPA - LAO PDR Training Course in Reproductive Health Research Vientiane, 22 October 2009
 Mr. Kongmany Chaleunvong GFMER - WHO - UNFPA - LAO PDR Training Course in Reproductive Health Research Vientiane, 22 October 2009 1 Object of the Course Introduction to SPSS The basics of managing data
A Beginner's Guide to. Randall E. Schumacker. The University of Alabama. Richard G. Lomax. The Ohio State University. Routledge
 A Beginner's Guide to Randall E. Schumacker The University of Alabama Richard G. Lomax The Ohio State University Routledge Taylor & Francis Group New York London About the Authors Preface xv xvii 1 Introduction
CHAPTER 13 EXAMPLES: SPECIAL FEATURES
 Examples: Special Features CHAPTER 13 EXAMPLES: SPECIAL FEATURES In this chapter, special features not illustrated in the previous example chapters are discussed. A cross-reference to the original example
Spatial Patterns Point Pattern Analysis Geographic Patterns in Areal Data
 Spatial Patterns We will examine methods that are used to analyze patterns in two sorts of spatial data: Point Pattern Analysis - These methods concern themselves with the location information associated
Data analysis using Microsoft Excel
 Introduction to Statistics Statistics may be defined as the science of collection, organization presentation analysis and interpretation of numerical data from the logical analysis. 1.Collection of Data
Using Mplus Monte Carlo Simulations In Practice: A Note On Non-Normal Missing Data In Latent Variable Models
 Using Mplus Monte Carlo Simulations In Practice: A Note On Non-Normal Missing Data In Latent Variable Models Bengt Muth en University of California, Los Angeles Tihomir Asparouhov Muth en & Muth en Mplus
Maximizing Statistical Interactions Part II: Database Issues Provided by: The Biostatistics Collaboration Center (BCC) at Northwestern University
 at Northwestern University") Maximizing Statistical Interactions Part II: Database Issues Provided by: The Biostatistics Collaboration Center (BCC) at Northwestern University While your data tables or spreadsheets may look good to
Maximizing Statistical Interactions Part II: Database Issues Provided by: The Biostatistics Collaboration Center (BCC) at Northwestern University While your data tables or spreadsheets may look good to
Panel Data 4: Fixed Effects vs Random Effects Models
 Panel Data 4: Fixed Effects vs Random Effects Models Richard Williams, University of Notre Dame, http://www3.nd.edu/~rwilliam/ Last revised April 4, 2017 These notes borrow very heavily, sometimes verbatim,
MPLUS Analysis Examples Replication Chapter 13
 MPLUS Analysis Examples Replication Chapter 13 Mplus includes all input code and output in the *.out file. This document contains all code and selected output from the weighted multilevel models presented
AcaStat User Manual. Version 8.3 for Mac and Windows. Copyright 2014, AcaStat Software. All rights Reserved.
 AcaStat User Manual Version 8.3 for Mac and Windows Copyright 2014, AcaStat Software. All rights Reserved. http://www.acastat.com Table of Contents INTRODUCTION... 5 GETTING HELP... 5 INSTALLATION... 5
Introduction to Hierarchical Linear Model. Hsueh-Sheng Wu CFDR Workshop Series January 30, 2017
 Introduction to Hierarchical Linear Model Hsueh-Sheng Wu CFDR Workshop Series January 30, 2017 1 Outline What is Hierarchical Linear Model? Why do nested data create analytic problems? Graphic presentation
Bootstrapping Methods
 Bootstrapping Methods example of a Monte Carlo method these are one Monte Carlo statistical method some Bayesian statistical methods are Monte Carlo we can also simulate models using Monte Carlo methods
Data Analysis and Solver Plugins for KSpread USER S MANUAL. Tomasz Maliszewski
 Data Analysis and Solver Plugins for KSpread USER S MANUAL Tomasz Maliszewski tmaliszewski@wp.pl Table of Content CHAPTER 1: INTRODUCTION... 3 1.1. ABOUT DATA ANALYSIS PLUGIN... 3 1.3. ABOUT SOLVER PLUGIN...
LISREL 10.1 RELEASE NOTES 2 1 BACKGROUND 2 2 MULTIPLE GROUP ANALYSES USING A SINGLE DATA FILE 2
 LISREL 10.1 RELEASE NOTES 2 1 BACKGROUND 2 2 MULTIPLE GROUP ANALYSES USING A SINGLE DATA FILE 2 3 MODELS FOR GROUPED- AND DISCRETE-TIME SURVIVAL DATA 5 4 MODELS FOR ORDINAL OUTCOMES AND THE PROPORTIONAL
SPSS stands for Statistical Package for the Social Sciences. SPSS was made to be easier to use then other statistical software like S-Plus, R, or SAS.
 SPSS DR.MARANE 1 SPSS at a glance SPSS stands for Statistical Package for the Social Sciences SPSS was made to be easier to use then other statistical software like S-Plus, R, or SAS. The newest version
Missing Data and Imputation
 Missing Data and Imputation NINA ORWITZ OCTOBER 30 TH, 2017 Outline Types of missing data Simple methods for dealing with missing data Single and multiple imputation R example Missing data is a complex
USER S GUIDE LATENT GOLD 4.0. Innovations. Statistical. Jeroen K. Vermunt & Jay Magidson. Thinking outside the brackets! TM
 LATENT GOLD 4.0 USER S GUIDE Jeroen K. Vermunt & Jay Magidson Statistical Innovations Thinking outside the brackets! TM For more information about Statistical Innovations Inc. please visit our website
Introduction to STATA
 Introduction to STATA Duah Dwomoh, MPhil School of Public Health, University of Ghana, Accra July 2016 International Workshop on Impact Evaluation of Population, Health and Nutrition Programs Learning
CHAPTER 12 ASDA ANALYSIS EXAMPLES REPLICATION-MPLUS 5.21 GENERAL NOTES ABOUT ANALYSIS EXAMPLES REPLICATION
 CHAPTER 12 ASDA ANALYSIS EXAMPLES REPLICATION-MPLUS 5.21 GENERAL NOTES ABOUT ANALYSIS EXAMPLES REPLICATION These examples are intended to provide guidance on how to use the commands/procedures for analysis
IENG484 Quality Engineering Lab 1 RESEARCH ASSISTANT SHADI BOLOUKIFAR
 IENG484 Quality Engineering Lab 1 RESEARCH ASSISTANT SHADI BOLOUKIFAR SPSS (Statistical package for social science) Originally is acronym of Statistical Package for the Social Science but, now it stands
STA 570 Spring Lecture 5 Tuesday, Feb 1
 STA 570 Spring 2011 Lecture 5 Tuesday, Feb 1 Descriptive Statistics Summarizing Univariate Data o Standard Deviation, Empirical Rule, IQR o Boxplots Summarizing Bivariate Data o Contingency Tables o Row
PHPM 672/677 Lab #2: Variables & Conditionals Due date: Submit by 11:59pm Monday 2/5 with Assignment 2
 PHPM 672/677 Lab #2: Variables & Conditionals Due date: Submit by 11:59pm Monday 2/5 with Assignment 2 Overview Most assignments will have a companion lab to help you learn the task and should cover similar
Further Maths Notes. Common Mistakes. Read the bold words in the exam! Always check data entry. Write equations in terms of variables
 Further Maths Notes Common Mistakes Read the bold words in the exam! Always check data entry Remember to interpret data with the multipliers specified (e.g. in thousands) Write equations in terms of variables
610 R12 Prof Colleen F. Moore Analysis of variance for Unbalanced Between Groups designs in R For Psychology 610 University of Wisconsin--Madison
 610 R12 Prof Colleen F. Moore Analysis of variance for Unbalanced Between Groups designs in R For Psychology 610 University of Wisconsin--Madison R is very touchy about unbalanced designs, partly because
Economics of Cybercrime The Influence of Perceived Cybercrime Risk on Online Service Adoption of European Internet Users
 MÜNSTER Economics of Cybercrime The Influence of Perceived Cybercrime Risk on Online Service Adoption of European Internet Users Markus Riek Rainer Böhme Tyler Moore June 23 2014 Agenda MÜNSTER Economics
DEPARTMENT OF HEALTH AND HUMAN SCIENCES HS900 RESEARCH METHODS
 DEPARTMENT OF HEALTH AND HUMAN SCIENCES HS900 RESEARCH METHODS Using SPSS Topics addressed today: 1. Accessing data from CMR 2. Starting SPSS 3. Getting familiar with SPSS 4. Entering data 5. Saving data
Conducting a Path Analysis With SPSS/AMOS
 Conducting a Path Analysis With SPSS/AMOS Download the PATH-INGRAM.sav data file from my SPSS data page and then bring it into SPSS. The data are those from the research that led to this publication: Ingram,
1, if item A was preferred to item B 0, if item B was preferred to item A
 VERSION 2 BETA (PLEASE EMAIL A.A.BROWN@KENT.AC.UK IF YOU FIND ANY BUGS) MPLUS SYNTAX BUILDER FOR TESTING FORCED-CHOICE DATA WITH THE THURSTONIAN IRT MODEL USER GUIDE INTRODUCTION Brown and Maydeu-Olivares
NCSS Statistical Software
 Chapter 327 Geometric Regression Introduction Geometric regression is a special case of negative binomial regression in which the dispersion parameter is set to one. It is similar to regular multiple regression
Subset Selection in Multiple Regression
 Chapter 307 Subset Selection in Multiple Regression Introduction Multiple regression analysis is documented in Chapter 305 Multiple Regression, so that information will not be repeated here. Refer to that
INTRODUCTORY SPSS. Dr Feroz Mahomed Swalaha x2689
 INTRODUCTORY SPSS Dr Feroz Mahomed Swalaha fswalaha@dut.ac.za x2689 1 Statistics (the systematic collection and display of numerical data) is the most abused area of numeracy. 97% of statistics are made
Coding Categorical Variables in Regression: Indicator or Dummy Variables. Professor George S. Easton
 Coding Categorical Variables in Regression: Indicator or Dummy Variables Professor George S. Easton DataScienceSource.com This video is embedded on the following web page at DataScienceSource.com: DataScienceSource.com/DummyVariables
WebSEM: Structural Equation Modeling Online
 WebSEM: Structural Equation Modeling Online Zhiyong Zhang and Ke-Hai Yuan August 27, 2012 118 Haggar Hall, Department of Psychology, University of Notre Dame 1 Thanks The development of the path diagram
Week 4: Simple Linear Regression II
 Week 4: Simple Linear Regression II Marcelo Coca Perraillon University of Colorado Anschutz Medical Campus Health Services Research Methods I HSMP 7607 2017 c 2017 PERRAILLON ARR 1 Outline Algebraic properties
Supplementary Material. 4) Mplus input code to estimate the latent transition analysis model
 Mplus input code to estimate the latent transition analysis model") WORKING CONDITIONS AMONG HIGH-SKILLED WORKERS S1 Supplementary Material 1) Representativeness of the analytic sample 2) Cross-sectional latent class analyses 3) Mplus input code to estimate the latent
WORKING CONDITIONS AMONG HIGH-SKILLED WORKERS S1 Supplementary Material 1) Representativeness of the analytic sample 2) Cross-sectional latent class analyses 3) Mplus input code to estimate the latent
Multiple imputation using chained equations: Issues and guidance for practice
 Multiple imputation using chained equations: Issues and guidance for practice Ian R. White, Patrick Royston and Angela M. Wood http://onlinelibrary.wiley.com/doi/10.1002/sim.4067/full By Gabrielle Simoneau