Parallel Debugging with TotalView BSC-CNS
|
|
|
- Walter Dalton
- 5 years ago
- Views:
Transcription
1 Parallel Debugging with TotalView BSC-CNS
2 AGENDA What debugging means? Debugging Tools in the RES Allinea DDT as alternative (RogueWave Software) What is TotalView Compiling Your Program Starting totalview TotalView's Basic Look and Feel Basic usage: Action points, groups, navigating the code... Built-in variables and statements Expression Evaluation and Code Fragments Memory Debugging Remote Display Some notes on CLI Hands on 2

3 What debugging means? Debugging 1.0: is a methodical process of finding and reducing the number of bugs. Originally It literally meant the process to eliminate bugs like this: 3
4 What debugging means? Debugging 2.0: Is the process to confirm all the things that you believe are true... because there is, at least one, that is not Things that you believe: This variable has been set before entering the loop This variable is only written by master process I am sending the right data type in all MPI communications 4
5 Debugging Tools Serial Debugging: Printf() gdb and its frontends (DDD) Others... Parallel Debugging: Both serial and parallel debuggers are useful. Serial debuggers, like gdb, are what most programmers are used to, but parallel debuggers can attach to all the individual processes in an MPI job simultaneously, treating the MPI application as a single entity. (c) Allinea Software Linux Power TotalView Version: Build: Suse 10 ppc64 Build Date: Mar


6 Debugging Tools 6
7 DDT as alternative DDT (Distributed Debugging Tool) from the Allinea Corporation Parallel debugger which provides many of the same basic features as Totalview, as well as some new elements. Totalview has a much larger feature set than DDT: with debugging capability for more than one executable at a time machine level language support Tcl command line options other advanced components But.. These sometimes are not the primary reasons why scientists need a parallel debugger. Why? Because... Most scientists need a simple and user friendly way to set breakpoints, step through code and halt execution while they examine variable values and code logic across different processors. 7
8 DDT as alternative Some Features: DDT has an more intuitive user interface, especially for beginners Different ways of navigating through the processes None of both interfaces are suitable to debug apps with hundreds of processors (might become cumbersome) Both allow to dive into distributed multidimensionals arrays, subarrays, slices. And many more 8
9 What is TotalView? TotalView is a sophisticated software debugger product of RogueWave Software Used for debugging and analyzing both serial and parallel programs. Multi-threaded Debugging Parallel Debugging: MPI, PVM, Others Especially designed for use with complex, multi-process and/or multi-threaded applications. Wide compiler & platform support C, C++, Fortran 77 & 90, UPC Unix, Linux, OS X Reverse debugging (Replay Engine) Long distance remote debugging Unattended Batch Debugging TVD along with DDT are the most popular HPC debuggers to date. 9
10 Compiling your program Always compile with -g and -O0 - O0 is important because with some optimizations, even when they not modify the code semantics, the source code may not reflect what is really happening. - In the IBM compilers, some optimizations levels might alter the code semantics. That's why it is important to use -qstrict when using -O3 - TVD can debug code compiled without -g but assembler will be shown 10
11 Starting Totalview TVD must be sent through the batch system Connect to MareNostrum using -X option: ssh -X Jump to a node above login4 (from login5 to login8) ssh -Y login6 Sumbit the batch script: mnsubmit run.sh 1 #!/bin/bash 2 job_name = simple2 3 initialdir =./ 4 output = mpi_%j.err 5 error = mpi_%j.err 6 total_tasks = 4 7 cpus_per_task = 4 8 wall_clock_limit = 01:10:00 9 mining_level = 0 x11 = /gpfs/apps/totalview/totalview -mpi SLURM -np 4./simple -a Prueba de TVD 11

12 Starting Totalview 12


13 TotalView's Basic Look and Feel TVD contains two kinds of windows: - Root Window (Control) * States of processes * Processes and thread Status * Instant navigation access. 13

14 TotalView's Basic Look and Feel TVD contains two kinds of windows: - Process Window: Provides detailed view of one process 14

15 Basic usage Controlling execution 15
16 Basic usage Controlling execution 16
17 Basic usage Diving : In TVD this concept is widely used to refer the way user navigates through the application in a debugging session in order to: Obtain more information Refocus the process window Open variables... You can dive by: Double-clicking the left mouse button Selecting Dive in the context menu You can dive on: Variables names to open a variable window (viewing data) Function names to open the source Process and threads in the root window to open a process window 17

18 Basic usage Diving example over a variable in the common block in the stack frame 18
19 Basic usage Viewing Data: Diving on a variable opens the Variable Window Contents are updated automatically Changed values are highlighted Last value column Clicking on the variable let the user to edit it: Editing values changes the memory of the program Enter to commit changes Esc to cancel changes Using the Expression List Window Variables can be added using right click on the variable Adding expression directly in the window 19


20 Basic usage Viewing Data: 20

21 Basic usage Viewing Data: Viewing arrays For array data, TotalView provides several additional features: Displaying array slices Data filtering Data Sorting Array statistics 21

22 Basic usage Viewing Data: Slicing arrays Used to display subsections of an array. Particularly useful if only a small section of a large array is of interest. lower_bound:upper_bound:stride Fortran Slice: (1:5, 3:8) C/C++ Slice: [::2][1:20] 22
23 Basic usage Viewing Data: Filtering arrays Arrays containing data types of character, integer or floating point can be filtered to display only desired data. Filtering can be: By arithmetic comparison For IEEE values By a range of values Within an expression See the TotalView documentation for additional examples, syntax options and other important information. Examples: Fortran Filter:.gt. 250 Filter:.eq. $nan Filter: 7:512 C/C++ Filter: >= 100 Filter:!= $inf Filter: 128:<

24 Basic usage Viewing Data: Filtering arrays 24

25 Basic usage Sorting Array Data 25

 is a directive and can be used in")
26 Basic usage Visualizing Array Data From the variable window click on Tools Visualize Large arrays can be sliced down to a reasonable size first Visualize allows to spin, zoom, etc Data is not updated. You must revisualize $visualize() is a directive and can be used in evaluation ponts 26
27 Basic usage Viewing Data: Laminating arrays (view across processes) Totalview allows you to look at the values of a variable in all MPI processes Righ Click on the variable Select the variable window view across You can Filter, visualize, explore distributed arrays... 27

28 Basic usage Viewing Data: Viewing STL TVD transform templates into understandable information: 28

29 Basic usage Call graph: Allows a quick view of the program state Functions are nodes Calls are edges Labels are MPI rank 29
30 Basic usage MPI Messages queue and graph: Provides information from the MPI layer pending messages unexpected messages Messages can be filtered by tags, MPI Communicators. Useful in deadlock situations and load balancing studies. May be to be enabled in the MPI Library --enable debug 30


31 Basic usage 31


32 Basic usage Working with groups 32

33 Basic usage Creating custom groups Group Custom Groups... 33
34 Basic usage Action Points TotalView supports four different types of action points: Breakpoint - stops execution of the processes or threads that reach it. Note that breakpoints apply to the entire process - if any thread executing a process reaches a breakpoint, TotalView will stop the entire process. Process Barrier Point - holds each process when it reaches the barrier point until all processes in the group have reached the barrier point. Primarily for MPI programs. Evaluation Point - causes a code fragment to execute when it is reached. Enables you to set "conditional breakpoints" and perform conditional execution. Watchpoint - enables you to monitor a location in memory and either stop execution or evaluate an expression when the value stored in memory is modified. 34

35 Basic usage Action Points: managing breakpoints 35

36 Basic usage Action Points: Setting 36

37 Basic usage Action Points: Watchpoint When the contents of a watched variable change, TVD stops the program Watchpoints are set from the Variable Window: Tools Watchpoint Watchpoints are NOT set on a variable but on a memory region as well So, user must be aware of the scope of the variable 37

38 Basic usage Action Points: Evaluation and conditional breakpoints It is a cool feature that allows: Testing small source code patching Call functions Set variables Test conditions Use program variables Can't be used with Replay Engine 38

39 Basic usage Action Points: Evaluation And conditional breakpoints 39
40 Built-in variables and statements Built-in Variable Description $clid Returns the cluster ID. $duid Returns the TotalView-assigned Debugger Unique ID (DUID). $newval Returns the value just assigned to a watched memory location (watchpoints only). $nid Returns the node ID. $oldval Returns the value that existed in a watched memory location before a new value modified it (watchpoints only). $pid Returns the process ID. $processduid Returns the DUID of the process. $systid Returns the system-assigned thread ID. When referenced from a process, generates an error. $tid Returns the TotalView-assigned thread ID. When referenced from a process, generates an error. 40

41 Built-in variables and statements 41
42 Expression Evaluation and Code Fragments Code fragments interact with your program, and are evaluated within its runtime context. They can therefore be used for a variety of purposes, such as: Setting conditional breakpoints Program patching - branching around code and/or adding new code Effecting conditional execution Displaying program data Modifying program data TotalView enables you to enter "code fragments" during a debugging session. Code fragments can include a mixture of: C, Fortran or Assembler language code TotalView built-in variables ($tid, $pid, $systid... ) TotalView built-in statements ($stop, $hold, $stopall...) 42
43 Memory Debugging Beginning with TotalView version 8.7, the memory debugging functions of TotalView are packaged as a separate, but integrated, client called MemoryScape. Prior to 8.7, the memory functionality was launched from an integrated Memory Debugging Window. Key features include: Memory usage reports Leak detection Heap status Corrupted memory detection Dangling pointers MemoryScape would require a separate tutorial 43


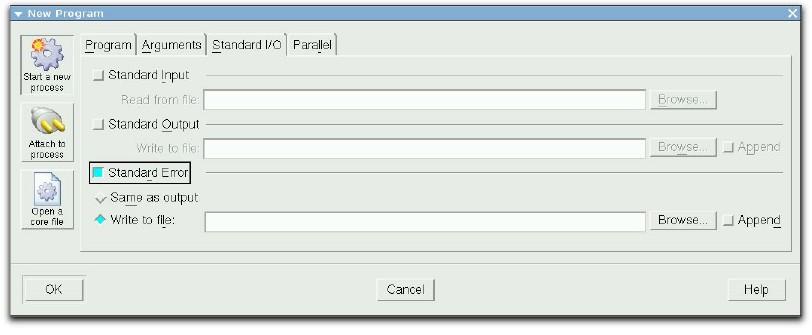
44 Memory Debugging MemoryScape can be launched as a standalone application or from within TotalView It is important to click on the checkbox Enabling Memory Debugging when TVD is started. 44

45 Memory Debugging 45

46 Memory Debugging 46

47 Memory Debugging 47
48 Remote Display This feature is not currently available in MareNostrum but it is worth to mention it here TotalView Remote Display lets you start and then view TotalView as it exe- cutes on another system. For example, debugging in MS Windows from home in a PC which is outside a firewall 48
49 Some notes on the CLI One interesting TotalView feature is the CLI (Command Line Interpreter) The TotalView Command Line Interpreter (CLI) provides a command line debugger interface CLI commands can be integrated into user-written Tcl programs/scripts for "automated" debugging (Advanced) CLI is useful when: a program takes several days to execute the program must be run under a batch scheduling system or network conditions that inhibit GUI interaction. network traffic between the executing program and the person debugging is not permitted or limits the use of the GUI. For details see the TotalView documentation located at 49
50 Hands on 50
51 The End Thanks for your attention 51
TotalView. Debugging Tool Presentation. Josip Jakić
 TotalView Debugging Tool Presentation Josip Jakić josipjakic@ipb.ac.rs Agenda Introduction Getting started with TotalView Primary windows Basic functions Further functions Debugging parallel programs Topics
Debugging with TotalView
 Debugging with TotalView Le Yan HPC Consultant User Services Goals Learn how to start TotalView on Linux clusters Get familiar with TotalView graphic user interface Learn basic debugging functions of TotalView
Improving the Productivity of Scalable Application Development with TotalView May 18th, 2010
 Improving the Productivity of Scalable Application Development with TotalView May 18th, 2010 Chris Gottbrath Principal Product Manager Rogue Wave Major Product Offerings 2 TotalView Technologies Family
ECMWF Workshop on High Performance Computing in Meteorology. 3 rd November Dean Stewart
 ECMWF Workshop on High Performance Computing in Meteorology 3 rd November 2010 Dean Stewart Agenda Company Overview Rogue Wave Product Overview IMSL Fortran TotalView Debugger Acumem ThreadSpotter 1 Copyright
COSC 6374 Parallel Computation. Debugging MPI applications. Edgar Gabriel. Spring 2008
 COSC 6374 Parallel Computation Debugging MPI applications Spring 2008 How to use a cluster A cluster usually consists of a front-end node and compute nodes Name of the front-end node: shark.cs.uh.edu You
Welcome. HRSK Practical on Debugging, Zellescher Weg 12 Willers-Bau A106 Tel
 Center for Information Services and High Performance Computing (ZIH) Welcome HRSK Practical on Debugging, 03.04.2009 Zellescher Weg 12 Willers-Bau A106 Tel. +49 351-463 - 31945 Matthias Lieber (matthias.lieber@tu-dresden.de)
Addressing the Increasing Challenges of Debugging on Accelerated HPC Systems. Ed Hinkel Senior Sales Engineer
 Addressing the Increasing Challenges of Debugging on Accelerated HPC Systems Ed Hinkel Senior Sales Engineer Agenda Overview - Rogue Wave & TotalView GPU Debugging with TotalView Nvdia CUDA Intel Phi 2
TotalView. Users Guide. August 2001 Version 5.0
 TotalView Users Guide August 2001 Version 5.0 Copyright 1999 2001 by Etnus LLC. All rights reserved. Copyright 1998 1999 by Etnus Inc. All rights reserved. Copyright 1996 1998 by Dolphin Interconnect Solutions,
Introduction to debugging. Martin Čuma Center for High Performance Computing University of Utah
 Introduction to debugging Martin Čuma Center for High Performance Computing University of Utah m.cuma@utah.edu Overview Program errors Simple debugging Graphical debugging DDT and Totalview Intel tools
DDT: A visual, parallel debugger on Ra
 DDT: A visual, parallel debugger on Ra David M. Larue dlarue@mines.edu High Performance & Research Computing Campus Computing, Communications, and Information Technologies Colorado School of Mines March,
TotalView Training. Developing parallel, data-intensive applications is hard. We make it easier. Copyright 2012 Rogue Wave Software, Inc.
 TotalView Training Developing parallel, data-intensive applications is hard. We make it easier. 1 Agenda Introduction Startup Remote Display Debugging UI Navigation and Process Control Action Points Data
IBM PSSC Montpellier Customer Center. Content
 Content IBM PSSC Montpellier Customer Center Standard Tools Compiler Options GDB IBM System Blue Gene/P Specifics Core Files + addr2line Coreprocessor Supported Commercial Software TotalView Debugger Allinea
Debugging with GDB and DDT
 Debugging with GDB and DDT Ramses van Zon SciNet HPC Consortium University of Toronto June 13, 2014 1/41 Ontario HPC Summerschool 2014 Central Edition: Toronto Outline Debugging Basics Debugging with the
Facing the challenges of. New Approaches To Debugging Complex Codes! Ed Hinkel, Sales Engineer Rogue Wave Software
 Facing the challenges of or New Approaches To Debugging Complex Codes! Ed Hinkel, Sales Engineer Rogue Wave Software Agenda Introduction Rogue Wave! TotalView! Approaching the Debugging Challenge! 1 TVScript
Debugging with GDB and DDT
 Debugging with GDB and DDT Ramses van Zon SciNet HPC Consortium University of Toronto June 28, 2012 1/41 Ontario HPC Summerschool 2012 Central Edition: Toronto Outline Debugging Basics Debugging with the
Hands-on Workshop on How To Debug Codes at the Institute
 Hands-on Workshop on How To Debug Codes at the Institute H. Birali Runesha, Shuxia Zhang and Ben Lynch (612) 626 0802 (help) help@msi.umn.edu October 13, 2005 Outline Debuggers at the Institute Totalview
Debugging Programs Accelerated with Intel Xeon Phi Coprocessors
 Debugging Programs Accelerated with Intel Xeon Phi Coprocessors A White Paper by Rogue Wave Software. Rogue Wave Software 5500 Flatiron Parkway, Suite 200 Boulder, CO 80301, USA www.roguewave.com Debugging
Debugging and Optimizing Programs Accelerated with Intel Xeon Phi Coprocessors
 Debugging and Optimizing Programs Accelerated with Intel Xeon Phi Coprocessors Chris Gottbrath Rogue Wave Software Boulder, CO Chris.Gottbrath@roguewave.com Abstract Intel Xeon Phi coprocessors present
TotalView Training. Dean Stewart. Rogue Wave Software. Cray XE6 Performance Workshop July 12th, Copyright 2012 Rogue Wave Software, Inc.
 TotalView Training Dean Stewart Rogue Wave Software Cray XE6 Performance Workshop July 12th, 2012 1 Agenda 2 Introduction Startup Remote Display Debugging UI Navigation and Process Control Action Points
Debugging with Totalview. Martin Čuma Center for High Performance Computing University of Utah
 Debugging with Totalview Martin Čuma Center for High Performance Computing University of Utah mcuma@chpc.utah.edu Overview Totalview introduction. Basic operation. Serial debugging. Parallel debugging.
Scalable Debugging with TotalView on Blue Gene. John DelSignore, CTO TotalView Technologies
 Scalable Debugging with TotalView on Blue Gene John DelSignore, CTO TotalView Technologies Agenda TotalView on Blue Gene A little history Current status Recent TotalView improvements ReplayEngine (reverse
Allinea Unified Environment
 Allinea Unified Environment Allinea s unified tools for debugging and profiling HPC Codes Beau Paisley Allinea Software bpaisley@allinea.com 720.583.0380 Today s Challenge Q: What is the impact of current
Debugging with TotalView
 Debugging with TotalView Dieter an Mey Center for Computing and Communication Aachen University of Technology anmey@rz.rwth-aachen.de 1 TotalView, Dieter an Mey, SunHPC 2006 Debugging on Sun dbx line mode
STARTING THE DDT DEBUGGER ON MIO, AUN, & MC2. (Mouse over to the left to see thumbnails of all of the slides)
") STARTING THE DDT DEBUGGER ON MIO, AUN, & MC2 (Mouse over to the left to see thumbnails of all of the slides) ALLINEA DDT Allinea DDT is a powerful, easy-to-use graphical debugger capable of debugging a
STARTING THE DDT DEBUGGER ON MIO, AUN, & MC2 (Mouse over to the left to see thumbnails of all of the slides) ALLINEA DDT Allinea DDT is a powerful, easy-to-use graphical debugger capable of debugging a
Debugging. John Lockman Texas Advanced Computing Center
 Debugging John Lockman Texas Advanced Computing Center Debugging Outline GDB Basic use Attaching to a running job DDT Identify MPI problems using Message Queues Catch memory errors PTP For the extremely
Basic Topics. TotalView Source Code Debugger
 Debugging Heterogeneous HPC Applications with Totalview Cray Users Group 2013, Napa, CA TotalView Source Code Debugger Chris Gottbrath, Product Manager May 6 th, 2013 John Hollis 2 Agenda Basic Topics
TotalView Debugger New Features Guide. version 8.4.0
 TotalView Debugger New Features Guide version 8.4.0 Copyright 2007, 2008 by TotalView Technologies. All rights reserved Copyright 1998 2007 by Etnus LLC. All rights reserved. Copyright 1996 1998 by Dolphin
Guillimin HPC Users Meeting July 14, 2016
 Guillimin HPC Users Meeting July 14, 2016 guillimin@calculquebec.ca McGill University / Calcul Québec / Compute Canada Montréal, QC Canada Outline Compute Canada News System Status Software Updates Training
TotalView Users Guide. version 8.8
 TotalView Users Guide version 8.8 Copyright 2007 2010 by TotalView Technologies. All rights reserved Copyright 1998 2007 by Etnus LLC. All rights reserved. Copyright 1996 1998 by Dolphin Interconnect Solutions,
Le Yan Louisiana Optical Network Initiative. 8/3/2009 Scaling to Petascale Virtual Summer School
 Parallel Debugging Techniques Le Yan Louisiana Optical Network Initiative 8/3/2009 Scaling to Petascale Virtual Summer School Outline Overview of parallel debugging Challenges Tools Strategies Gtf Get
TotalView. User Guide. June 2004 Version 6.5
 TotalView User Guide June 2004 Version 6.5 Copyright 1999 2004 by Etnus LLC. All rights reserved. Copyright 1998 1999 by Etnus, Inc. Copyright 1996 1998 by Dolphin Interconnect Solutions, Inc. Copyright
GPU Technology Conference Three Ways to Debug Parallel CUDA Applications: Interactive, Batch, and Corefile
 GPU Technology Conference 2015 Three Ways to Debug Parallel CUDA Applications: Interactive, Batch, and Corefile Three Ways to Debug Parallel CUDA Applications: Interactive, Batch, and Corefile What do
Debugging Intel Xeon Phi KNC Tutorial
 Debugging Intel Xeon Phi KNC Tutorial Last revised on: 10/7/16 07:37 Overview: The Intel Xeon Phi Coprocessor 2 Debug Library Requirements 2 Debugging Host-Side Applications that Use the Intel Offload
TotalView Release Notes
 These release notes contain a summary of new features and enhancements, late-breaking product issues, migration from earlier releases, and bug fixes. PLEASE NOTE: The version of this document in the product
Integrated Software Environment. Part 2
 Integrated Software Environment Part 2 Operating Systems An operating system is the most important software that runs on a computer. It manages the computer's memory, processes, and all of its software
Performance Tools for Technical Computing
 Christian Terboven terboven@rz.rwth-aachen.de Center for Computing and Communication RWTH Aachen University Intel Software Conference 2010 April 13th, Barcelona, Spain Agenda o Motivation and Methodology
Welcomes PRACE/LinkSCEEM 2011 Winter School Jacques Philouze Vice President Sales & Marketing
 Welcomes PRACE/LinkSCEEM 2011 Winter School Jacques Philouze jacques@allinea.com Vice President Sales & Marketing Content Company Background Products in more depth Allinea OPT (Optimization and Profiling
DDT Debugging Techniques
 DDT Debugging Techniques Carlos Rosales carlos@tacc.utexas.edu Scaling to Petascale 2010 July 7, 2010 Debugging Parallel Programs Usual problems Memory access issues Special cases not accounted for in
Tools and Methodology for Ensuring HPC Programs Correctness and Performance. Beau Paisley
 Tools and Methodology for Ensuring HPC Programs Correctness and Performance Beau Paisley bpaisley@allinea.com About Allinea Over 15 years of business focused on parallel programming development tools Strong
The Eclipse Parallel Tools Platform
 May 1, 2012 Toward an Integrated Development Environment for Improved Software Engineering on Crays Agenda 1. What is the Eclipse Parallel Tools Platform (PTP) 2. Tour of features available in Eclipse/PTP
HPCC - Hrothgar. Getting Started User Guide TotalView. High Performance Computing Center Texas Tech University
 HPCC - Hrothgar Getting Started User Guide TotalView High Performance Computing Center Texas Tech University HPCC - Hrothgar 2 Table of Contents *This user guide is under development... 3 1. Introduction...
Debugging on Intel Platforms
 White Paper Robert Mueller-Albrecht Developer Products Division Intel Corporation Debugging on Intel Platforms Introduction...3 Overview...3 Servers and Workstations...4 Support for Linux*, Mac OS X*,
MPI Runtime Error Detection with MUST
 MPI Runtime Error Detection with MUST At the 27th VI-HPS Tuning Workshop Joachim Protze IT Center RWTH Aachen University April 2018 How many issues can you spot in this tiny example? #include #include
Debugging at Scale Lindon Locks
 Debugging at Scale Lindon Locks llocks@allinea.com Debugging at Scale At scale debugging - from 100 cores to 250,000 Problems faced by developers on real systems Alternative approaches to debugging and
SGI Altix Getting Correct Code Reiner Vogelsang SGI GmbH
 SGI Altix Getting Correct Code Reiner Vogelsang SGI GmbH reiner@sgi.com Module Objectives After completing the module, you will able to Find caveats and hidden errors in application codes Handle debuggers
Beginner's Guide for UK IBM systems
 Beginner's Guide for UK IBM systems This document is intended to provide some basic guidelines for those who already had certain programming knowledge with high level computer languages (e.g. Fortran,
Debugging Applications Using Totalview
 Debugging Applications Using Totalview Timothy H. Kaiser tkaiser@sdsc.edu Slides by:nicholas J Wright First things first.. There is no point in optimising a program that has a bug in it a really fast code
DEBUGGING ON FERMI PREPARING A DEBUGGABLE APPLICATION GDB. GDB on front-end nodes
 DEBUGGING ON FERMI Debugging your application on a system based on a BG/Q architecture like FERMI could be an hard task due to the following problems: the core files generated by a crashing job on FERMI
Allinea DDT Debugger. Dan Mazur, McGill HPC March 5,
 Allinea DDT Debugger Dan Mazur, McGill HPC daniel.mazur@mcgill.ca guillimin@calculquebec.ca March 5, 2015 1 Outline Introduction and motivation Guillimin login and DDT configuration Compiling for a debugger
Working with Shell Scripting. Daniel Balagué
 Working with Shell Scripting Daniel Balagué Editing Text Files We offer many text editors in the HPC cluster. Command-Line Interface (CLI) editors: vi / vim nano (very intuitive and easy to use if you
COSC 6374 Parallel Computation. Analytical Modeling of Parallel Programs (I) Edgar Gabriel Fall Execution Time
 Edgar Gabriel Fall Execution Time") COSC 6374 Parallel Computation Analytical Modeling of Parallel Programs (I) Edgar Gabriel Fall 2015 Execution Time Serial runtime T s : time elapsed between beginning and the end of the execution of a
COSC 6374 Parallel Computation Analytical Modeling of Parallel Programs (I) Edgar Gabriel Fall 2015 Execution Time Serial runtime T s : time elapsed between beginning and the end of the execution of a
ECE QNX Real-time Lab
 Department of Electrical & Computer Engineering Concordia University ECE QNX Real-time Lab User Guide Dan Li 9/12/2011 User Guide of ECE Real-time QNX Lab Contents 1. About Real-time QNX Lab... 2 Contacts...
Parallel Debugging. ª Objective. ª Contents. ª Learn the basics of debugging parallel programs
 ª Objective ª Learn the basics of debugging parallel programs ª Contents ª Launching a debug session ª The Parallel Debug Perspective ª Controlling sets of processes ª Controlling individual processes
TotalView Release Notes
 These release notes contain a summary of new features and enhancements, late-breaking product issues, migration from earlier releases, and bug fixes. PLEASE NOTE: The version of this document in the product
BasicScript 2.25 User s Guide. May 29, 1996
 BasicScript 2.25 User s Guide May 29, 1996 Information in this document is subject to change without notice. No part of this document may be reproduced or transmitted in any form or by any means, electronic
GPU Debugging Made Easy. David Lecomber CTO, Allinea Software
 GPU Debugging Made Easy David Lecomber CTO, Allinea Software david@allinea.com Allinea Software HPC development tools company Leading in HPC software tools market Wide customer base Blue-chip engineering,
Performance Metrics (I)
") COSC 6374 Parallel Computation Parallel Metrics and Debugging MPI application Edgar Gabriel Fall 2014 Performance Metrics (I) Strong Scaling: how much faster does a problem run on p processors compared
COSC 6374 Parallel Computation Parallel Metrics and Debugging MPI application Edgar Gabriel Fall 2014 Performance Metrics (I) Strong Scaling: how much faster does a problem run on p processors compared
TotalView. User Guide. September 2003 Version 6.3
 TotalView User Guide September 2003 Version 6.3 Copyright 1999 2003 by Etnus LLC. All rights reserved. Copyright 1998 1999 by Etnus, Inc. Copyright 1996 1998 by Dolphin Interconnect Solutions, Inc. Copyright
Debug for GDB Users. Action Description Debug GDB $debug <program> <args> >create <program> <args>
 Page 1 of 5 Debug for GDB Users Basic Control To be useful, a debugger must be capable of basic process control. This functionally allows the user to create a debugging session and instruct the process
COSC 4397 Parallel Computation. Debugging and Performance Analysis of Parallel MPI Applications
 COSC 4397 Parallel Computation Debugging and Performance Analysis of Parallel MPI Applications Edgar Gabriel Spring 2006 Edgar Gabriel Debugging sequential applications Several ways how to debug a sequential
Debugging on Blue Waters
 Debugging on Blue Waters Debugging tools and techniques for Blue Waters are described here with example sessions, output, and pointers to small test codes. For tutorial purposes, this material will work
1 Introduction to MARS
 1 Introduction to MARS 1.1 Objectives After completing this lab, you will: Get familiar with the MARS simulator Learn how to assemble, run, and debug a MIPS program 1.2 The MARS Simulator MARS, the MIPS
TotalView. Graphic User Interface Commands Guide. version 8.0
 TotalView Graphic User Interface Commands Guide version 8.0 Copyright 1998 2006 by Etnus LLC. All rights reserved. Copyright 1996 1998 by Dolphin Interconnect Solutions, Inc. Copyright 1993 1996 by BBN
IDE for medical device software development. Hyun-Do Lee, Field Application Engineer
 IDE for medical device software development Hyun-Do Lee, Field Application Engineer Agenda SW Validation Functional safety certified tool IAR Embedded Workbench Code Analysis tools SW Validation Certifications
TotalView Release Notes
 These release notes contain a summary of new features and enhancements, late-breaking product issues, migration from earlier releases, and bug fixes. PLEASE NOTE: The version of this document in the product
Debugging, benchmarking, tuning i.e. software development tools. Martin Čuma Center for High Performance Computing University of Utah
 Debugging, benchmarking, tuning i.e. software development tools Martin Čuma Center for High Performance Computing University of Utah m.cuma@utah.edu SW development tools Development environments Compilers
TotalView Release Notes
 Platform Changes The following new platforms are now supported by TotalView: NVIDIA CUDA 5.0 and 5.5 Mac OS X Mavericks (10.9) Ubuntu 12.04, 12.10 and 13.04 Fedora 19 The following platforms are no longer
Module 4: Working with MPI
 Module 4: Working with MPI Objective Learn how to develop, build and launch a parallel (MPI) program on a remote parallel machine Contents Remote project setup Building with Makefiles MPI assistance features
Exercise Session 6 Computer Architecture and Systems Programming
 Systems Group Department of Computer Science ETH Zürich Exercise Session 6 Computer Architecture and Systems Programming Herbstsemester 2016 Agenda GDB Outlook on assignment 6 GDB The GNU Debugger 3 Debugging..
Parallel Programming and Debugging with CUDA C. Geoff Gerfin Sr. System Software Engineer
 Parallel Programming and Debugging with CUDA C Geoff Gerfin Sr. System Software Engineer CUDA - NVIDIA s Architecture for GPU Computing Broad Adoption Over 250M installed CUDA-enabled GPUs GPU Computing
NightStar. NightView Source Level Debugger. Real-Time Linux Debugging and Analysis Tools BROCHURE
 NightStar Real-Time Linux Debugging and Analysis Tools Concurrent s NightStar is a powerful, integrated tool set for debugging and analyzing time-critical Linux applications. NightStar tools run with minimal
Debugging for the hybrid-multicore age (A HPC Perspective) David Lecomber CTO, Allinea Software
 David Lecomber CTO, Allinea Software") Debugging for the hybrid-multicore age (A HPC Perspective) David Lecomber CTO, Allinea Software david@allinea.com Agenda What is HPC? How is scale affecting HPC? Achieving tool scalability Scale in practice
Debugging for the hybrid-multicore age (A HPC Perspective) David Lecomber CTO, Allinea Software david@allinea.com Agenda What is HPC? How is scale affecting HPC? Achieving tool scalability Scale in practice
Buffer Overflow Defenses
 Buffer Overflow Defenses Some examples, pros, and cons of various defenses against buffer overflows. Caveats: 1. Not intended to be a complete list of products that defend against buffer overflows. 2.
Developing, Debugging, and Optimizing GPU Codes for High Performance Computing with Allinea Forge
 Developing, Debugging, and Optimizing GPU Codes for High Performance Computing with Allinea Forge Ryan Hulguin Applications Engineer ryan.hulguin@arm.com Agenda Introduction Overview of Allinea Products
PL in the Broader Research Community
 PL in the Broader Research Community EECS 590: Advanced Programming Languages 27. November 2017 Kevin Angstadt angstadt@umich.edu 1 Who am I? Fourth-year PhD student (I did my first three years at UVA)
Understanding Dynamic Parallelism
 Understanding Dynamic Parallelism Know your code and know yourself Presenter: Mark O Connor, VP Product Management Agenda Introduction and Background Fixing a Dynamic Parallelism Bug Understanding Dynamic
Debugging HPC Applications. David Lecomber CTO, Allinea Software
 Debugging HPC Applications David Lecomber CTO, Allinea Software david@allinea.com Agenda Bugs and Debugging Debugging parallel applications Debugging OpenACC and other hybrid codes Debugging for Petascale
QNX Software Development Platform 6.6. Quickstart Guide
 QNX Software Development Platform 6.6 QNX Software Development Platform 6.6 Quickstart Guide 2005 2014, QNX Software Systems Limited, a subsidiary of BlackBerry. All rights reserved. QNX Software Systems
Debugging. P.Dagna, M.Cremonesi. May 2015
 Debugging P.Dagna, M.Cremonesi May 2015 Introduction Oneofthemostwidelyusedmethodstofindoutthereasonofa strange behavior in a program is the insertion of printf or write statements in the supposed critical
Eclipse-PTP: An Integrated Environment for the Development of Parallel Applications
 Eclipse-PTP: An Integrated Environment for the Development of Parallel Applications Greg Watson (grw@us.ibm.com) Craig Rasmussen (rasmusen@lanl.gov) Beth Tibbitts (tibbitts@us.ibm.com) Parallel Tools Workshop,
Debugging. Marcelo Ponce SciNet HPC Consortium University of Toronto. July 15, /41 Ontario HPC Summerschool 2016 Central Edition: Toronto
 Debugging Marcelo Ponce SciNet HPC Consortium University of Toronto July 15, 2016 1/41 Ontario HPC Summerschool 2016 Central Edition: Toronto Outline Debugging Basics Debugging with the command line: GDB
Debugging CUDA Applications with Allinea DDT. Ian Lumb Sr. Systems Engineer, Allinea Software Inc.
 Debugging CUDA Applications with Allinea DDT Ian Lumb Sr. Systems Engineer, Allinea Software Inc. ilumb@allinea.com GTC 2013, San Jose, March 20, 2013 Embracing GPUs GPUs a rival to traditional processors
Your code must have been compiled with the -g compiler option. Example:
 ddd Tips This provides some helpful information about the Unix ddd debugger. with more detailed information: There are other resources available gnu ddd manual matloff ddd information Contents Prerequisites...
Short Introduction to Debugging Tools on the Cray XC40
 Short Introduction to Debugging Tools on the Cray XC40 Overview Debugging Get your code up and running correctly. Profiling Locate performance bottlenecks. Light weight At most relinking. Get a first picture
Laboratory Assignment #4 Debugging in Eclipse CDT 1
 Lab 4 (10 points) November 20, 2013 CS-2301, System Programming for Non-majors, B-term 2013 Objective Laboratory Assignment #4 Debugging in Eclipse CDT 1 Due: at 11:59 pm on the day of your lab session
LECTURE 3 ADMINISTRATION SECTION -A
 LECTURE 3 SYSTEM PROGRAMMING & SYSTEM ADMINISTRATION SECTION -A INTRODUCTION Interpreters Compilers Text editors Debug monitors Programming environment INTERPRETERS An interpreter may be a program that
CS370 Operating Systems
 CS370 Operating Systems Colorado State University Yashwant K Malaiya Fall 2016 Lecture 5 Slides based on Text by Silberschatz, Galvin, Gagne Various sources 1 1 User Operating System Interface - CLI CLI
Debugging process. The debugging process can be divided into four main steps: 1. Start your program, specifying anything that might affect its
 Debugging Introduction One of the most widely used methods to find out the reason of a strange behavior in a program is the insertion of printf or write statements in the supposed critical area. However
Where We Are. Lexical Analysis. Syntax Analysis. IR Generation. IR Optimization. Code Generation. Machine Code. Optimization.
 Where We Are Source Code Lexical Analysis Syntax Analysis Semantic Analysis IR Generation IR Optimization Code Generation Optimization Machine Code Where We Are Source Code Lexical Analysis Syntax Analysis
RWTH GPU-Cluster. Sandra Wienke March Rechen- und Kommunikationszentrum (RZ) Fotos: Christian Iwainsky
 Fotos: Christian Iwainsky") RWTH GPU-Cluster Fotos: Christian Iwainsky Sandra Wienke wienke@rz.rwth-aachen.de March 2012 Rechen- und Kommunikationszentrum (RZ) The GPU-Cluster GPU-Cluster: 57 Nvidia Quadro 6000 (29 nodes) innovative
RWTH GPU-Cluster Fotos: Christian Iwainsky Sandra Wienke wienke@rz.rwth-aachen.de March 2012 Rechen- und Kommunikationszentrum (RZ) The GPU-Cluster GPU-Cluster: 57 Nvidia Quadro 6000 (29 nodes) innovative
CSCI0330 Intro Computer Systems Doeppner. Lab 02 - Tools Lab. Due: Sunday, September 23, 2018 at 6:00 PM. 1 Introduction 0.
 CSCI0330 Intro Computer Systems Doeppner Lab 02 - Tools Lab Due: Sunday, September 23, 2018 at 6:00 PM 1 Introduction 0 2 Assignment 0 3 gdb 1 3.1 Setting a Breakpoint 2 3.2 Setting a Watchpoint on Local
DDT User Guide. Version 2.2.1
 DDT User Guide Version 2.2.1 Contents Contents...1 1 Introduction...5 2 Installation and Configuration...6 2.1 Installation...6 2.1.1 Graphical Install...6 2.1.2 Text-mode Install...8 2.1.3 Licence Files...8
Using the Xcode Debugger
 g Using the Xcode Debugger J Objectives In this appendix you ll: Set breakpoints and run a program in the debugger. Use the Continue program execution command to continue execution. Use the Auto window
Profiling and debugging. Carlos Rosales September 18 th 2009 Texas Advanced Computing Center The University of Texas at Austin
 Profiling and debugging Carlos Rosales carlos@tacc.utexas.edu September 18 th 2009 Texas Advanced Computing Center The University of Texas at Austin Outline Debugging Profiling GDB DDT Basic use Attaching
Implementation of Parallelization
 Implementation of Parallelization OpenMP, PThreads and MPI Jascha Schewtschenko Institute of Cosmology and Gravitation, University of Portsmouth May 9, 2018 JAS (ICG, Portsmouth) Implementation of Parallelization
Jackson Marusarz Software Technical Consulting Engineer
 Jackson Marusarz Software Technical Consulting Engineer What Will Be Covered Overview Memory/Thread analysis New Features Deep dive into debugger integrations Demo Call to action 2 Analysis Tools for Diagnosis
Introduction to Parallel Programming. Martin Čuma Center for High Performance Computing University of Utah
 Introduction to Parallel Programming Martin Čuma Center for High Performance Computing University of Utah mcuma@chpc.utah.edu Overview Types of parallel computers. Parallel programming options. How to
Visual Basic Primer A. A. Cousins
 Hard Wiring The first research computers of the late 1940s were programmed by hard wiring. Cables were plugged and unplugged into huge patch boards to physically alter the electrical circuitry. To program
Introduction to Parallel Programming. Martin Čuma Center for High Performance Computing University of Utah
 Introduction to Parallel Programming Martin Čuma Center for High Performance Computing University of Utah mcuma@chpc.utah.edu Overview Types of parallel computers. Parallel programming options. How to
18-600: Recitation #3
 18-600: Recitation #3 Bomb Lab & GDB Overview September 12th, 2017 1 Today X86-64 Overview Bomb Lab Introduction GDB Tutorial 2 3 x86-64: Register Conventions Arguments passed in registers: %rdi, %rsi,