Instytut Fizyki Doświadczalnej Wydział Matematyki, Fizyki i Informatyki UNIWERSYTET GDAŃSKI
|
|
|
- Christiana Todd
- 5 years ago
- Views:
Transcription


1 Instytut Fizyki Doświadczalnej Wydział Matematyki, Fizyki i Informatyki UNIWERSYTET GDAŃSKI
 difference between a spectrograph and a monochromator; b) optical spectrograph; c) dispersive element: grating,")
 CCD camera construction; b) operating principles. 4. Spectral sensitivity characteristics of radiation detectors. 5.")

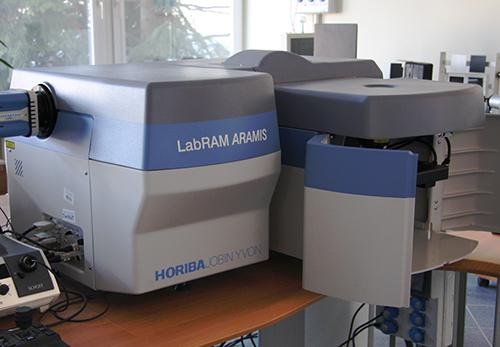
2 I. Background theory. 1. Characteristics of the apparatus: prismatic, grating, interferometers. 2. Operating principles of the spectroscopic apparatus: a) difference between a spectrograph and a monochromator; b) optical spectrograph; c) dispersive element: grating, prism; d) characteristics of spectroscopic instruments: spectral range, resolving power, linear dispersion, luminosity, magnification; e) spectral line width of the apparatus. 3. CCD camera: a) CCD camera construction; b) operating principles. 4. Spectral sensitivity characteristics of radiation detectors. 5. Spectral lines: a) shape and width of spectral lines; b) qualitative and quantitative analysis of a spectrum. 6. Resolution criteria of spectral lines. 7. Photometric quantities. II. Experimental tasks. 1. Refer to the setup shown in Picture 1. Picture 1. View of apparatus for recording linear emission spectra: 1 CCD camera; 2 slits; 3 spectrometer; 4 mercury lamp power supply; 5 computer; 6 mercury lamp; 7 mirrors. Instytut Fizyki Doświadczalnej 1.


; turn on the spectrometer (the switch is on the right-hand side); turn on the mercury lamp( the")

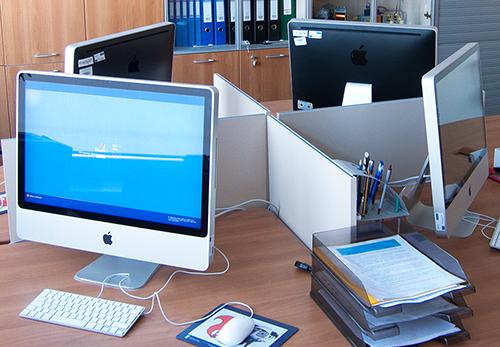
3 2. Turn on the power to each individual component. 1. Before turning on the power, set both slits 2 in Picture 1 to minimum width!!! 2. The number of counts should not exceed Perform the following steps: turn on the power strip for the CCD camera and spectrometer, ensuring that the switch on the camera power supply housing is set to position II; turn on the computer (the switch is on the front cover); turn on the spectrometer (the switch is on the right-hand side); turn on the mercury lamp( the switch is on the back of the power supply); The mercury lamp should be turned on for at least a half hour before starting measurements. 3. Start the program Andor Solis for Spectroscopy by clicking the desktop icon 1, Picture 2. Picture 2. View of the screen after turning on the computer: 1 Andor Solis for Spectroscopy program icon. 4. Before starting measurements, verify that the temperature of the CCD camera shown on indicator 1 in Picture 3 is set to 60 ⁰C. Instytut Fizyki Doświadczalnej 2.

4 5. Set the camera to FVB mode through its menu: Acquisition, Setup Acquisition, Setup CCD, Readout Mode 16,25 μs and scanning speed Readout Pixel Shift set to 100 khz AT 16 bit. 6. Based on II.5., calculate the CCD camera s effective working time. 7. Record the spectrum of the lamp as a function of exposure time using the instructions in steps II.8. II Specify the method of data collection using the menu: Acquisition, Setup Data Type or pressing Ctrl+D. When recording the spectra, set the camera to correct for the background signal Counts (Background corrected). 9. For the shortest exposure time, set the minimal width of the slits 2, Picture 1, such that the number of counts does not exceed Use the diffraction grating rotor 6, Picture 3 to choose a single grating, and then use slider 3, Picture 3 to set the spectral range. For the mercury lamp, choose a grating with 1200 lines/mm and a spectral range centred at 580 nm. Picture 3. View of the CCD camera and spectrometer control software: 1 CCD camera temperature indicator (red camera has not yet attained desired temperature, blue camera has reached the desired temperature); 2 CCD camera temperature control dialogue found in Hardware in the main menu; 3 slider showing selected spectral range, 4 Detector and Grating tab for entering a relative offset between the detector and diffraction grating; 5 - toolbar; 6 diffraction grating selection; 7 CCD camera mode selection and results display. 11. Cover the spectrometer entrance slit and record a background signal by pressing Ctrl+B or through the menu: Acquisition, Take Background. Instytut Fizyki Doświadczalnej 3.


5 12. Record and save the spectrum for 11 different exposure times: 10 µs, 50 µs, 100 µs, 500 µs, 1 ms, 5 ms, 10 ms, 50 ms, 1 ms, 500 ms, 1 s. All recorded spectra must be taken with the same spectral range. Create a plot of intensity as a function of exposure time. 13. In order to work further with the recorded spectra, save them in ASCII format using the menu: File, Export as ASCII, Signal or Background, Reference, Lamp Calibration. Remember that the background signal will increase with increased exposure time and gap width. Each time you change these two parameters, you must take a new measurement of the background signal. 14. Estimate the effective working time of the CCD camera and compared with the value calculated. 15. Record the spectrum of mercury lamp as a function of the width of the spectrometer s input slit ranging from 0,05 do 1,5 mm following steps II.16. II Set the camera s exposure time to more or less the effective time. 17. Set both slits to minimum 2 in Picture 1 and use slider 3, Picture 3 to specify the spectral range. 18. Record and save 12 spectra as a function of slit width ranging from 0,05 to 1,5 mm. 19. Compile your measurements into a graph of the type: I = I₀ r + B, where I₀ - initial intensity, r slit width, B constant associated with the background signal. 20. Check the Rayleigh resolution criterion for the two emission lines by following steps II.21. II Set the camera s exposure time to more or less the effective time. 22. Using the diffraction grating selection icon 6, Picture 3, select a grating with 1200 lines/mm. 23. Use slider 3, Picture 3 to set the spectral range centred on 580 nm. 24. Set the both slit widths 2 in Picture 1 to minimum. 25. Record and save 12 spectra as a function of slit width ranging from 0,05 to 1,5 mm. 26. Adjust the Lorentz curve for your recorded spectra. 27. Determine the Rayleigh criterion for the two selected spectral lines. 28. Record the emission spectra for two diffraction gratings: 100 lines/mm and 1200 lines/mm using the option to scale the spectra by following steps II.29. II Using the diffraction grating selection icon 6, Picture 3, select the grating with 100 lines/mm. 30. Set the same range for both grids e.g.: ranging from 400 to 700 nm. 31. Record and save the spectrum for the grating with 100 lines/mm. 32. Using the diffraction grating selection icon 6, Picture 3, select the grating with 1200 lines/mm. 33. Stitch the two spectra together using the menu: Acquisition, Setup Acquisition, Step n Glue 1, Picture 4. Select the range and degree of overlap of the spectra. Instytut Fizyki Doświadczalnej 4.

6 Picture 4. CCD camera and spectrometer software menu showing spectrum stitching: 1 wavelength range selection. 34. Record and save the spectrum for the grating with 1200 lines/mm. 35. Compare the measurements for the two diffraction gratings in steps II.31. and II.34. III. Apparatus. 1. Andor Shamrock spectrometer, model SR-500i. 2. Andor CCD camera, model idus Mercury lamp. 4. Mercury lamp power supply. 5. Adjustable slit. 6. Mirrors. 7. Computer. IV. Literature. 1. J.H. Moore, C.C. Davies, M.A. Coplan Building Scientific Apparatus, Westview Press, A.P. Arya Fundamentals of Atomic Physics, Allyn & Bacon, Inc., Boston W. Demtröder Laser Spectroscopy. Basic Concepts and Instrumentation, Springer, S.P. Davies Diffraction Grating Spectrographs, Winston, N.Y P. Bousquet Spectroscopy and its Instrumentation, A. Hilger, London A.P. Thorne Spectrophysics, Chapman and Hall Science Paperbacks, London F. Mayinger, O. Feldmann Optical Measurements, Springer, Instytut Fizyki Doświadczalnej 5.
Astronomical spectrographs. ASTR320 Wednesday February 20, 2019
 Astronomical spectrographs ASTR320 Wednesday February 20, 2019 Spectrographs A spectrograph is an instrument used to form a spectrum of an object Much higher spectral resolutions than possible with multiband
Standard Operating Procedure for the Horiba FluroMax-4
 Standard Operating Procedure for the Horiba FluroMax-4 Adapted from Horiba Operations Manual Created by Michael Delcau, Modified by Brian Lamp The Fluoromax is capable of making a variety of measurements.
Optics Vac Work MT 2008
 Optics Vac Work MT 2008 1. Explain what is meant by the Fraunhofer condition for diffraction. [4] An aperture lies in the plane z = 0 and has amplitude transmission function T(y) independent of x. It is
Introduction to Raman spectroscopy measurement data processing using Igor Pro
 Introduction to Raman spectroscopy measurement data processing using Igor Pro This introduction is intended to minimally guide beginners to processing Raman spectroscopy measurement data, which includes
195 mm Focal Length, nm, Echelle Spectrograph. Specifications. Wavelength range (nm) Focal length (mm) 195.
 Focal length (mm) 195.") Hg-Ar spectrum Acquired with Mechelle 5000, 104 x 104 pixel Gen Andor istar and 10 µm slit width Spectroscopy Features and Benefits Compact and robust design with no moving components Ideal for non-lab
Hg-Ar spectrum Acquired with Mechelle 5000, 104 x 104 pixel Gen Andor istar and 10 µm slit width Spectroscopy Features and Benefits Compact and robust design with no moving components Ideal for non-lab
MonoVista CRS+ Raman Microscopes
 MonoVista CRS+ Benefits Deep UV to NIR wavelength range Up to 4 integrated multi-line lasers plus port for large external lasers Dual beam path for UV and VIS/NIR Motorized Laser selection Auto Alignment
Control of Light. Emmett Ientilucci Digital Imaging and Remote Sensing Laboratory Chester F. Carlson Center for Imaging Science 8 May 2007
 Control of Light Emmett Ientilucci Digital Imaging and Remote Sensing Laboratory Chester F. Carlson Center for Imaging Science 8 May 007 Spectro-radiometry Spectral Considerations Chromatic dispersion
Spectrograph overview:
 High performance measurement systems Monochromator Family Gilden Photonics offers a range of integrated optical wavelength solutions in customized designs, OEM design, manufacturing and value added resell
IMAGING SPECTROMETER DATA CORRECTION
 S E S 2 0 0 5 Scientific Conference SPACE, ECOLOGY, SAFETY with International Participation 10 13 June 2005, Varna, Bulgaria IMAGING SPECTROMETER DATA CORRECTION Valentin Atanassov, Georgi Jelev, Lubomira
Vision Based Metal Spectral Analysis using
 1/27 Vision Based Metal Spectral Analysis using Eranga Ukwatta Department of Electrical and Computer Engineering The University of Western Ontario May 25, 2009 2/27 Outline 1 Overview of Element Spectroscopy
Final Exam and End Material Test Friday, May 12, 10:00-12:00
 Final Exam and End Material Test Friday, May 12, 10:00-12:00 Test rooms: Instructor Sections Room Dr. Hale F, H 104 Physics Dr. Kurter B, N 125 BCH Dr. Madison K, M B-10 Bertelsmeyer Dr. Parris J St. Pats
Interference of Light
 Interference of Light Young s Double-Slit Experiment If light is a wave, interference effects will be seen, where one part of wavefront can interact with another part. One way to study this is to do a
Confocal Raman Systems SPECTROSCOPY GROUP
 Confocal Raman Systems SPECTROSCOPY GROUP MonoVista CRS Configuration Option PIXIS TE-Cooled CCD Camera Acton Spectrograph Micro-Raman Interface Witness Camera Optional Laser Micro/Macro Transfer Optics
Optics. Dispersion and resolving power of the prism and grating spectroscope Geometrical Optics. What you need:
 Geometrical Optics Optics What you can learn about Maxwell relationship Dispersion Polarizability Refractive index Prism Rowland grating Spectrometer-goniometer Principle: The refractive indices of liquids,
Simple Spectrograph. grating. slit. camera lens. collimator. primary
 Simple Spectrograph slit grating camera lens collimator primary Notes: 1) For ease of sketching, this shows a transmissive system (refracting telescope, transmission grating). Most telescopes use a reflecting
FLEX 2 NEW. Key points. 3D Confocal Raman, 2 lasers, fiber based, AFM combined
 FLEX 2 3D Confocal Raman, 2 lasers, fiber based, AFM combined NEW Key points Compact size 2 lasers, easily switchable 2 confocal operation modes, easily switchable : High Spatial Resolution 35 nm High
Renishaw invia Raman Microscope (April 2006)
") Renishaw invia Raman Microscope (April 2006) I. Starting the System 1. The main system unit is ON all the time. 2. Switch on the Leica microscope and light source for reflective bright field (BF) imaging.
Renishaw invia Raman Microscope (April 2006) I. Starting the System 1. The main system unit is ON all the time. 2. Switch on the Leica microscope and light source for reflective bright field (BF) imaging.
X-Ray fluorescence and Raman spectroscopy
 X-Ray fluorescence and Raman spectroscopy Advanced physics laboratory (nd part) 4CFU Catalini Letizia, De Angelis Giulia Vittoria, Piselli Verdiana Abstract In this paper we report about two different
Introduction: Experiment 1: Wave Properties of Light
 Natural Order Properties of Light Lab Introduction: In this lab we will explore the wave and particle nature of light. In the first experiment we will measure the diffraction pattern of light as it passes
Spectrometers: Monochromators / Slits
 Spectrometers: Monochromators / Slits Monochromator Characteristics Dispersion: The separation, or wavelength selectivity, of a monochromator is dependent on its dispersion. Angular Dispersion: The change
L. Pina, A. Fojtik, R. Havlikova, A. Jancarek, S.Palinek, M. Vrbova
 L. Pina, A. Fojtik, R. Havlikova, A. Jancarek, S.Palinek, M. Vrbova Faculty of Nuclear Sciences, Czech Technical University, Brehova 7, 115 19 Prague, Czech Republic CD EXPERIMENTAL ARRANGEMENT SPECTRAL
Operating Procedure for Horiba Raman Microscope
 Operating Procedure for Horiba Raman Microscope SAFETY Be aware of Laser radiation at all times! Do not remove the covers of the instrument. Components are supplied with 110V electric source. Do not touch
Wat is licht, wat is meten? Belgisch Perspectief! Spectraal of niet-spectraal meten: that s the question
 Wat is licht, wat is meten? Belgisch Perspectief! Spectraal of niet-spectraal meten: that s the question IGOV kenniscafé Arnhem, 31 oktober 2013 Peter Hanselaer Light&Lighting Laboratory Introduction Spectral
Acton Research SpectruMM TM Complete Spectroscopic- Acquisition Systems
 Acton Research SpectruMM TM Complete Spectroscopic- Acquisition Systems A fully integrated spectroscopy lab is as easy as 1, 2, 3... 1. High-Resolution CCD Detectors 2. Industry-Standard Acton Research
Specifications. Wavelength range (nm) Focal length (mm) 195. Aperture F/7. Spectral resolution (λ/ λ) 1 (corresponding to 3 pixels FWHM)
 Focal length (mm) 195. Aperture F/7. Spectral resolution (λ/ λ) 1 (corresponding to 3 pixels FWHM)") Spectroscopy Hg-Ar spectrum Acquired with Mechelle 5000, 1024 x 1024 pixel Gen 2 Andor istar and 10 µm slit width Features and Benefits Compact and robust design with no moving components Ideal for non-lab
Spectroscopy Hg-Ar spectrum Acquired with Mechelle 5000, 1024 x 1024 pixel Gen 2 Andor istar and 10 µm slit width Features and Benefits Compact and robust design with no moving components Ideal for non-lab
Models of Light The wave model: The ray model: The photon model:
 Models of Light The wave model: under many circumstances, light exhibits the same behavior as sound or water waves. The study of light as a wave is called wave optics. The ray model: The properties of
Acton Research Corporation SpectraPro Monochromator Control Software for Windows
 530 Main Street, Acton, MA 01720 Phone: (978)263-3584, Fax: (978)263-5086 Web Site: www.acton-research.com Acton Research Corporation SpectraPro Monochromator Control Software for Windows Ver 2.0 2 Contents
Chemistry Instrumental Analysis Lecture 6. Chem 4631
 Chemistry 4631 Instrumental Analysis Lecture 6 UV to IR Components of Optical Basic components of spectroscopic instruments: stable source of radiant energy transparent container to hold sample device
Interference of Light
 Interference of Light Review: Principle of Superposition When two or more waves interact they interfere. Wave interference is governed by the principle of superposition. The superposition principle says
High-Accuracy LIBS with Nanosecond and Picosecond Time Resolution Enabled by Ultrasensitive emiccd Technology
 2015 Princeton Instruments, Inc. All rights reserved. High-Accuracy LIBS with Nanosecond and Picosecond Time Resolution Enabled by Ultrasensitive emiccd Technology The PI-MAX4:1024EMB emiccd camera seamlessly
UHD 185 FAQs. Optical System
 UHD 185 FAQs System Setup How is a typical setup of the UHD 185? Is a wireless control during flight possible? How do I trigger the image acquisition? What is the power consumption? What are the specs
Raman Lab - Laser 1 operation
 Raman Lab - Laser 1 operation Cover limit switches cooling water supply optimate panel light control laser remote control sample stage Remote Shutter Control laser power supply WARNING! Never ever try
AP* Optics Free Response Questions
 AP* Optics Free Response Questions 1978 Q5 MIRRORS An object 6 centimeters high is placed 30 centimeters from a concave mirror of focal length 10 centimeters as shown above. (a) On the diagram above, locate
Raman Spectrometer Installation Manual
 RI Raman Spectrometer Instruction Manual Application software (included in standard configuration) Connection RI RAMAN is recognized by Windows operational system as standard HID device. That is why there
Spectroscopic equipment. Multispectral Imaging
 Spectroscopic equipment Multispectral Imaging Basic spectroscopic arrangement Source Sample Analyzer Detector Sun Lamps Lasers LEDs Synchrotron Plants Forests Tissue Cells Flames Chemical compounds etc.
Lecture PowerPoints. Chapter 24 Physics: Principles with Applications, 7 th edition Giancoli
 Lecture PowerPoints Chapter 24 Physics: Principles with Applications, 7 th edition Giancoli This work is protected by United States copyright laws and is provided solely for the use of instructors in teaching
QUANTAX EDS SYSTEM SOP
 QUANTAX EDS SYSTEM SOP December 2017 Energy-Dispersive X-Ray Spectroscopy (EDS, EDX, EDXS or XEDS), is an analytical technique used for the elemental analysis or chemical characterization of a sample.
Spectrographs. C. A. Griffith, Class Notes, PTYS 521, 2016 Not for distribution.
 Spectrographs C A Griffith, Class Notes, PTYS 521, 2016 Not for distribution 1 Spectrographs and their characteristics A spectrograph is an instrument that disperses light into a frequency spectrum, which
Interference. Electric fields from two different sources at a single location add together. The same is true for magnetic fields at a single location.
 Interference Electric fields from two different sources at a single location add together. The same is true for magnetic fields at a single location. Thus, interacting electromagnetic waves also add together.
WITec Raman Spectroscopy Solutions
 Confocal Raman Imaging WITec Raman Spectroscopy Solutions -40-20 0 20 CCD cts 500 1000 1500 2000 2500 3000 3000 relative wavenumbers (cm -1 ) www.witec.de WITec UHTS Ultra-High Throughput Spectrometers
AP Physics Problems -- Waves and Light
 AP Physics Problems -- Waves and Light 1. 1975-4 (Physical Optics) a. Light of a single wavelength is incident on a single slit of width w. (w is a few wavelengths.) Sketch a graph of the intensity as
ihr Series horiba.com/osd Research Grade Spectrometers Simply the best imaging spectrometers with no compromise
 ihr Series Research Grade Spectrometers Simply the best imaging spectrometers with no compromise horiba.com/osd Unmatched Flexibility in Applications HORIBA Scientific s Optical Spectroscopy Division
Development of Ultrafast CXRS system in Heliotron J. Graduate School of Energy Science Kyoto University LU XIANGXUN 03/15/2016
 1 Development of Ultrafast CXRS system in Heliotron J Graduate School of Energy Science Kyoto University LU XIANGXUN 03/15/2016 2 Outline 1. Introduction 2. Charge exchange Recombination Spectroscopy (CXRS)
Overview. Etalon-Based FSRS Setup APPLICATION NOTE
 2016 Princeton Instruments, Inc. All rights reserved. Advanced CCD Cameras and Imaging Spectrographs Facilitate Acquisition of Novel Femtosecond Stimulated Raman Spectroscopy Data To Improve SERS Biosensors
Fluorimeter User s Booklet
 Fluorimeter User s Booklet 1) Verify that the instrument power and the computer are both off. Then turn on the lamp. The red indicator light will glow when the lamp is on. Turn on lamp switch here. This
Imaging Spectrometers
 JOBIN YVON Imaging Spectrometers ihr Series Uniquely shaped for uniquely superior performance. ihr Series Imaging Spectrometers A Unique Shape for a Unique Spectrometer The difference between ihr spectrometers
PH 222-3A Fall Diffraction Lectures Chapter 36 (Halliday/Resnick/Walker, Fundamentals of Physics 8 th edition)
") PH 222-3A Fall 2012 Diffraction Lectures 28-29 Chapter 36 (Halliday/Resnick/Walker, Fundamentals of Physics 8 th edition) 1 Chapter 36 Diffraction In Chapter 35, we saw how light beams passing through
PH 222-3A Fall 2012 Diffraction Lectures 28-29 Chapter 36 (Halliday/Resnick/Walker, Fundamentals of Physics 8 th edition) 1 Chapter 36 Diffraction In Chapter 35, we saw how light beams passing through
Wallace Hall Academy
 Wallace Hall Academy CfE Higher Physics Unit 2 - Waves Notes Name 1 Waves Revision You will remember the following equations related to Waves from National 5. d = vt f = n/t v = f T=1/f They form an integral
Lenses lens equation (for a thin lens) = (η η ) f r 1 r 2
 = (η η ) f r 1 r 2") Lenses lens equation (for a thin lens) 1 1 1 ---- = (η η ) ------ - ------ f r 1 r 2 Where object o f = focal length η = refractive index of lens material η = refractive index of adjacent material r 1
Lenses lens equation (for a thin lens) 1 1 1 ---- = (η η ) ------ - ------ f r 1 r 2 Where object o f = focal length η = refractive index of lens material η = refractive index of adjacent material r 1
Shamrock 303i. Resolution with Newton DU940 CCD nm nm. Aperture F/4
 New photograph required Spectroscopy Features and Benefits Pre-aligned, pre-calibrated detector & spectrograph Motorized, individually factory-calibrated systems out-of-the-box operation and seamless integration
Using Adjustable Slits to Reduce Interfering Element Effects
 Prodigy ICP Technical Note Using Adjustable Slits to Reduce Interfering Element Effects INTRODUCTION The Inductively Coupled Plasma (ICP) is one of the most widely used emission sources for routine trace
LECTURE 14 PHASORS & GRATINGS. Instructor: Kazumi Tolich
 LECTURE 14 PHASORS & GRATINGS Instructor: Kazumi Tolich Lecture 14 2 Reading chapter 33-5 & 33-8 Phasors n Addition of two harmonic waves n Interference pattern from multiple sources n Single slit diffraction
Minimizes reflection losses from UV - IR; Optional AR coatings & wedge windows are available.
 Now Powered by LightField PyLoN:100 1340 x 100 The PyLoN :100 is a controllerless, cryogenically-cooled CCD camera designed for quantitative scientific spectroscopy applications demanding the highest possible
Chapter 36. Diffraction. Copyright 2014 John Wiley & Sons, Inc. All rights reserved.
 Chapter 36 Diffraction Copyright 36-1 Single-Slit Diffraction Learning Objectives 36.01 Describe the diffraction of light waves by a narrow opening and an edge, and also describe the resulting interference
Chapter 36 Diffraction
 Chapter 36 Diffraction In Chapter 35, we saw how light beams passing through different slits can interfere with each other and how a beam after passing through a single slit flares diffracts in Young's
Manual Diffraction. Manual remote experiment Project e-xperimenteren+ J. Snellenburg, J.M.Mulder
 Manual remote experiment Project e-xperimenteren+ J. Snellenburg, J.M.Mulder 30-01-006 Colofon Manual diffraction Manual remote experiment Project e-xperimenteren+ Stichting Digitale Universiteit Oudenoord
LED Evenement 2014 Spectroscopy - Straylight. Avantes BV Apeldoorn, The Netherlands
 LED Evenement 2014 Spectroscopy - Straylight Avantes BV Apeldoorn, The Netherlands Content: - Company - Spectroscopy - Spectrometer measuring light - Straylight - How to prevent - Why - conclusion Introduction
Section V: AD Series Detection Systems
 Section V: AD Series AD110B 0B Photobyte - P System AD131 Photodetector Module Cooled CCD Cameras AD202 AD205 AD206 Kestr estralspec Softwar are Data Acquisition 57 AD110B Photob obyte - P Photomultiplier
Introduction to Diffraction Gratings
 Introduction to Diffraction Diffraction (Ruled and Holographic) Diffraction gratings can be divided into two basic categories: holographic and ruled. A ruled grating is produced by physically forming grooves
NIRvana: 640ST. Applications: Nanotube fluorescence, emission, absorption, non-destructive testing and singlet oxygen detection
 Powered by LightField The NIRvana: 64ST from Princeton Instruments is the world s first scientific grade, deep-cooled, large format InGaAs camera for low-light scientific SWIR imaging and spectroscopy
1.1 The HeNe and Fourier Lab CCD Camera
 Chapter 1 CCD Camera Operation 1.1 The HeNe and Fourier Lab CCD Camera For several experiments in this course you will use the CCD cameras to capture images or movies. Make sure to copy all files to your
Indiana Center for Biological Microscopy. BioRad MRC 1024 MP Confocal & Multi-Photon Microscope
 Indiana Center for Biological Microscopy BioRad MRC 1024 MP Confocal & Multi-Photon Microscope Microscope and the Attached Accessories A: B: C: D: E: F: G: H: Mercury Lamp Transmission Light Kr/Ar Laser
Easy integration into complex experimental setup
 NIRvana: 64ST The NIRvana: 64ST from Princeton Instruments is the world s first scientific grade, deep-cooled, large format InGaAs camera for low-light scientific SWIR imaging and spectroscopy applications.
ProEM -HS:1KBX3-10µm
 The ProEM-HS:1KBX3-1µm is the fastest EMCCD camera on the market utilizing the latest low-noise readout electronics and a 124 x 124 EMCCD. This camera delivers single photon sensitivity and the best fringe
ProEM -HS:1024BX3 FEATURES BENEFITS
 ProEM -HS:124BX3 The ProEM-HS: 124BX3 is the most advanced EMCCD camera on the market utilizing the latest low-noise readout electronics and a 124 x 124 EMCCD. This camera delivers single photon sensitivity
Spectroscopy techniques II. Danny Steeghs
 Spectroscopy techniques II Danny Steeghs Conducting long-slit spectroscopy Science goals must come first, what are the resolution and S/N requirements? Is there a restriction on exposure time? Decide on
Radiance, Irradiance and Reflectance
 CEE 6100 Remote Sensing Fundamentals 1 Radiance, Irradiance and Reflectance When making field optical measurements we are generally interested in reflectance, a relative measurement. At a minimum, measurements
CHAPTER 26 INTERFERENCE AND DIFFRACTION
 CHAPTER 26 INTERFERENCE AND DIFFRACTION INTERFERENCE CONSTRUCTIVE DESTRUCTIVE YOUNG S EXPERIMENT THIN FILMS NEWTON S RINGS DIFFRACTION SINGLE SLIT MULTIPLE SLITS RESOLVING POWER 1 IN PHASE 180 0 OUT OF
Tutorial: Instantaneous Measurement of M 2 Beam Propagation Ratio in Real-Time
 Tutorial: Instantaneous Measurement of M 2 Beam Propagation Ratio in Real-Time By Allen M. Cary, Jeffrey L. Guttman, Razvan Chirita, Derrick W. Peterman, Photon Inc A new instrument design allows the M
(Fiber-optic Reosc Echelle Spectrograph of Catania Observatory)
") (Fiber-optic Reosc Echelle Spectrograph of Catania Observatory) The echelle spectrograph delivered by REOSC (France), was designed to work at the F/15 cassegrain focus of the 91-cm telescope. The spectrograph
(Fiber-optic Reosc Echelle Spectrograph of Catania Observatory) The echelle spectrograph delivered by REOSC (France), was designed to work at the F/15 cassegrain focus of the 91-cm telescope. The spectrograph
Optical properties and characterization
 Optical properties and characterization Name Picture Description Site Responsible 1 Laser Nd:YAG MAPLE (Matrix Assisted Pulsed Laser Evaporation) system for biomaterials and polymeric thin film deposition
Series Spectrometers PARTICLE CHARACTERIZATION ELEMENTAL ANALYSIS FLUORESCENCE GRATINGS & OEM SPECTROMETERS OPTICAL COMPONENTS RAMAN
 Series Spectrometers ELEMENTAL ANALYSIS FLUORESCENCE GRATINGS & OEM SPECTROMETERS OPTICAL COMPONENTS PARTICLE CHARACTERIZATION RAMAN SPECTROSCOPIC ELLIPSOMETRY SPR IMAGING ihr Series Imaging Spectrometers
Physics 2c Lecture 25. Chapter 37 Interference & Diffraction
 Physics 2c Lecture 25 Chapter 37 Interference & Diffraction Outlook for rest of quarter Today: finish chapter 37 Tomorrow & Friday: E&M waves (Chapter 34) Next Monday, June 4 th : Quiz 8 on Chapter 37
Confocal Raman Imaging with WITec Sensitivity - Resolution - Speed. Always - Provable - Routinely
 Confocal Raman Imaging with WITec Sensitivity - Resolution - Speed Always - Provable - Routinely WITec GmbH, Ulm, Germany, info@witec.de, www.witec.de A modular microscope series An Example: FLIM optical
Lecture 4 Recap of PHYS110-1 lecture Physical Optics - 4 lectures EM spectrum and colour Light sources Interference and diffraction Polarization
 Lecture 4 Recap of PHYS110-1 lecture Physical Optics - 4 lectures EM spectrum and colour Light sources Interference and diffraction Polarization Lens Aberrations - 3 lectures Spherical aberrations Coma,
Dr. Quantum. General Physics 2 Light as a Wave 1
 Dr. Quantum General Physics 2 Light as a Wave 1 The Nature of Light When studying geometric optics, we used a ray model to describe the behavior of light. A wave model of light is necessary to describe
Diffraction Diffraction occurs when light waves is passed by an aperture/edge Huygen's Principal: each point on wavefront acts as source of another
 Diffraction Diffraction occurs when light waves is passed by an aperture/edge Huygen's Principal: each point on wavefront acts as source of another circular wave Consider light from point source at infinity
LLA Instruments GmbH. Multiplexed Near-Infrared-Spectrometer KUSTA 4004M. Product description
 LLA Instruments GmbH Multiplexed Near-Infrared-Spectrometer KUSTA 4004M Product description General information KUSTA 4004 series The Near- Infrared Spectrometer, in short NIR-Spectrometer, KUSTA 4004
Southern African Large Telescope. PFIS Distortion and Alignment Model
 Southern African Large Telescope PFIS Distortion and Alignment Model Kenneth Nordsieck University of Wisconsin Document Number: SALT-3120AS0023 Revision 2.0 31 May 2006 Change History Rev Date Description
Dr. Larry J. Paxton Johns Hopkins University Applied Physics Laboratory Laurel, MD (301) (301) fax
 (301) fax") Dr. Larry J. Paxton Johns Hopkins University Applied Physics Laboratory Laurel, MD 20723 (301) 953-6871 (301) 953-6670 fax Understand the instrument. Be able to convert measured counts/pixel on-orbit into
Dr. Larry J. Paxton Johns Hopkins University Applied Physics Laboratory Laurel, MD 20723 (301) 953-6871 (301) 953-6670 fax Understand the instrument. Be able to convert measured counts/pixel on-orbit into
Chemical Characterization of Diverse Pharmaceutical Samples by Confocal Raman Microscopy
 Whitepaper Chemical Characterization of Diverse Pharmaceutical Samples by Confocal Raman Microscopy WITec GmbH, Lise-Meitner-Str. 6, 89081 Ulm, Germany, www.witec.de Introduction The development and production
Physics 214 Midterm Fall 2003 Form A
 1. A ray of light is incident at the center of the flat circular surface of a hemispherical glass object as shown in the figure. The refracted ray A. emerges from the glass bent at an angle θ 2 with respect
EMBED2000+ Data Sheet
 EMBED2000+ Data Sheet Description The Ocean Optics EMBED2000+ Spectrometer includes the linear CCD-array optical bench, plus all the circuits necessary to operate the array and convert to a digital signal.
Physical Optics. You can observe a lot just by watching. Yogi Berra ( )
") Physical Optics You can observe a lot just by watching. Yogi Berra (1925-2015) OBJECTIVES To observe some interference and diffraction phenomena with visible light. THEORY In a previous experiment you
Physical Optics You can observe a lot just by watching. Yogi Berra (1925-2015) OBJECTIVES To observe some interference and diffraction phenomena with visible light. THEORY In a previous experiment you
Versatile laser Raman Spectrometer. RMP-500 series
 Versatile laser Raman Spectrometer RMP-500 series About RMP-500 RMP-500 series is a compact and versatile laser Raman spectrometer consisting of a micro Raman probe connected through fiber optics to the
Spectrometer Measurement Setup Instructions
 Spectrometer Measurement Setup Instructions 1. Double click the Start Lightfield button on the MALIBU Desktop. It will start an instance of the light field software and connect to the EPICS control window.
430g Dimensions. 102mm x 84mm x 59mm Detector nm Pixels 3648 Pixel size. 8μm x 200μm Pixel well depth
 Weigth 430g Dimensions 102mm x 84mm x 59mm Detector Toshiba TCD1304DG linear array Detector range 200-1200nm Pixels 3648 Pixel size 8μm x 200μm Pixel well depth 100,000 electrons Signal-to-noise ratio
SPECTROMETERS USER MANUAL. Ver. 1.2_09/16. Making spectroscopy brighter
 SPECTROMETERS USER MANUAL Making spectroscopy brighter 1 Table of contents 1. General Safety Rules... 2 2. Items Supplied... 2 3. Introduction... 3 4. Installation and Operation... 4 4.1. Notes... 7 5.
Analysis of Cornell Electron-Positron Storage Ring Test Accelerator's Double Slit Visual Beam Size Monitor
 Analysis of Cornell Electron-Positron Storage Ring Test Accelerator's Double Slit Visual Beam Size Monitor Senior Project Department of Physics California Polytechnic State University San Luis Obispo By:
Reprint (R30) Accurate Chromaticity Measurements of Lighting Components. Reprinted with permission from Craig J. Coley The Communications Repair depot
 Accurate Chromaticity Measurements of Lighting Components. Reprinted with permission from Craig J. Coley The Communications Repair depot") Reprint (R30) Accurate Chromaticity Measurements of Lighting Components Reprinted with permission from Craig J. Coley The Communications Repair depot June 2006 Gooch & Housego 4632 36 th Street, Orlando,
Reprint (R30) Accurate Chromaticity Measurements of Lighting Components Reprinted with permission from Craig J. Coley The Communications Repair depot June 2006 Gooch & Housego 4632 36 th Street, Orlando,
Throughput of an Optical Instrument II: Physical measurements, Source, Optics. Q4- Number of 500 nm photons per second generated at source
 Throughput of an Optical Instrument II: Physical measurements, Source, Optics Question- Value Q1- Percent output between 450-550 nm by mass Answer (w/ units) Q2- Energy in J of a 500 nm photon Q3- Flux
ICP-OES. By: Dr. Sarhan A. Salman
 ICP-OES By: Dr. Sarhan A. Salman AGENDA -- ICP-OES Overview - Module removal Optical components and gas control overview Module replacement --Continue module replacement Manual optical alignment --Precise
VERY LARGE TELESCOPE 3D Visualization Tool Cookbook
 European Organisation for Astronomical Research in the Southern Hemisphere VERY LARGE TELESCOPE 3D Visualization Tool Cookbook VLT-SPE-ESO-19500-5652 Issue 1.0 10 July 2012 Prepared: Mark Westmoquette
LS-785 High Throughput Lens Spectrograph User Manual
 15 Discovery Way, Acton, MA 01720 Phone: (978)263-3584, Fax: (978)263-5086 Web Site: www.piacton.com LS-785 High Throughput Lens Spectrograph User Manual Ver. 1.2 Table of Contents Chapter 1 -- General...5
NIRSpec Technical Note NTN / ESA-JWST-TN Author(s): G. Giardino Date of Issue: November 11, 2013 Version: 1.0
: G. Giardino Date of Issue: November 11, 2013 Version: 1.0") NIRSpec Technical Note NTN-013-011/ ESA-JWST-TN-093 Author(s): G. Giardino Date of Issue: November 11, 013 Version: 1.0 estec European Space Research and Technology Centre Keplerlaan 1 01 AZ Noordwijk
NIRSpec Technical Note NTN-013-011/ ESA-JWST-TN-093 Author(s): G. Giardino Date of Issue: November 11, 013 Version: 1.0 estec European Space Research and Technology Centre Keplerlaan 1 01 AZ Noordwijk
ENHANCEMENT OF DIFFUSERS BRDF ACCURACY
 ENHANCEMENT OF DIFFUSERS BRDF ACCURACY Grégory Bazalgette Courrèges-Lacoste (1), Hedser van Brug (1) and Gerard Otter (1) (1) TNO Science and Industry, Opto-Mechanical Instrumentation Space, P.O.Box 155,
PyLoN: Applications: Astronomy, Chemiluminescence, Bioluminescence, Phosphor Imaging, Ultra-low light Imaging and Spectroscopy.
 Now Powered by LightField PyLoN: 2048 2048 x 2048 The PyLoN: 2048 is a controllerless, cryogenically-cooled CCD camera designed for quantitative scientific imaging applications demanding the highest possible
BWSpec 4 Software User Manual. 19 Shea Way, Newark, DE Tel: (302) Fax: (302) Web:
 Fax: (302) Web:") BWSpec 4 Software User Manual 290020235-G (09/16/2015) Copyright 2015 B&W Tek, Inc. Table of Contents 1 Introduction 1 2 Installation 1 2.1 Supported Operating Systems 1 2.2 Minimum System Requirements
BWSpec 4 Software User Manual 290020235-G (09/16/2015) Copyright 2015 B&W Tek, Inc. Table of Contents 1 Introduction 1 2 Installation 1 2.1 Supported Operating Systems 1 2.2 Minimum System Requirements
Confocal Raman Microscope RAMOS
 Confocal Raman Microscope RAMOS 1 future`s Confocal Raman Microscope RAMOS 2 Confocal Raman Microscope RAMOS Ostec Corporate Group produces and offers hi-tech innovative scientific and analytical equipment.
Chapter 2: Wave Optics
 Chapter : Wave Optics P-1. We can write a plane wave with the z axis taken in the direction of the wave vector k as u(,) r t Acos tkzarg( A) As c /, T 1/ and k / we can rewrite the plane wave as t z u(,)