2
|
|
|
- Amber Lambert
- 6 years ago
- Views:
Transcription
1 1
2 2
3 3
4 4
5 5
6 6
7 For more information, see 7
8 8

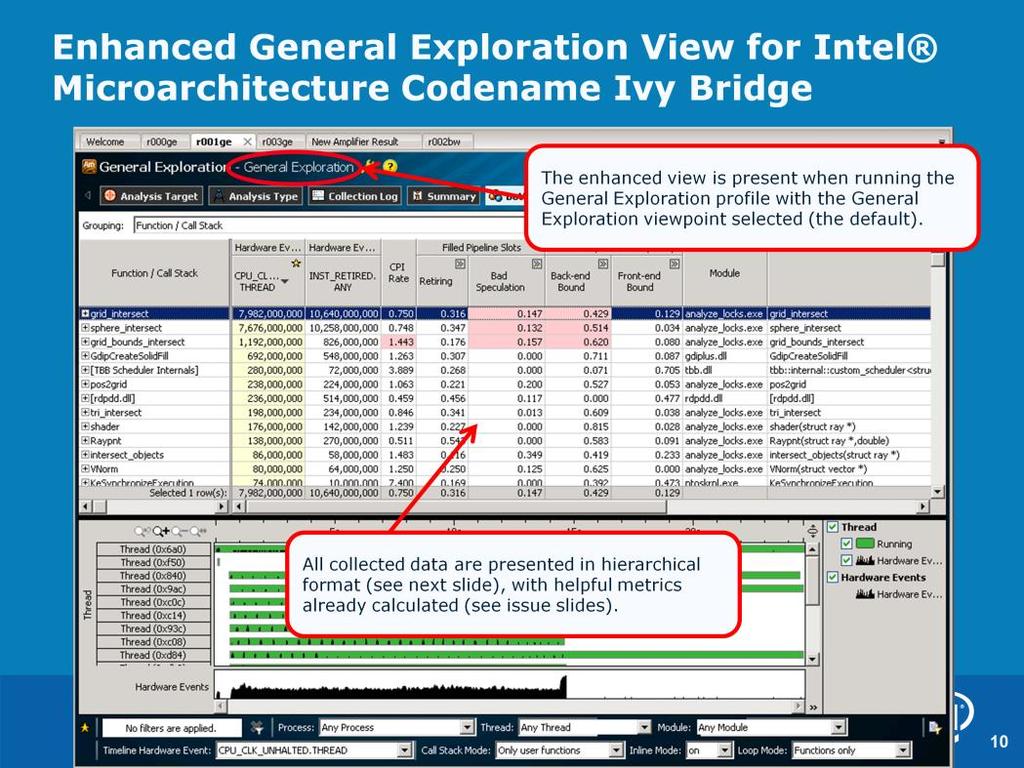
9 The logic for identifying issues on Intel Microarchitecture Codename Ivy Bridge is embedded into the interface. All the formulas and metrics used are the same as the ones given in this guide. You no longer have to apply formulas and rules to the data yourself to figure out what it means using this guide and the interface tuning features, you can easily pinpoint problems and possible solutions. The formulas and metrics are only applied to the General Exploration profile, and the General Exploration viewpoint (which is automatic). For the other profiles, it will just show the raw data. 9
10 10
11 11

12 Note that issue highlighting occurs under 2 conditions: 1. The value for the metric is over VTune Amplifier s predetermined threshold 2. The associated function uses 5% or greater of the CPU clockticks sampled 12

13 Both Intel Hyper-Threading Technology and Intel Turbo Boost 2.0 Technology can be enabled or disabled through the BIOS on most platforms. Contact with the system vendor or manufacturer for the specifics of any platform before attempting this. Incorrectly modifying bios settings from those supplied by the manufacturer can result in rendering the system completely unusable and may void the warranty. Don t forget to reenable these features once you are through with the software optimization process! 13
14 Note: While VTune Amplifier XE s Concurrency, Timeline and Locks and Waits features can also be helpful in threading an application, this slideset is not aimed at the process of introducing threads. The process described here could be used either before or after threading. However, we *do* recommend that you follow a top-down process when optimizing: beginning with system tuning (if appropriate), then algorithmic tuning, then microarchitectural tuning. The name of Software on Hardware tuning just means we are tuning software for specific hardware. Remember for all upcoming slides that you should only focus on hotspots! Only try to determine efficiency, identify causes, and optimize in hotspots! 14
15 15

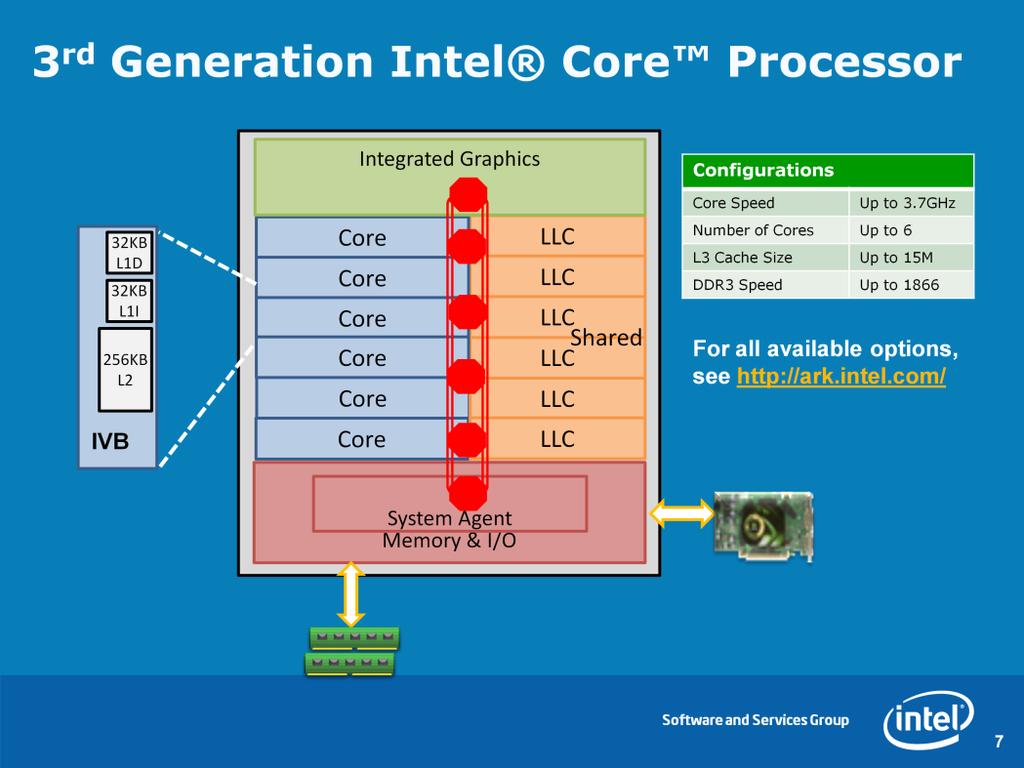
16 For the 3 rd Generation Intel Core processor family, the CPU_CLK_UNHALTED.THREAD counter measures unhalted clockticks on a per thread basis. So for each tick of the CPU's clock, the counter will count 2 ticks if Intel Hyper-Threading is enabled, 1 tick otherwise. There is no per-core clocktick counter. There is also a CPU_CLK_UNHALTED.REF counter, which counts unhalted clockticks per thread, at the reference frequency for the CPU. In other words, the CPU_CLK_UNHALTED.REF counter should not increase or decrease as a result of frequency changes due to Turbo Mode 2.0 or Intel Speedstep Technology.
17 17
.")
18 Formula: (UOPS_RETIRED.RETIRE_SLOTS/ (4*CPU_CLK_UNHALTED.THREAD)) Thresholds: Investigate if - % Retiring <.75 This metric is based on the fact that when operating at peak performance, the pipeline on a modern Intel CPU should be able to retire 4 micro-operations per clock cycle (or clocktick ). The formula looks at slots in the pipeline for each core, and sees if the slots are filled, and if so, whether they contained a microop that retired. More details on this methodology are available in the coming slides or in this paper:

19 The thresholds are general guidelines. Depending on the domain, some applications can run with less slots retiring than the thresholds above and still be efficient. It is important to remember that the pipeline slot methodology is only looking at how a given code utilizes the pipeline on a core. There still may be algorithmic optimizations, like parallelism and vectorization, that would boost the application s performance.

20 Formula: CPU_CLK_UNHALTED.THREAD/INST_RETIRED.ANY Threshold: In the interface, CPI will be highlighted if > 1. This is a very general rule based on the fact that some well tuned apps achieve CPIs of 1 or below. However, many apps will naturally have a CPI of over 1 it is very dependent on workload and platform. It is best used as a comparison factor know your app s CPI and see if over time it is moving upward (that is bad) or reducing (good!). Note that CPI is a ratio! Cycles per instruction. So if the code size changes for a binary, CPI will change. In general, if CPI reduces as a result of optimizations, that is good, and if it increases, that is bad. However there are exceptions! Some code can have a very low CPI but still be inefficient because more instructions are executed than are needed. This problem is discussed using the Code Examination method for determining efficiency. Another Note: CPI will be doubled if using Intel Hyper-Threading Technology. With Intel Hyper-Threading Technology enabled, there are actually 2 different definitions of CPI. We call them "Per Thread CPI" and "Per Core CPI". The Per Thread CPI will be twice the Per Core CPI. Only convert between per Thread and per Core CPI when viewing aggregate CPIs (summed for all logical threads). Note: Optimized code (i.e: SSE instructions) may actually increase the CPI, and increase stall % but it will increase the performance. CPI is just a general efficiency metric the real measure of efficiency is work taking less time.

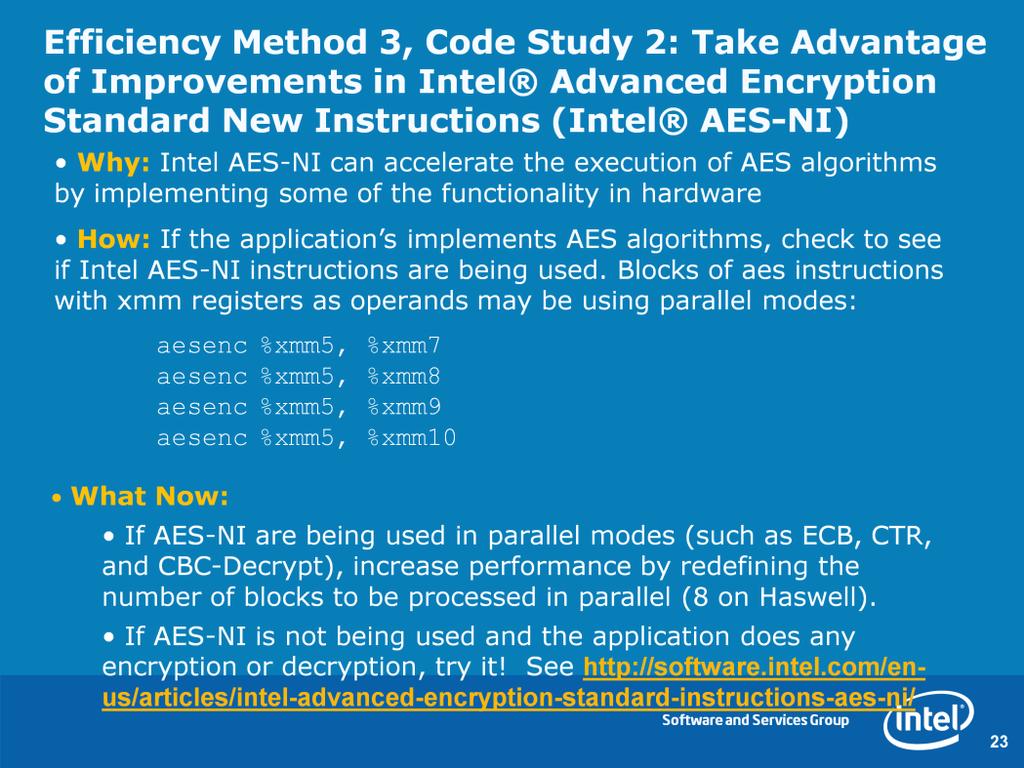
21 This method involves looking at the disassembly to make sure the most efficient instruction streams are generated. This can be complex and can require an expert knowledge of the Intel instruction set and compiler technology. What we have done is describe how to find 2 easy-to-detect code patterns and suggest how they may be implemented more efficiently using new features of the Intel Ivy Bridge CPU.

22 For more on AVX, see: A few notes: Integer vector code is not supported by Intel AVX in the first generation, but integer code can still use 128-bit Intel SSE instructions. The /Qax and ax versions of the Intel Compiler switches support automatic dispatching, to create a AV-optimized code-path for appropriate systems and a default code-path otherwise. 22
23 23
24 24

25 For a hotspot that is inefficient, determining the primary bottleneck is the first step. Optimizing code to fix issues outside the primary bottleneck category may not boost performance the biggest boost will come from resolving the biggest bottleneck. Generally, if Retiring is the primary bottleneck, that is good. See next slides.
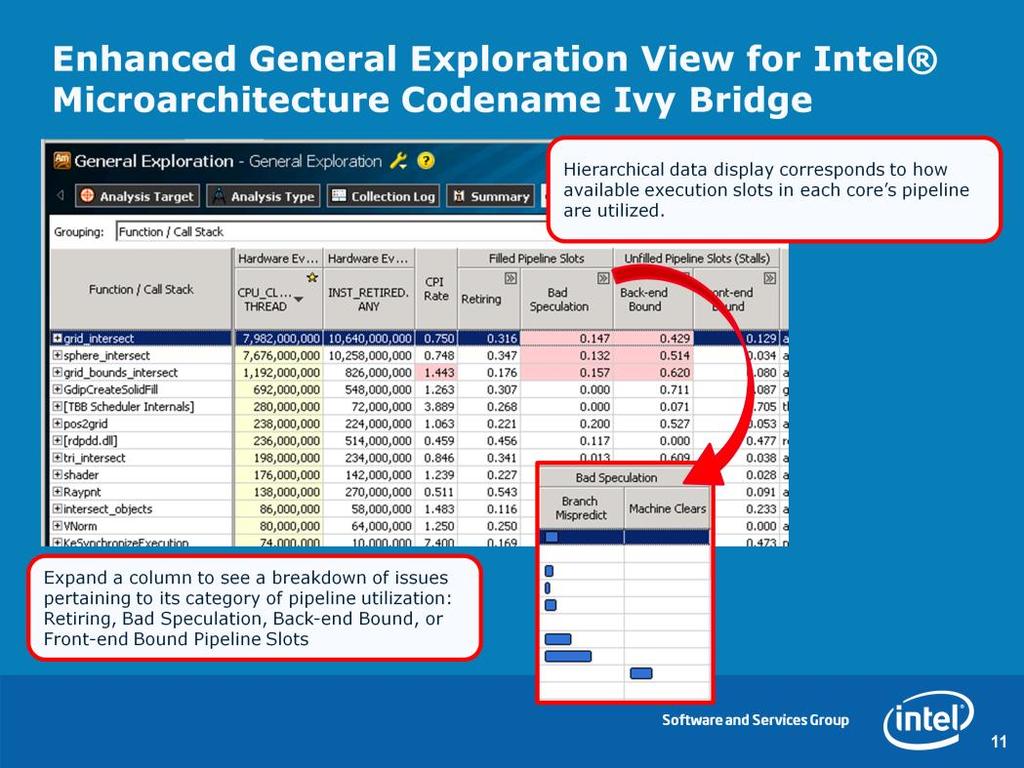
26 Note that the way this methodology allows us to classify what percentage of all pipeline slots end up in each category, for each cycle and for each core. It is possible that for a given dataset, there may be a significant percentage of pipeline slots in multiple categories that merit investigation. Start with the category with the highest percentage of pipeline slots. Ideally a large percentage of slots will fall into the Retiring category, but even then, it may be possible to make your code more efficient. For a complete description of this methodology, see the Intel 64 and IA-32 Architectures Optimization Reference Manual, Appendix B.3. 26

27 The distribution of pipeline slots in these four categories is very useful for developers. Although metrics based on events have been possible for many years, before this characterization there was no approach for identifying which possible performance issues were the most impactful. When performance metrics are placed into this framework, a developer can see which issues need to be tackled first. Within VTune Amplifier XE, if an issue is highlighted, it doesn t need to be investigated unless it is from the primary bottleneck category. Fixing issues that are not within the primary bottleneck category may not improve performance.
28 28
29 29
30 30
, reducing code footprint, and Profile-Guided Optimization (PGO). 31")
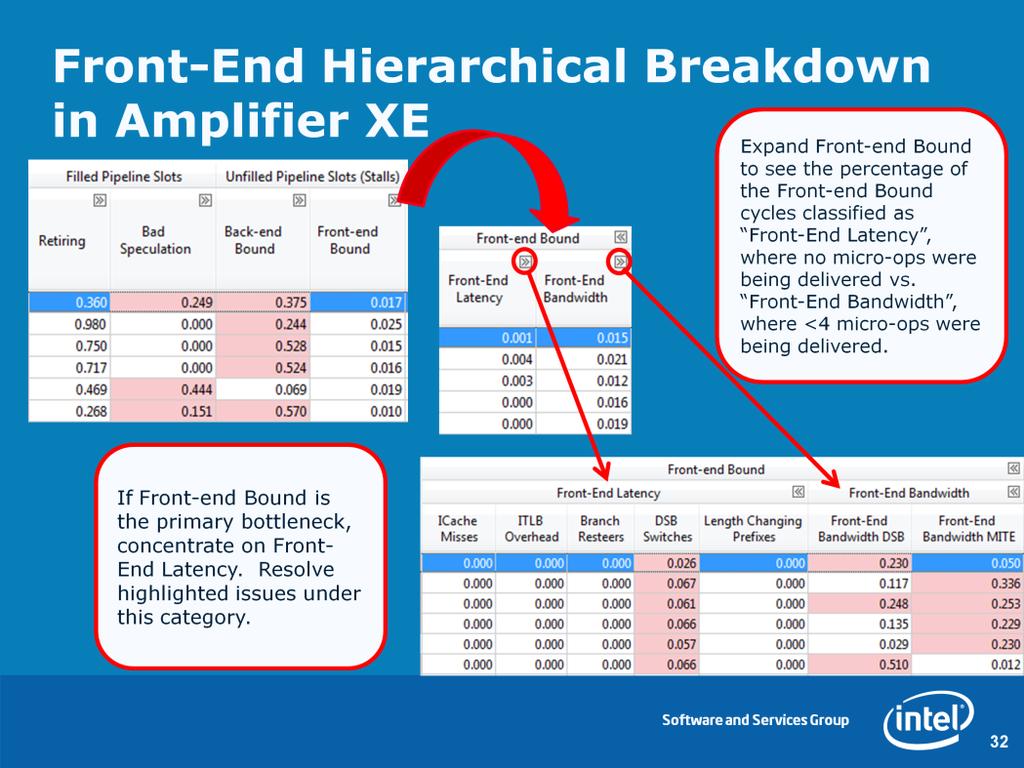
31 Front-End issues are caused by delays in fetching code (due to caching or ITLB issues) or in decoding instructions (due to specific instruction types or queueing issues). Front-End issues are generally resolved by compiler techniques like code layout (co-locating hot code), reducing code footprint, and Profile-Guided Optimization (PGO). 31
32 32
/ CPU_CLK_UNHALTED.THREAD % of cycles due to LCP stalls: (ILD_STALL.LCP)/CPU_CLK_UNHALTED.THREAD Thresholds: Thresholds: Investigate if % of cycles spent on ITLB Misses (ITLB Overhead).")
33 Formulas: % of cycles spent on ITLB Misses (ITLB Overhead): ITLB_MISSES.WALK_DURATION/ CPU_CLK_UNHALTED.THREAD % of cycles spent on icache Misses (Icache Overhead): (ICACHE.IFETCH_STALL - ITLB_MISSES.WALK_DURATION)/ CPU_CLK_UNHALTED.THREAD % of cycles due to LCP stalls: (ILD_STALL.LCP)/CPU_CLK_UNHALTED.THREAD Thresholds: Thresholds: Investigate if % of cycles spent on ITLB Misses (ITLB Overhead).05 (5%) % of cycles spent on ICache Misses (ICache Overhead).05 (5%) % of cycles due to LCP stalls.05 (5%)
34 34
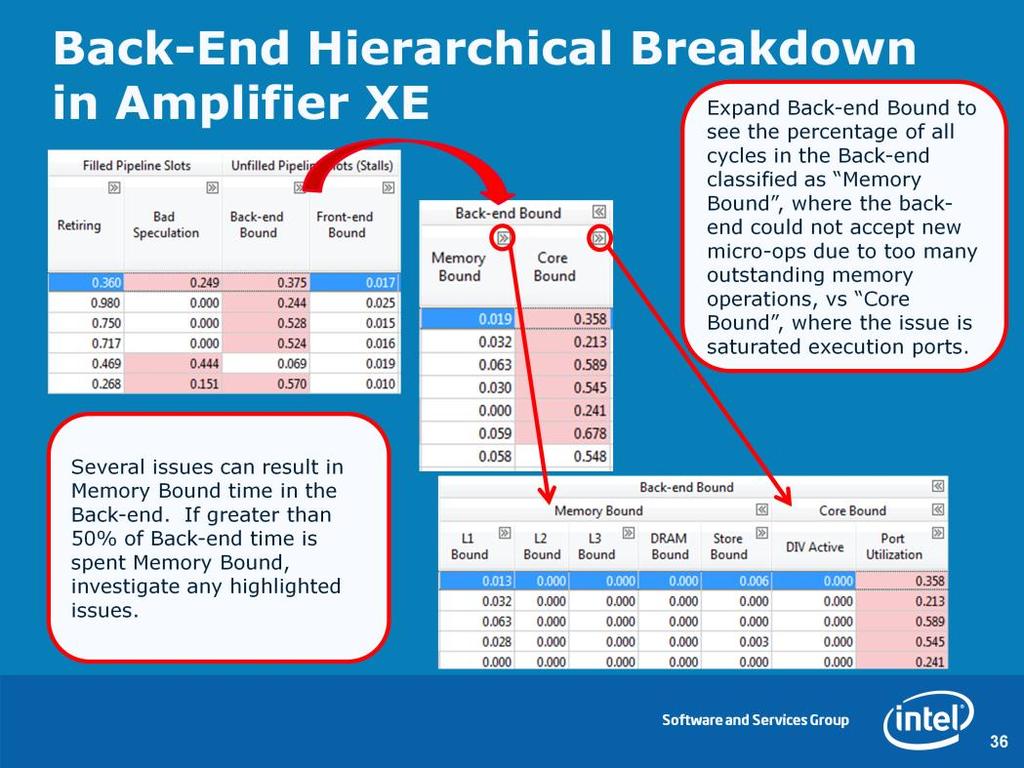
35 The Back-end is the most common category for hotspots, and is most likely to be the primary bottleneck. 35
36 36
: 29* MEM_LOAD_UOPS_RETIRED.LLC_HIT_PS / CPU_CLK_UNHALTED.THREAD Thresholds: Investigate if % cycles for LLC miss.")
37 Formulas: % of cycles spent on memory access (LLC misses): (MEM_LOAD_UOPS_L3_MISS_RETIRED.LOCAL_DRAM * 180) / CPU_CLK_UNHALTED.THREAD % of cycles spent on last level cache access (L3 Latency): 29* MEM_LOAD_UOPS_RETIRED.LLC_HIT_PS / CPU_CLK_UNHALTED.THREAD Thresholds: Investigate if % cycles for LLC miss.2 % cycles for L3 Latency.2 LLC stands for last level cache, and is the L3 cache on the 3 rd Generation Intel Core processor family. All accesses that miss the L3 cache are counted here as an LLC miss, regardless of whether the data were found in local memory, remote memory, or a remote cache. For the L3 Latency formula, it represents time spent accessing the L3 cache without contention.

38 Formula: % of cycles spent accessing data modified by another core: (MEM_LOAD_UOPS_LLC_HIT_RETIRED.XSNP_HITM_PS * 60) / CPU_CLK_UNHALTED.THREAD Thresholds: Investigate if % cycles accessing modified data >.05 This metric is also called write sharing. It occurs when one core needs data that are found in a modified state in another core s cache. This causes the line to be invalidated in the holding core s cache and moved to the requesting core s cache. If it is written again and another core requests it, the process starts again. The cacheline ping pong-ing between caches causes longer access time than if it could be simply shared amongst cores (as with read-sharing). Write sharing can be caused by true sharing, as with a lock or hot shared data structure, or by false sharing, meaning that the cores are modifying 2 separate pieces of data stored on the same cacheline. This metric measures write sharing at the L2 level. Note that in the case of real write sharing that is caused by a lock, Amplifier XE s Locks and Waits analysis should also indicate a problem. This hardwarelevel analysis will detect other cases as well though (such as false sharing or write sharing a hot data structure).

39 Formula: % of cycles spent accessing data modified by another core: (MEM_LOAD_UOPS_L3_HIT_RETIRED.XSNP_HIT_PS * 43) / CPU_CLK_UNHALTED.THREAD Thresholds: Investigate if % cycles accessing clean shared data >.05 This metric measures read sharing, or sharing of clean data, across L2 caches within 1 CPU socket. The L3 cache has a set of core valid bits that indicate whether each cacheline could be found in any L2 caches on the same socket, and if so, which ones. The first time a line is brought into the L3 cache, it will have core valid bits set to 1 for whichever L2 cache it went into. If that line is then read by a different core, then it will be fetched from L3, where the core valid bits will indicate it is present in one other core. The other L2 will have to be snooped, resulting in a longer latency access for that line. This metric measures the impact of that additional access time, when the cacheline in question is only being read-shared. In the case of read-sharing, the line can co-exist in multiple L2 caches in shared state, and for future accesses more than one core valid bit will be set. Then when other cores request the line, no L2 caches will need to be snooped, because the presence of 2 or more core valid bits tells the LLC that the line is shared (for reading) and ok to serve. Thus the impact of this only happens the first time a cacheline is requested for reading by a second L2 after it has already been placed in the L3 cache. The impact of sharing modified data across L2s is different and is measured with the Contested Accesses metric. 39

40 Formula: Blocked Store Forwarding Cost = (LD_BLOCKS_STORE_FORWARD * 13) / CPU_CLK_UNHALTED.THREAD Threshold: Investigate if Cost.05 Store forwarding occurs when there are two memory instructions in the pipeline, a store followed by a load from the same address. Instead of waiting for the data to be stored to the cache, it is forwarded back along the pipeline to the load instruction, saving a load from the cache. Store forwarding is the desired behavior, however, in certain cases, the store may not be able to be forwarded, so the load instruction becomes blocked waiting for the store to write to the cache and then to load it. 40
41 A cacheline split is any load or store that traverses a 64-byte boundary. Formulas: Split Load Cost = ((L1D_PEND_MISS.PENDING / MEM_LOAD_UOPS_RETIRED.L1_MISS )*LD_BLOCKS.NO_SR ) / CPU_CLK_UNHALTED.THREAD Split Store Ratio = MEM_UOP_RETIRED.SPLIT_STORES_PS / MEM_UOP_RETIRED.ALL_STORES_PS Thresholds: Investigate if Split load cost.1 or Split store ratio is > 0.01 Beginning with the Intel Core architecture, the penalty for cacheline splits has been reduced. However, if there are repeated splits occurring, the penalty can grow, and even a small increase in latency can make a difference in application performance. 41
42 Formula: Aliasing Conflicts Cost = (LD_BLOCKS_PARTIAL.ADDRESS_ALIAS * 5) / CPU_CLK_UNHALTED.THREAD Threshold: Investigate if Aliasing conflicts cost.1 This occurs when a load is issued after a store and their memory addresses are offset by (4K). When this is processed in the pipeline, the issue of the load will match the previous store (the full address is not used at this point), so pipeline will try to forward the results of the store and avoid doing the load (this is store forwarding). Later on when the address of the load is fully resolved, it will not match the store, and so the load will have to be re-issued from a later point in the pipe. This has a 5-cycle penalty in the normal case, but could be worse in certain situations, like with un-aligned loads that span 2 cache lines. 42
 / CPU_CLK_UNHALTED.THREAD Threshold: Investigate if- DTLB Overhead.1 DTLB Store Overhead.")
43 Formula: DTLB Overhead = ((DTLB_LOAD_MISSES.STLB_HIT * 7) + DTLB_LOAD_MISSES.WALK_DURATION) / CPU_CLK_UNHALTED.THREAD DTLB Store Overhead = ((DTLB_STORE_MISSES.STLB_HIT* 7) + DTLB_STORE_MISSES.WALK_DURATION) / CPU_CLK_UNHALTED.THREAD Threshold: Investigate if- DTLB Overhead.1 DTLB Store Overhead.05 On target data locality to TLB size: this is accomplished via data blocking and trying to minimize random access patterns. Note: this is more likely to occur with server applications or applications with a large random dataset

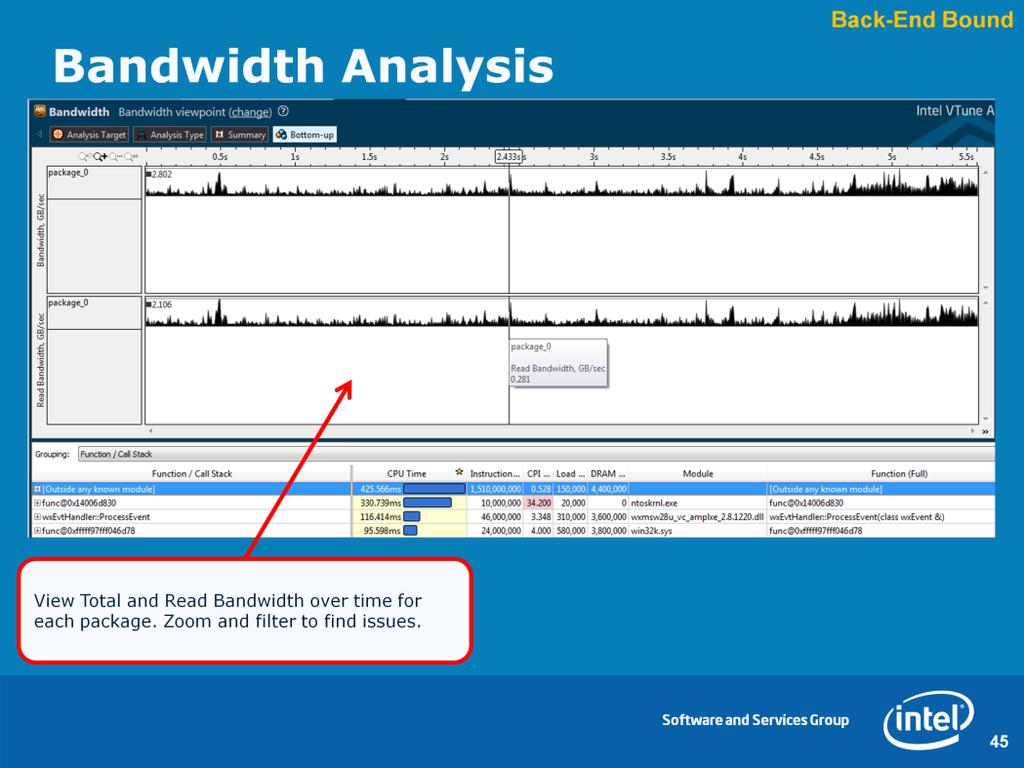
44 Max theoretical bandwidth, per socket, for 3rd Generation Intel Core Processor Family, with DDR 1600 and 2 memory channels: 25.6 GB/s 44
45 45
46 46
47 Micro-operations that are removed from the Back-End most likely happen because the Front-End mispredicted a branch. This is discovered in the Back- End when the branch operation is executed. At this point, if the target of the branch was incorrectly predicted, the micro-operation and all subsequent incorrectly predicted operations are removed and the Front-End is re-directed to begin fetching instructions from the correct target. 47
48 Formula: Mispredicted branch cost: (BR_MISP_RETIRED.ALL_BRANCHES_PS / (BR_MISP_RETIRED.ALL_BRANCHES_PS + MACHINE_CLEARS.COUNT )*((UOPS_ISSUED.ANY - UOPS_RETIRED.RETIRE_SLOTS + 4* INT_MISC.RECOVERY_CYCLES ) / (4*CPU_CLK_UNHALTED.THREAD))) Threshold: Investigate if - Cost is.2 Note that all applications will have some branch mispredicts - it is not the number of mispredicts that is the problem but the impact. To do hand-tuning, you need to locate the branch causing the mispredicts. This can be difficult to track down due to the fact that this event will normally tag to the first instruction in the correct path that the branch takes.
.")
49 Formula: Machine Clear cost: ((Bad Speculation) (Branch Mispredicts)) Threshold: Investigate if - Cost is.02 Machine clears are generally caused by either contention on a lock, or failed memory disambiguation from 4k aliasing (both earlier issues). The other potential cause is self-modifying code (SMC).
50 50
51 In general, having as many pipeline slots retiring per cycle as possible is the goal. Besides algorithmic improvements like parallelism, There are two potential areas to investigate for the retiring category. The first is whether vectorization can be applied to make the instructions that are retiring even more efficient. See Code Study 1 for more on this. The second is whether microcode assists can be eliminated from the instruction stream. See next 2 slides. 51
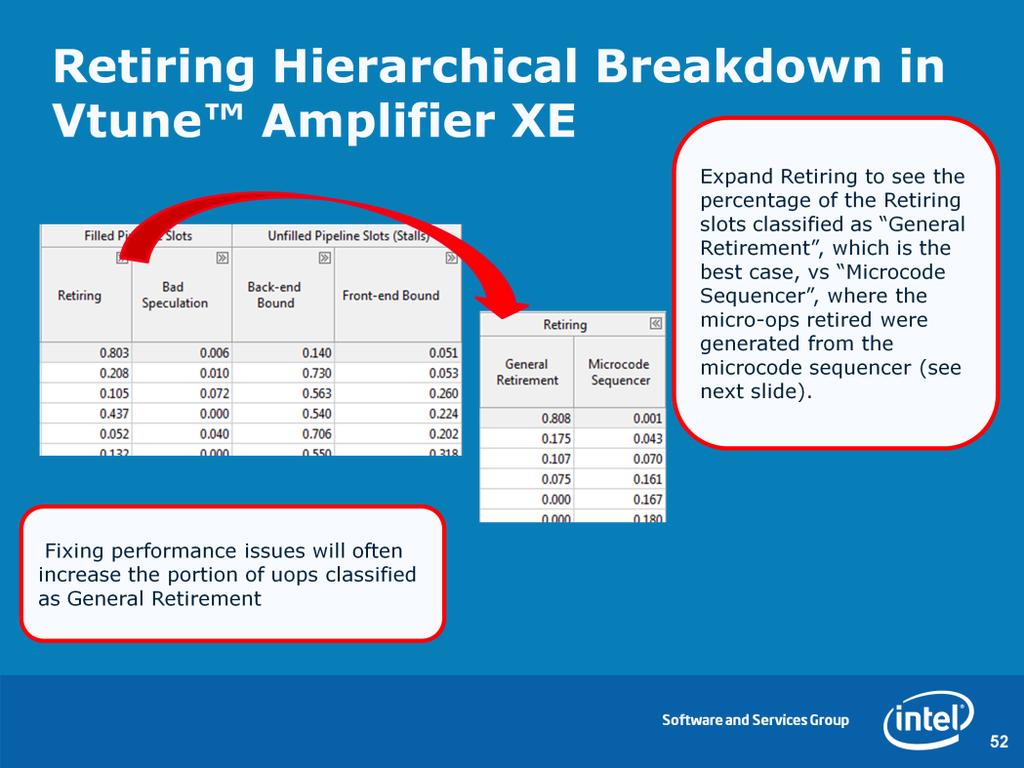
52 52

53 Formula: Assist % = IDQ.MS_CYCLES / (4*CPU_CLK_UNHALTED.THREAD) Threshold: Investigate if Assist Cost.05 There are many instructions that can cause assists when there is no performance problem. If you see MS_CYCLES it doesn t necessarily mean there is an issue, but whenever you do see a significant amount of MS_CYCLES, check the other metrics to see if it s one of the problems we mention. 53
54 54
55 55
56 56
Jackson Marusarz Intel Corporation
 Jackson Marusarz Intel Corporation Intel VTune Amplifier Quick Introduction Get the Data You Need Hotspot (Statistical call tree), Call counts (Statistical) Thread Profiling Concurrency and Lock & Waits
Profiling: Understand Your Application
 Profiling: Understand Your Application Michal Merta michal.merta@vsb.cz 1st of March 2018 Agenda Hardware events based sampling Some fundamental bottlenecks Overview of profiling tools perf tools Intel
Optimize Data Structures and Memory Access Patterns to Improve Data Locality
 Optimize Data Structures and Memory Access Patterns to Improve Data Locality Abstract Cache is one of the most important resources
Tutorial: Finding Hotspots with Intel VTune Amplifier - Linux* Intel VTune Amplifier Legal Information
 Tutorial: Finding Hotspots with Intel VTune Amplifier - Linux* Intel VTune Amplifier Legal Information Tutorial: Finding Hotspots with Intel VTune Amplifier - Linux* Contents Legal Information... 3 Chapter
Simplified and Effective Serial and Parallel Performance Optimization
 HPC Code Modernization Workshop at LRZ Simplified and Effective Serial and Parallel Performance Optimization Performance tuning Using Intel VTune Performance Profiler Performance Tuning Methodology Goal:
Performance Tuning VTune Performance Analyzer
 Performance Tuning VTune Performance Analyzer Paul Petersen, Intel Sept 9, 2005 Copyright 2005 Intel Corporation Performance Tuning Overview Methodology Benchmarking Timing VTune Counter Monitor Call Graph
Intel profiling tools and roofline model. Dr. Luigi Iapichino
 Intel profiling tools and roofline model Dr. Luigi Iapichino luigi.iapichino@lrz.de Which tool do I use in my project? A roadmap to optimization (and to the next hour) We will focus on tools developed
Intel Architecture for Software Developers
 Intel Architecture for Software Developers 1 Agenda Introduction Processor Architecture Basics Intel Architecture Intel Core and Intel Xeon Intel Atom Intel Xeon Phi Coprocessor Use Cases for Software
Lecture 9: More ILP. Today: limits of ILP, case studies, boosting ILP (Sections )
") Lecture 9: More ILP Today: limits of ILP, case studies, boosting ILP (Sections 3.8-3.14) 1 ILP Limits The perfect processor: Infinite registers (no WAW or WAR hazards) Perfect branch direction and target
Lecture 9: More ILP Today: limits of ILP, case studies, boosting ILP (Sections 3.8-3.14) 1 ILP Limits The perfect processor: Infinite registers (no WAW or WAR hazards) Perfect branch direction and target
ECE7995 (6) Improving Cache Performance. [Adapted from Mary Jane Irwin s slides (PSU)]
![ECE7995 (6) Improving Cache Performance. [Adapted from Mary Jane Irwin s slides (PSU)]](/thumbs/72/68075397.jpg "ECE7995 (6) Improving Cache Performance. [Adapted from Mary Jane Irwin s slides (PSU)]") ECE7995 (6) Improving Cache Performance [Adapted from Mary Jane Irwin s slides (PSU)] Measuring Cache Performance Assuming cache hit costs are included as part of the normal CPU execution cycle, then CPU
ECE7995 (6) Improving Cache Performance [Adapted from Mary Jane Irwin s slides (PSU)] Measuring Cache Performance Assuming cache hit costs are included as part of the normal CPU execution cycle, then CPU
Intel Parallel Studio: Vtune
 ntel Parallel Studio: Vtune C.Berthelot Christophe.Berthelot@atos.net Copyright c Bull S.A.S. 2016 1 C.Berthelot Christophe.Berthelot@atos.net c Atos Agenda ntroduction Bottelneck Gprof ntroduction The
KNL tools. Dr. Fabio Baruffa
 KNL tools Dr. Fabio Baruffa fabio.baruffa@lrz.de 2 Which tool do I use? A roadmap to optimization We will focus on tools developed by Intel, available to users of the LRZ systems. Again, we will skip the
Anastasia Ailamaki. Performance and energy analysis using transactional workloads
 Performance and energy analysis using transactional workloads Anastasia Ailamaki EPFL and RAW Labs SA students: Danica Porobic, Utku Sirin, and Pinar Tozun Online Transaction Processing $2B+ industry Characteristics:
Advanced d Instruction Level Parallelism. Computer Systems Laboratory Sungkyunkwan University
 Advanced d Instruction ti Level Parallelism Jin-Soo Kim (jinsookim@skku.edu) Computer Systems Laboratory Sungkyunkwan University http://csl.skku.edu ILP Instruction-Level Parallelism (ILP) Pipelining:
Chapter 03. Authors: John Hennessy & David Patterson. Copyright 2011, Elsevier Inc. All rights Reserved. 1
 Chapter 03 Authors: John Hennessy & David Patterson Copyright 2011, Elsevier Inc. All rights Reserved. 1 Figure 3.3 Comparison of 2-bit predictors. A noncorrelating predictor for 4096 bits is first, followed
Performance analysis tools: Intel VTuneTM Amplifier and Advisor. Dr. Luigi Iapichino
 Performance analysis tools: Intel VTuneTM Amplifier and Advisor Dr. Luigi Iapichino luigi.iapichino@lrz.de Which tool do I use in my project? A roadmap to optimisation After having considered the MPI layer,
Using Intel VTune Amplifier XE and Inspector XE in.net environment
 Using Intel VTune Amplifier XE and Inspector XE in.net environment Levent Akyil Technical Computing, Analyzers and Runtime Software and Services group 1 Refresher - Intel VTune Amplifier XE Intel Inspector
A Comparative Performance Evaluation of Different Application Domains on Server Processor Architectures
 A Comparative Performance Evaluation of Different Application Domains on Server Processor Architectures W.M. Roshan Weerasuriya and D.N. Ranasinghe University of Colombo School of Computing A Comparative
Lecture 8: Instruction Fetch, ILP Limits. Today: advanced branch prediction, limits of ILP (Sections , )
") Lecture 8: Instruction Fetch, ILP Limits Today: advanced branch prediction, limits of ILP (Sections 3.4-3.5, 3.8-3.14) 1 1-Bit Prediction For each branch, keep track of what happened last time and use
Lecture 8: Instruction Fetch, ILP Limits Today: advanced branch prediction, limits of ILP (Sections 3.4-3.5, 3.8-3.14) 1 1-Bit Prediction For each branch, keep track of what happened last time and use
Parallelism. Execution Cycle. Dual Bus Simple CPU. Pipelining COMP375 1
 Pipelining COMP375 Computer Architecture and dorganization Parallelism The most common method of making computers faster is to increase parallelism. There are many levels of parallelism Macro Multiple
CSE 431 Computer Architecture Fall Chapter 5A: Exploiting the Memory Hierarchy, Part 1
 CSE 431 Computer Architecture Fall 2008 Chapter 5A: Exploiting the Memory Hierarchy, Part 1 Mary Jane Irwin ( www.cse.psu.edu/~mji ) [Adapted from Computer Organization and Design, 4 th Edition, Patterson
CPSC 313, 04w Term 2 Midterm Exam 2 Solutions
 1. (10 marks) Short answers. CPSC 313, 04w Term 2 Midterm Exam 2 Solutions Date: March 11, 2005; Instructor: Mike Feeley 1a. Give an example of one important CISC feature that is normally not part of a
CS Computer Architecture
 CS 35101 Computer Architecture Section 600 Dr. Angela Guercio Fall 2010 An Example Implementation In principle, we could describe the control store in binary, 36 bits per word. We will use a simple symbolic
Superscalar Processors Ch 14
 Superscalar Processors Ch 14 Limitations, Hazards Instruction Issue Policy Register Renaming Branch Prediction PowerPC, Pentium 4 1 Superscalar Processing (5) Basic idea: more than one instruction completion
Write only as much as necessary. Be brief!
 1 CIS371 Computer Organization and Design Midterm Exam Prof. Martin Thursday, March 15th, 2012 This exam is an individual-work exam. Write your answers on these pages. Additional pages may be attached
Superscalar Processing (5) Superscalar Processors Ch 14. New dependency for superscalar case? (8) Output Dependency?
 Superscalar Processors Ch 14. New dependency for superscalar case? (8) Output Dependency?") Superscalar Processors Ch 14 Limitations, Hazards Instruction Issue Policy Register Renaming Branch Prediction PowerPC, Pentium 4 1 Superscalar Processing (5) Basic idea: more than one instruction completion
Superscalar Processors Ch 14 Limitations, Hazards Instruction Issue Policy Register Renaming Branch Prediction PowerPC, Pentium 4 1 Superscalar Processing (5) Basic idea: more than one instruction completion
Exam-2 Scope. 3. Shared memory architecture, distributed memory architecture, SMP, Distributed Shared Memory and Directory based coherence
 Exam-2 Scope 1. Memory Hierarchy Design (Cache, Virtual memory) Chapter-2 slides memory-basics.ppt Optimizations of Cache Performance Memory technology and optimizations Virtual memory 2. SIMD, MIMD, Vector,
Itanium 2 Processor Microarchitecture Overview
 Itanium 2 Processor Microarchitecture Overview Don Soltis, Mark Gibson Cameron McNairy, August 2002 Block Diagram F 16KB L1 I-cache Instr 2 Instr 1 Instr 0 M/A M/A M/A M/A I/A Template I/A B B 2 FMACs
CSF Improving Cache Performance. [Adapted from Computer Organization and Design, Patterson & Hennessy, 2005]
![CSF Improving Cache Performance. [Adapted from Computer Organization and Design, Patterson & Hennessy, 2005]](/thumbs/76/74076691.jpg "CSF Improving Cache Performance. [Adapted from Computer Organization and Design, Patterson & Hennessy, 2005]") CSF Improving Cache Performance [Adapted from Computer Organization and Design, Patterson & Hennessy, 2005] Review: The Memory Hierarchy Take advantage of the principle of locality to present the user
CSF Improving Cache Performance [Adapted from Computer Organization and Design, Patterson & Hennessy, 2005] Review: The Memory Hierarchy Take advantage of the principle of locality to present the user
Basics of Performance Engineering
 ERLANGEN REGIONAL COMPUTING CENTER Basics of Performance Engineering J. Treibig HiPerCH 3, 23./24.03.2015 Why hardware should not be exposed Such an approach is not portable Hardware issues frequently
6x86 PROCESSOR Superscalar, Superpipelined, Sixth-generation, x86 Compatible CPU
 1-6x86 PROCESSOR Superscalar, Superpipelined, Sixth-generation, x86 Compatible CPU Product Overview Introduction 1. ARCHITECTURE OVERVIEW The Cyrix 6x86 CPU is a leader in the sixth generation of high
Page 1. Memory Hierarchies (Part 2)
") Memory Hierarchies (Part ) Outline of Lectures on Memory Systems Memory Hierarchies Cache Memory 3 Virtual Memory 4 The future Increasing distance from the processor in access time Review: The Memory Hierarchy
Memory Hierarchies (Part ) Outline of Lectures on Memory Systems Memory Hierarchies Cache Memory 3 Virtual Memory 4 The future Increasing distance from the processor in access time Review: The Memory Hierarchy
Next Generation Technology from Intel Intel Pentium 4 Processor
 Next Generation Technology from Intel Intel Pentium 4 Processor 1 The Intel Pentium 4 Processor Platform Intel s highest performance processor for desktop PCs Targeted at consumer enthusiasts and business
Dynamic Control Hazard Avoidance
 Dynamic Control Hazard Avoidance Consider Effects of Increasing the ILP Control dependencies rapidly become the limiting factor they tend to not get optimized by the compiler more instructions/sec ==>
What's new in VTune Amplifier XE
 What's new in VTune Amplifier XE Naftaly Shalev Software and Services Group Developer Products Division 1 Agenda What s New? Using VTune Amplifier XE 2013 on Xeon Phi coprocessors New and Experimental
Superscalar Processors
 Superscalar Processors Superscalar Processor Multiple Independent Instruction Pipelines; each with multiple stages Instruction-Level Parallelism determine dependencies between nearby instructions o input
Hardware-Based Speculation
 Hardware-Based Speculation Execute instructions along predicted execution paths but only commit the results if prediction was correct Instruction commit: allowing an instruction to update the register
Intel VTune Amplifier XE
 Intel VTune Amplifier XE Vladimir Tsymbal Performance, Analysis and Threading Lab 1 Agenda Intel VTune Amplifier XE Overview Features Data collectors Analysis types Key Concepts Collecting performance
Processor (IV) - advanced ILP. Hwansoo Han
 - advanced ILP. Hwansoo Han") Processor (IV) - advanced ILP Hwansoo Han Instruction-Level Parallelism (ILP) Pipelining: executing multiple instructions in parallel To increase ILP Deeper pipeline Less work per stage shorter clock cycle
Processor (IV) - advanced ILP Hwansoo Han Instruction-Level Parallelism (ILP) Pipelining: executing multiple instructions in parallel To increase ILP Deeper pipeline Less work per stage shorter clock cycle
CS450/650 Notes Winter 2013 A Morton. Superscalar Pipelines
 CS450/650 Notes Winter 2013 A Morton Superscalar Pipelines 1 Scalar Pipeline Limitations (Shen + Lipasti 4.1) 1. Bounded Performance P = 1 T = IC CPI 1 cycletime = IPC frequency IC IPC = instructions per
The Processor: Instruction-Level Parallelism
 The Processor: Instruction-Level Parallelism Computer Organization Architectures for Embedded Computing Tuesday 21 October 14 Many slides adapted from: Computer Organization and Design, Patterson & Hennessy
( ZIH ) Center for Information Services and High Performance Computing. Overvi ew over the x86 Processor Architecture
 Center for Information Services and High Performance Computing. Overvi ew over the x86 Processor Architecture") ( ZIH ) Center for Information Services and High Performance Computing Overvi ew over the x86 Processor Architecture Daniel Molka Ulf Markwardt Daniel.Molka@tu-dresden.de ulf.markwardt@tu-dresden.de Outline
( ZIH ) Center for Information Services and High Performance Computing Overvi ew over the x86 Processor Architecture Daniel Molka Ulf Markwardt Daniel.Molka@tu-dresden.de ulf.markwardt@tu-dresden.de Outline
Intel Xeon Phi Coprocessor Performance Analysis
 Intel Xeon Phi Coprocessor Performance Analysis Legal Disclaimer INFORMATION IN THIS DOCUMENT IS PROVIDED IN CONNECTION WITH INTEL PRODUCTS. NO LICENSE, EXPRESS OR IMPLIED, BY ESTOPPEL OR OTHERWISE, TO
Lecture 5: Instruction Pipelining. Pipeline hazards. Sequential execution of an N-stage task: N Task 2
 Lecture 5: Instruction Pipelining Basic concepts Pipeline hazards Branch handling and prediction Zebo Peng, IDA, LiTH Sequential execution of an N-stage task: 3 N Task 3 N Task Production time: N time
EE 4683/5683: COMPUTER ARCHITECTURE
 EE 4683/5683: COMPUTER ARCHITECTURE Lecture 6A: Cache Design Avinash Kodi, kodi@ohioedu Agenda 2 Review: Memory Hierarchy Review: Cache Organization Direct-mapped Set- Associative Fully-Associative 1 Major
Chapter 4. Advanced Pipelining and Instruction-Level Parallelism. In-Cheol Park Dept. of EE, KAIST
 Chapter 4. Advanced Pipelining and Instruction-Level Parallelism In-Cheol Park Dept. of EE, KAIST Instruction-level parallelism Loop unrolling Dependence Data/ name / control dependence Loop level parallelism
Microarchitectural Analysis with Intel VTune Amplifier XE
 Microarchitectural Analysis with Intel VTune Amplifier XE Michael Klemm Software & Services Group Developer Relations Division 1 Legal Disclaimer INFORMATION IN THIS DOCUMENT IS PROVIDED IN CONNECTION
Inside Intel Core Microarchitecture
 White Paper Inside Intel Core Microarchitecture Setting New Standards for Energy-Efficient Performance Ofri Wechsler Intel Fellow, Mobility Group Director, Mobility Microprocessor Architecture Intel Corporation
Processor Architecture V! Wrap-Up!
 Processor Architecture V! Wrap-Up! Lecture 7, April 28 th 2011 Alexandre David Slides by Randal E. Bryant! Carnegie Mellon University! Overview! Wrap-Up of PIPE Design! n Performance analysis! n Fetch
Instruction-Level Parallelism. Instruction Level Parallelism (ILP)
") Instruction-Level Parallelism CS448 1 Pipelining Instruction Level Parallelism (ILP) Limited form of ILP Overlapping instructions, these instructions can be evaluated in parallel (to some degree) Pipeline
Instruction-Level Parallelism CS448 1 Pipelining Instruction Level Parallelism (ILP) Limited form of ILP Overlapping instructions, these instructions can be evaluated in parallel (to some degree) Pipeline
HW1 Solutions. Type Old Mix New Mix Cost CPI
 HW1 Solutions Problem 1 TABLE 1 1. Given the parameters of Problem 6 (note that int =35% and shift=5% to fix typo in book problem), consider a strength-reducing optimization that converts multiplies by
Superscalar Processors
 Superscalar Processors Increasing pipeline length eventually leads to diminishing returns longer pipelines take longer to re-fill data and control hazards lead to increased overheads, removing any a performance
Real Processors. Lecture for CPSC 5155 Edward Bosworth, Ph.D. Computer Science Department Columbus State University
 Real Processors Lecture for CPSC 5155 Edward Bosworth, Ph.D. Computer Science Department Columbus State University Instruction-Level Parallelism (ILP) Pipelining: executing multiple instructions in parallel
ENGN1640: Design of Computing Systems Topic 06: Advanced Processor Design
 ENGN1640: Design of Computing Systems Topic 06: Advanced Processor Design Professor Sherief Reda http://scale.engin.brown.edu Electrical Sciences and Computer Engineering School of Engineering Brown University
Intel Architecture for HPC
 Intel Architecture for HPC Georg Zitzlsberger georg.zitzlsberger@vsb.cz 1st of March 2018 Agenda Salomon Architectures Intel R Xeon R processors v3 (Haswell) Intel R Xeon Phi TM coprocessor (KNC) Ohter
SRAMs to Memory. Memory Hierarchy. Locality. Low Power VLSI System Design Lecture 10: Low Power Memory Design
 SRAMs to Memory Low Power VLSI System Design Lecture 0: Low Power Memory Design Prof. R. Iris Bahar October, 07 Last lecture focused on the SRAM cell and the D or D memory architecture built from these
Chapter 4. The Processor
 Chapter 4 The Processor Introduction CPU performance factors Instruction count Determined by ISA and compiler CPI and Cycle time Determined by CPU hardware We will examine two MIPS implementations A simplified
c. What are the machine cycle times (in nanoseconds) of the non-pipelined and the pipelined implementations?
 of the non-pipelined and the pipelined implementations?") Brown University School of Engineering ENGN 164 Design of Computing Systems Professor Sherief Reda Homework 07. 140 points. Due Date: Monday May 12th in B&H 349 1. [30 points] Consider the non-pipelined
Brown University School of Engineering ENGN 164 Design of Computing Systems Professor Sherief Reda Homework 07. 140 points. Due Date: Monday May 12th in B&H 349 1. [30 points] Consider the non-pipelined
ENGN 2910A Homework 03 (140 points) Due Date: Oct 3rd 2013
 Due Date: Oct 3rd 2013") ENGN 2910A Homework 03 (140 points) Due Date: Oct 3rd 2013 Professor: Sherief Reda School of Engineering, Brown University 1. [from Debois et al. 30 points] Consider the non-pipelined implementation of
ENGN 2910A Homework 03 (140 points) Due Date: Oct 3rd 2013 Professor: Sherief Reda School of Engineering, Brown University 1. [from Debois et al. 30 points] Consider the non-pipelined implementation of
Computer Architecture A Quantitative Approach, Fifth Edition. Chapter 2. Memory Hierarchy Design. Copyright 2012, Elsevier Inc. All rights reserved.
 Computer Architecture A Quantitative Approach, Fifth Edition Chapter 2 Memory Hierarchy Design 1 Introduction Programmers want unlimited amounts of memory with low latency Fast memory technology is more
Portland State University ECE 587/687. The Microarchitecture of Superscalar Processors
 Portland State University ECE 587/687 The Microarchitecture of Superscalar Processors Copyright by Alaa Alameldeen and Haitham Akkary 2011 Program Representation An application is written as a program,
CS3350B Computer Architecture
 CS335B Computer Architecture Winter 25 Lecture 32: Exploiting Memory Hierarchy: How? Marc Moreno Maza wwwcsduwoca/courses/cs335b [Adapted from lectures on Computer Organization and Design, Patterson &
Instruction-Level Parallelism Dynamic Branch Prediction. Reducing Branch Penalties
 Instruction-Level Parallelism Dynamic Branch Prediction CS448 1 Reducing Branch Penalties Last chapter static schemes Move branch calculation earlier in pipeline Static branch prediction Always taken,
How to write powerful parallel Applications
 How to write powerful parallel Applications 08:30-09.00 09.00-09:45 09.45-10:15 10:15-10:30 10:30-11:30 11:30-12:30 12:30-13:30 13:30-14:30 14:30-15:15 15:15-15:30 15:30-16:00 16:00-16:45 16:45-17:15 Welcome
Martin Kruliš, v
 Martin Kruliš 1 Optimizations in General Code And Compilation Memory Considerations Parallelism Profiling And Optimization Examples 2 Premature optimization is the root of all evil. -- D. Knuth Our goal
Tools for Intel Xeon Phi: VTune & Advisor Dr. Fabio Baruffa - LRZ,
 Tools for Intel Xeon Phi: VTune & Advisor Dr. Fabio Baruffa - fabio.baruffa@lrz.de LRZ, 27.6.- 29.6.2016 Architecture Overview Intel Xeon Processor Intel Xeon Phi Coprocessor, 1st generation Intel Xeon
Computer Architecture A Quantitative Approach, Fifth Edition. Chapter 3. Instruction-Level Parallelism and Its Exploitation
 Computer Architecture A Quantitative Approach, Fifth Edition Chapter 3 Instruction-Level Parallelism and Its Exploitation Introduction Pipelining become universal technique in 1985 Overlaps execution of
Copyright 2012, Elsevier Inc. All rights reserved.
 Computer Architecture A Quantitative Approach, Fifth Edition Chapter 3 Instruction-Level Parallelism and Its Exploitation 1 Branch Prediction Basic 2-bit predictor: For each branch: Predict taken or not
CSE 820 Graduate Computer Architecture. week 6 Instruction Level Parallelism. Review from Last Time #1
 CSE 820 Graduate Computer Architecture week 6 Instruction Level Parallelism Based on slides by David Patterson Review from Last Time #1 Leverage Implicit Parallelism for Performance: Instruction Level
Last lecture. Some misc. stuff An older real processor Class review/overview.
 Last lecture Some misc. stuff An older real processor Class review/overview. HW5 Misc. Status issues Answers posted Returned on Wednesday (next week) Project presentation signup at http://tinyurl.com/470w14talks
Limitations of Scalar Pipelines
 Limitations of Scalar Pipelines Superscalar Organization Modern Processor Design: Fundamentals of Superscalar Processors Scalar upper bound on throughput IPC = 1 Inefficient unified pipeline
Static vs. Dynamic Scheduling
 Static vs. Dynamic Scheduling Dynamic Scheduling Fast Requires complex hardware More power consumption May result in a slower clock Static Scheduling Done in S/W (compiler) Maybe not as fast Simpler processor
Pentium 4 Processor Block Diagram
 FP FP Pentium 4 Processor Block Diagram FP move FP store FMul FAdd MMX SSE 3.2 GB/s 3.2 GB/s L D-Cache and D-TLB Store Load edulers Integer Integer & I-TLB ucode Netburst TM Micro-architecture Pipeline
EECC551 Exam Review 4 questions out of 6 questions
 EECC551 Exam Review 4 questions out of 6 questions (Must answer first 2 questions and 2 from remaining 4) Instruction Dependencies and graphs In-order Floating Point/Multicycle Pipelining (quiz 2) Improving
MIPS Pipelining. Computer Organization Architectures for Embedded Computing. Wednesday 8 October 14
 MIPS Pipelining Computer Organization Architectures for Embedded Computing Wednesday 8 October 14 Many slides adapted from: Computer Organization and Design, Patterson & Hennessy 4th Edition, 2011, MK
CS425 Computer Systems Architecture
 CS425 Computer Systems Architecture Fall 2017 Thread Level Parallelism (TLP) CS425 - Vassilis Papaefstathiou 1 Multiple Issue CPI = CPI IDEAL + Stalls STRUC + Stalls RAW + Stalls WAR + Stalls WAW + Stalls
UNIT 8 1. Explain in detail the hardware support for preserving exception behavior during Speculation.
 UNIT 8 1. Explain in detail the hardware support for preserving exception behavior during Speculation. July 14) (June 2013) (June 2015)(Jan 2016)(June 2016) H/W Support : Conditional Execution Also known
Superscalar Processors Ch 13. Superscalar Processing (5) Computer Organization II 10/10/2001. New dependency for superscalar case? (8) Name dependency
 Computer Organization II 10/10/2001. New dependency for superscalar case? (8) Name dependency") Superscalar Processors Ch 13 Limitations, Hazards Instruction Issue Policy Register Renaming Branch Prediction 1 New dependency for superscalar case? (8) Name dependency (nimiriippuvuus) two use the same
Superscalar Processors Ch 13 Limitations, Hazards Instruction Issue Policy Register Renaming Branch Prediction 1 New dependency for superscalar case? (8) Name dependency (nimiriippuvuus) two use the same
Performance Impact of Multithreaded Java Server Applications
 Performance Impact of Multithreaded Java Server Applications Yue Luo, Lizy K. John Laboratory of Computer Architecture ECE Department University of Texas at Austin 1/2/01 1 Outline Motivation VolanoMark
Reorder Buffer Implementation (Pentium Pro) Reorder Buffer Implementation (Pentium Pro)
 Reorder Buffer Implementation (Pentium Pro)") Reorder Buffer Implementation (Pentium Pro) Hardware data structures retirement register file (RRF) (~ IBM 360/91 physical registers) physical register file that is the same size as the architectural registers
Reorder Buffer Implementation (Pentium Pro) Hardware data structures retirement register file (RRF) (~ IBM 360/91 physical registers) physical register file that is the same size as the architectural registers
Data Hazards Compiler Scheduling Pipeline scheduling or instruction scheduling: Compiler generates code to eliminate hazard
 Data Hazards Compiler Scheduling Pipeline scheduling or instruction scheduling: Compiler generates code to eliminate hazard Consider: a = b + c; d = e - f; Assume loads have a latency of one clock cycle:
CERN IT Technical Forum
 Evaluating program correctness and performance with new software tools from Intel Andrzej Nowak, CERN openlab March 18 th 2011 CERN IT Technical Forum > An introduction to the new generation of software
C152 Laboratory Exercise 3
 C152 Laboratory Exercise 3 Professor: Krste Asanovic TA: Christopher Celio Department of Electrical Engineering & Computer Science University of California, Berkeley March 7, 2011 1 Introduction and goals
Performance analysis basics
 Performance analysis basics Christian Iwainsky Iwainsky@rz.rwth-aachen.de 25.3.2010 1 Overview 1. Motivation 2. Performance analysis basics 3. Measurement Techniques 2 Why bother with performance analysis
Pentium IV-XEON. Computer architectures M
 Pentium IV-XEON Computer architectures M 1 Pentium IV block scheme 4 32 bytes parallel Four access ports to the EU 2 Pentium IV block scheme Address Generation Unit BTB Branch Target Buffer I-TLB Instruction
PowerPC 740 and 750
 368 floating-point registers. A reorder buffer with 16 elements is used as well to support speculative execution. The register file has 12 ports. Although instructions can be executed out-of-order, in-order
ProfileMe: Hardware-Support for Instruction-Level Profiling on Out-of-Order Processors
 ProfileMe: Hardware-Support for Instruction-Level Profiling on Out-of-Order Processors Jeffrey Dean Jamey Hicks Carl Waldspurger William Weihl George Chrysos Digital Equipment Corporation 1 Motivation
Memory Hierarchy Design (Appendix B and Chapter 2)
") CS359: Computer Architecture Memory Hierarchy Design (Appendix B and Chapter 2) Yanyan Shen Department of Computer Science and Engineering 1 Four Memory Hierarchy Questions Q1 (block placement): where
CS359: Computer Architecture Memory Hierarchy Design (Appendix B and Chapter 2) Yanyan Shen Department of Computer Science and Engineering 1 Four Memory Hierarchy Questions Q1 (block placement): where
Chapter 2. Parallel Hardware and Parallel Software. An Introduction to Parallel Programming. The Von Neuman Architecture
 An Introduction to Parallel Programming Peter Pacheco Chapter 2 Parallel Hardware and Parallel Software 1 The Von Neuman Architecture Control unit: responsible for deciding which instruction in a program
CPU Architecture Overview. Varun Sampath CIS 565 Spring 2012
 CPU Architecture Overview Varun Sampath CIS 565 Spring 2012 Objectives Performance tricks of a modern CPU Pipelining Branch Prediction Superscalar Out-of-Order (OoO) Execution Memory Hierarchy Vector Operations
EN164: Design of Computing Systems Topic 06.b: Superscalar Processor Design
 EN164: Design of Computing Systems Topic 06.b: Superscalar Processor Design Professor Sherief Reda http://scale.engin.brown.edu Electrical Sciences and Computer Engineering School of Engineering Brown
Pipelining concepts The DLX architecture A simple DLX pipeline Pipeline Hazards and Solution to overcome
 Thoai Nam Pipelining concepts The DLX architecture A simple DLX pipeline Pipeline Hazards and Solution to overcome Reference: Computer Architecture: A Quantitative Approach, John L Hennessy & David a Patterson,
In embedded systems there is a trade off between performance and power consumption. Using ILP saves power and leads to DECREASING clock frequency.
 Lesson 1 Course Notes Review of Computer Architecture Embedded Systems ideal: low power, low cost, high performance Overview of VLIW and ILP What is ILP? It can be seen in: Superscalar In Order Processors
Cache Memory COE 403. Computer Architecture Prof. Muhamed Mudawar. Computer Engineering Department King Fahd University of Petroleum and Minerals
 Cache Memory COE 403 Computer Architecture Prof. Muhamed Mudawar Computer Engineering Department King Fahd University of Petroleum and Minerals Presentation Outline The Need for Cache Memory The Basics
CS 426 Parallel Computing. Parallel Computing Platforms
 CS 426 Parallel Computing Parallel Computing Platforms Ozcan Ozturk http://www.cs.bilkent.edu.tr/~ozturk/cs426/ Slides are adapted from ``Introduction to Parallel Computing'' Topic Overview Implicit Parallelism:
Agenda. Optimization Notice Copyright 2017, Intel Corporation. All rights reserved. *Other names and brands may be claimed as the property of others.
 Agenda VTune Amplifier XE OpenMP* Analysis: answering on customers questions about performance in the same language a program was written in Concepts, metrics and technology inside VTune Amplifier XE OpenMP
EECC551 - Shaaban. 1 GHz? to???? GHz CPI > (?)
") Evolution of Processor Performance So far we examined static & dynamic techniques to improve the performance of single-issue (scalar) pipelined CPU designs including: static & dynamic scheduling, static
Evolution of Processor Performance So far we examined static & dynamic techniques to improve the performance of single-issue (scalar) pipelined CPU designs including: static & dynamic scheduling, static
NOW Handout Page 1. Review from Last Time #1. CSE 820 Graduate Computer Architecture. Lec 8 Instruction Level Parallelism. Outline
 CSE 820 Graduate Computer Architecture Lec 8 Instruction Level Parallelism Based on slides by David Patterson Review Last Time #1 Leverage Implicit Parallelism for Performance: Instruction Level Parallelism
Walking Four Machines by the Shore
 Walking Four Machines by the Shore Anastassia Ailamaki www.cs.cmu.edu/~natassa with Mark Hill and David DeWitt University of Wisconsin - Madison Workloads on Modern Platforms Cycles per instruction 3.0
Best Practices for Setting BIOS Parameters for Performance
 White Paper Best Practices for Setting BIOS Parameters for Performance Cisco UCS E5-based M3 Servers May 2013 2014 Cisco and/or its affiliates. All rights reserved. This document is Cisco Public. Page