Simplified and Effective Serial and Parallel Performance Optimization
|
|
|
- Vivian Ward
- 5 years ago
- Views:
Transcription
1 HPC Code Modernization Workshop at LRZ Simplified and Effective Serial and Parallel Performance Optimization Performance tuning Using Intel VTune Performance Profiler
2 Performance Tuning Methodology Goal: minimize the time it takes your program / module / function to execute Identify hotspots and focus on them Frequently: Just a few functions (20% of code take 80% of time ) Optimize these parts (with compiler or hand optimizations) Check for hotspots again, and find new ones How to optimize the hotspots? Maximize CPU utilization and/or minimize elapsed time Keep all cores busy with useful work: Optimal thread/task parallelism Most efficient code execution on each core: Best instructions level parallelism: e.g. 4 micro-instruction/cycle on Intel Core architecture SIMD-parallel ( packed SSE/AVX instructions) code instead of scalar code Minimize stalls caused by memory access Avoid long latency, non-pipelined instructions like division Optimal branch prediction - avoid bad speculation, no assists.. a lot more 2


3 Intel VTune Amplifier XE Supports for all Steps of a Systematic Performance Analysis Where is my application Spending Time? Wasting Time? Waiting Too Long? Focus tuning on functions taking time: Hotspots See call stacks See time on source See cache misses on your source See functions sorted by # of cache misses See locks by wait time Red/Green for CPU utilization during wait Windows & Linux Low overhead No special compiler requirements Advanced Profiling For Scalable Multicore Performance 3
4 Intel VTune Amplifier XE Tune Applications for Scalable Multicore Performance Fast, Accurate Performance Profiles Hotspot (Statistical call tree) Call counts (Statistical) Hardware-Event Sampling Thread Profiling Visualize thread interactions on timeline Balance workloads Easy set-up Pre-defined performance profiles Use a normal production build Find Answers Fast Filter extraneous data View results on the source / assembly Compatible Microsoft, GCC, Intel compilers C/C++, Fortran, Assembly,.NET, Java Latest Intel processors and compatible processors 1 Windows or Linux Visual Studio Integration (Windows) Standalone user i/f and command line 32 and 64-bit 1 IA32 and Intel 64 architectures. Many features work with compatible processors. Event based sampling requires a genuine Intel Processor. 4
5 Intel VTune Amplifier XE Feature Highlights Basic Hot Spot Analysis (Statistical Call Graph) Locates the time consuming regions of your application Provides associated call-stacks that let you know how you got to these time consuming regions Call-tree built using these call stacks Thread Profiling Visualize thread activity and lock transitions in the timeline Provides lock profiling capability Shows CPU/Core utilization and concurrency information Advanced Hotspot and Architecture Analysis Based on Hardware Event-based Sampling (EBS) Pre-defined tuning experiments General Exploration Analysis 5
")
![Click [+] for Call Stack Thread timeline Call stack Filter by](/docs-images/89/101171408/images/6-2.jpg "Timeline Selection (or by Grid Selection) Filter by Module & Other")
6 Hotspots analysis Hotspot functions Adjust Data Grouping Hotspot Functions Change Viewpoint Function CPU time (Partial list shown) Click [+] for Call Stack Thread timeline Call stack Filter by Timeline Selection (or by Grid Selection) Filter by Module & Other Controls 6

7 Hotspots analysis Source View Source View Assembly View Self and Total Time on Source / Asm Right click for instruction reference manual Quick Asm navigation: Select source to highlight Asm Click jump to scroll Asm Quickly scroll to hot spots. Scroll Bar Heat Map is an overview of hot spots 7
8 Thread Profiling Wait-, Overhead- and Spin Time Threading library internals Thread1 Waiting lib Thread1 Thread2 Waiting lib Thread2 Thread3 Waiting spinning Thread3 Overhead or spin Spin wait Thread running 1sec 1sec 1sec 1sec 1sec 1sec Thread waiting Elapsed Time: 6 seconds CPU Time: T1 (4s) + T2 (3s) + T3 (3s) = 10 seconds CPU Usage Wait Time: T1(2s) + T2(2s) + T3 (2s) = 6 seconds Overhead and spin time: T1(1s) + T2(1s) + T3(1s) = 3 s

9 Concurrency Analysis Bottom-Up view. CPU Usage CPU Usage Overhead Wait Overhead Thread is running Thread is waiting Thread Transitions 9
10 OpenMP* Performance Analysis A new feature in release
11 OpenMP Programming Model Fork-Join Parallelism: Master thread spawns a team of threads as needed OpenMP Team := Master + Workers Parallelism is added incrementally: that is, the sequential program evolves into a parallel program Master Thread Parallel Regions 5/7/
12 OpenMP Parallel RegionExample #pragma omp parallel // assume N=12 #pragma omp parallel #pragma omp for for(i = 1, i < N+1, i++) c[i] = a[i] + b[i]; #pragma omp for i = 1 i = 5 i = 2 i = 6 i = 3 i = 7 i = 4 i = 8 i = 9 i = 10 i = 11 i = 12 Implicit barrier Threads are assigned an independent set of iterations Threads must wait at the end of worksharing construct 5/7/
13 VTune Amplifier XE/OpenMP Analysis Enhancing OpenMP analysis with a set of metrics to answer the following questions: Is serial time of my application significant to prevent scaling? How efficient is my OpenMP parallelization? How much gain I can take if invest in reducing load imbalance/overhead? What regions are more perspective to invest? Metrics are based on elapsed time direct improvement possibilities on application wall clock time 13
14 VTune - OpenMP* Analysis Serial time: time spent by the application outside any OpenMP* region in the master thread during collection: Fork Elapsed time - [Elapsed time of all Parallel regions] Effective CPU time of a Parallel Region Instance: ([CPU time] [Spin Time] [Overhead Time]) where CPU, Spin and Overhead time aggregated by threads in the Region instance Estimated Ideal time of a Region Instance: [Effective CPU time ] / [Number of Threads] Potential Gain of a Parallel Region Instance: [Region Instance Elapsed Time] [Estimated Ideal Time of the Region Instance] Potential Gain of a Region: [Potential Gain of all instances of a Region] Region Instance Elapsed Time Estimated Ideal time of a Region Instance: [Effective CPU time] / [Number of OpenMP Threads] Join Effective CPU time Spin (busy wait Imbalance, Lock Contention) Passive wait (Not consuming CPU) Overhead (Creation, Scheduling, Reduction) Potential Gain Potential Gain of a Program: [Potential Gain of all Regions] 14

15 VTune Amplifier XE/OpenMP Analysis Tracing of OpenMP is used to provide region/work sharing context - Provided to VTune by Intel OpenMP Runtime: Fork-Join time points of parallel regions with number of working threads - Overhead of tracing can be substantial used carefully per region instance on region forkjoin points Sampling to determine different kinds of overhead, synchronization spinning etc. - Any type of VTune analysis that support CPU time calculation (such as hotspots, advanced-hotspots with or without stacks, etc.) 15

16 VTune Amplifier XE/OpenMP Analysis Metrics in Summary 16


17 VTune Amplifier XE/OpenMP Analysis Metrics in Grid Improved CPU time hierarchy The potential gain metric can be more important than CPU or elapsed time, because it doesn t focus on the top time consuming region, it focuses on the region where you get the maximum results from tuning OpenMP Regions marked in timeline pane 17
18 VTune Amplifier XE/OpenMP Analysis Drilldown to region source from grid Region/.. grouping 18

19 VTune Amplifier XE/OpenMP Analysis Interpreting OpenMP Analysis Data Executing serial code Scenario Find ways to minimize the serial execution sections by either introducing more parallelism or by doing algorithm or microarchitecture tuning for the sections that seem unavoidably serial For high core count machines serial sections have a severe negative impact on potential scaling and should be minimized as much as possible. 19


20 VTune Amplifier XE/OpenMP Analysis Interpreting OpenMP Analysis Data Synchronization objects and waiting time Scenario Big Potential Gain Spin Time: Both Load Imbalance and Lock Contention Try to avoid synchronization inside regions by using an OpenMP reduction, omp atomic construct or thread local storage where possible To detect what particular synchronization object causes the problem, collect a Locks and Waits analysis 20


21 VTune Amplifier XE/OpenMP Analysis Interpreting OpenMP Analysis Data Load imbalance Scenario Notice the significant potential gain 1.061s from overall 5.561s, this means there is room for improvement 21

22 VTune Amplifier XE/OpenMP Analysis Interpreting OpenMP Analysis Data A well-balanced parallel region Scenario All threads are busy, no overhead or spinning (no red color) Potential gain is small Majority of CPU time is effective This doesn t mean that everything is perfect, e.g. there may be micro-architectural issues etc. but there are no issues indicated in OpenMP with thread-based parallelism and load balancing 22
23 Advanced Hotspot and Architecture Analysis Using Performance Monitoring Events


24 4 th Generation Intel Core Micro Architecture To Uncore 256K L2 Unified Cache 32K L1 Instruction Cache BPU Legacy Decode Pipeline Decoded ICache MSROM micro-op queue 4 UOPS_ISSUED Line Fill Buffers 32K L1 Data Cache Load Data Store Address Store data Store Address Allocate/ Rename/ Retirement Front End Out Of Order Execution Caches ALU Shift Logical X87 MUL X87 DIV SIMD ALU SIMD MUL SIMD Shift SIMD Logical FMA Branch UOPS_EXECUTED Scheduler INT / AVX/ SSE / X87 Register Stacks Load buff Store buff Reorder buff UOPS_RETIRED 4 24
25 Performance Monitoring Unit (PMU) Available in all Intel processor: Core and Uncore to watch Events 1000s of Events in current CPU generation Performance counters can be programmed to count Events through specific MSRs Events can be divided into the following categories, depending on how they are collected and interpreted: Fixed events Programmable events Precise events 25
26 Performance Monitoring Unit Performance counters Core performance monitoring of CPU of IVB-HSW generations Each core has 8 counters; 4 per thread with SMT Measure 7 performance events at a time (4 Programmable, 3 Fixed) Same in mobile and server CPU lines Measure Uncore events in addition to Core events Distributed design with separate blocks of counters in different architectural units (MC, LLC, GT, etc.) Mobile and server lines have different designs Not thread-specific. Thread-specific counting can only be done in the core The event names change for each processor generation, but the performance analysis concepts stay the same! 26
27 Performance Monitoring Unit Event Names PMU events of Core architecture are typically qualified by one or more masks (qualifier, U-Mask) which create sub-events from main events via a dot-notation (setting the k bits in the control register). Example: MEM_UOPS_RETIRED.SPLIT_LOADS_PS MEM: an event related to memory subsystem UOPS_RETIRED: counts number of retired µops SPLIT_LOADS: load µops that split cache line PS: precise event Thus this events counts: The number of line-split load uops retired and in total 14 sub-events for the main event MEM_UOPS_RETIRED exist (including PS versions) 27
28 Event Based Performance Analysis Event-based Sampling (EBS) Processor events can be monitored using sampling and counting technologies Sampling: Allows to profile all active software on the system, including operating system, device driver, and application software Sample - a HW interruption happens when a N of Events counted N is programmable In a sample we automatically collect: o Thread and process ID's o Load module o Instruction Pointer (IP) Instruction pointer is then used to derive the function name and source line number from the debug information created at compile time 28
29 How Event-based Sampling works Core Core CPU Core Core processor interrupts by PMU when Counter = N Thread Cnt= 1 2 N 2N 3N 4N Save execution context and performance data An Event occurrences N = Sample after value Events = samples * sample after value At the end of sampling session we get statistical snapshot of the system where we can see how many and what samples collected by each active module (binary) how many and what samples collected by each function in a module how many and what samples collected by specific instruction 29
![How to use Event Based Sampling VTune Amplifier XE From Intel Atom to Intel Xeon and Xeon Phi processors family support is in VTune Amplifier XE VTune Amplifier XE for EBS Driver[less] based](/docs-images/89/101171408/images/30-1.jpg "collection Driver SDK for unsupported Linux OS es Several predefined profiles Advanced Hotspots General Exploration Memory Access Bandwidth Timeline View Integrated into all Analysis Types")
30 How to use Event Based Sampling VTune Amplifier XE From Intel Atom to Intel Xeon and Xeon Phi processors family support is in VTune Amplifier XE VTune Amplifier XE for EBS Driver[less] based collection Driver SDK for unsupported Linux OS es Several predefined profiles Advanced Hotspots General Exploration Memory Access Bandwidth Timeline View Integrated into all Analysis Types Source/Assembly Viewing Compatible with C/C++, Fortran, Assembly, Java,.NET C# Command-line, or Standalone interface for Windows* or Linux*, 32- or 64-bit 30
31 Systematically Determine the (Primary) Bottleneck A Top-Down hierarchy implemented by the General Exploration classifies the application s utilization of the CPU cores on the top level into 4 categories: Front-End Bound Back-End Bound Bad Speculation Retiring The metric of CPU core utilization is what is being done in each cycle for each of the potentially 4 micro operation slots ( pipeline slots ) The Core architecture can execute up to 4 u-ops per cycle! The primary bottleneck has the highest fraction of pipeline slots, and should be investigated first! 31
32 Simplified Pipeline Flow Front-End Back-End Fetch & Decode Instructions, Predict Branches µ-op µ-op µ-op µ-op Execution Core Re-Order & Execute Instructions, Retire Retirement Commit Results to Memory UOPS_ISSUED UOPS_EXECUTED UOPS_RETIRED 32
33 Bottleneck Domain Performance is classified according to what happened for each slot available to the application or hotspot: Micro-ops Issued? No Allocation Stall? Yes Micro-op ever Retire? No Yes No Yes FE Bound BE Bound Bad Speculation Retiring Back-End not stalled and Memory accesses, Speculative execution Successful of retirement Front-End delivers Less execution, dispatch instructions and needs to path be length consumes than 4 micro-ops / cycle allocation bottlenecks reverted cycles 33
34 Bottleneck Domain Transparently, VTune uses the following events & ratios to detect the cycles slots belonging to each of the 4 domains: BE_Bound =1 - (FE_Bound + Retiring + Bad_Speculation) Bad_Speculation =(UOPS_ISSUED.ANY-UOPS_RETIRED.RETIRE_SLOTS) / N Memory issues Execution issues FE_Bound =IDQ_UOPS_NOT_DELIVERED.CORE / N Retiring = UOPS_RETIRED.RETIRE_SLOTS / N Since the width of the pipe is 4 slots at key stages: N = 4 * CPU_CLK_UNHALTED.THREAD

35 General Exploration View: Top Level

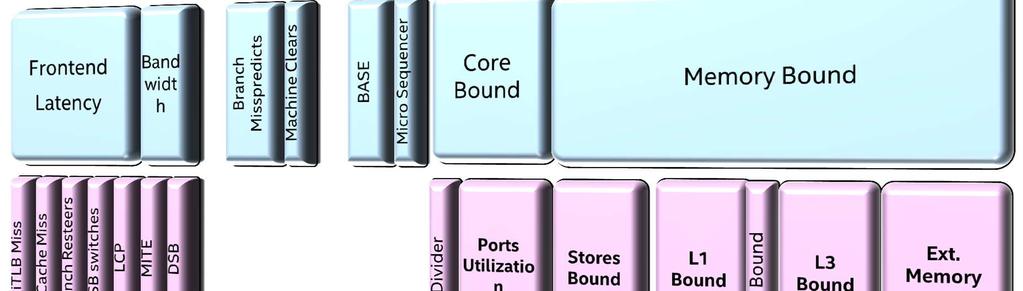

36 Top Down Approach 36


37 Example: Top-Down with a Memory Bound Issue Drill Down DRAM Bound Function

38 Not only in VTune: General Exploration in Open- Source PMU-Tools Open-source tool from Andi Kleene see contains a lot of interesting references for more details too 38
39 Links for General Exploration Analysis Whitepaper How to Tune Applications Using a Top-down Characterization of Microarchitectural Issues : Tools VTune Amplifier XE 2015 Basic support in PBA Performance Bottleneck Analyzer ocperf / toplev A wrapper on top of the Linux perf utility Tutorial on Analysis Methodologies and Tools ISCA `
40 Summary The Intel VTune Amplifier XE can be used to find: Source code for performance bottlenecks Characterize the amount of parallelism in an application Determine which synchronization locks or APIs are limiting the parallelism in an application Understand problems limiting CPU instruction level parallelism Instrument user code for better understanding of execution flow defined by threading runtimes 40

41 Questions? 41
42 Legal Disclaimer & INFORMATION IN THIS DOCUMENT IS PROVIDED AS IS. NO LICENSE, EXPRESS OR IMPLIED, BY ESTOPPEL OR OTHERWISE, TO ANY INTELLECTUAL PROPERTY RIGHTS IS GRANTED BY THIS DOCUMENT. INTEL ASSUMES NO LIABILITY WHATSOEVER AND INTEL DISCLAIMS ANY EXPRESS OR IMPLIED WARRANTY, RELATING TO THIS INFORMATION INCLUDING LIABILITY OR WARRANTIES RELATING TO FITNESS FOR A PARTICULAR PURPOSE, MERCHANTABILITY, OR INFRINGEMENT OF ANY PATENT, COPYRIGHT OR OTHER INTELLECTUAL PROPERTY RIGHT. Software and workloads used in performance tests may have been optimized for performance only on Intel microprocessors. Performance tests, such as SYSmark and MobileMark, are measured using specific computer systems, components, software, operations and functions. Any change to any of those factors may cause the results to vary. You should consult other information and performance tests to assist you in fully evaluating your contemplated purchases, including the performance of that product when combined with other products. Copyright 2014, Intel Corporation. All rights reserved. Intel, Pentium, Xeon, Xeon Phi, Core, VTune, Cilk, and the Intel logo are trademarks of Intel Corporation in the U.S. and other countries. Intel s compilers may or may not optimize to the same degree for non-intel microprocessors for optimizations that are not unique to Intel microprocessors. These optimizations include SSE2, SSE3, and SSSE3 instruction sets and other optimizations. Intel does not guarantee the availability, functionality, or effectiveness of any optimization on microprocessors not manufactured by Intel. Microprocessor-dependent optimizations in this product are intended for use with Intel microprocessors. Certain optimizations not specific to Intel microarchitecture are reserved for Intel microprocessors. Please refer to the applicable product User and Reference Guides for more information regarding the specific instruction sets covered by this notice. Notice revision #

43

44 VTune Amplifier XE/OpenMP Analysis 1 There are several major reasons why working threads wait: When the master thread is executing a serial region, the worker threads are in the OpenMP runtime waiting for the next parallel region barrier 2 3 When synchronization objects are used inside a parallel region, threads can wait on a lock release, contending with other threads for a shared resource (Synchronization on locks) When a thread finishes a parallel region, it waits at a barrier for the other threads to finish. (Load imbalance) The number of loop iterations < the number of working threads so several threads from the team are waiting at the barrier not doing useful work at all (Not enough parallel work)
Agenda. Optimization Notice Copyright 2017, Intel Corporation. All rights reserved. *Other names and brands may be claimed as the property of others.
 Agenda VTune Amplifier XE OpenMP* Analysis: answering on customers questions about performance in the same language a program was written in Concepts, metrics and technology inside VTune Amplifier XE OpenMP
Using Intel VTune Amplifier XE and Inspector XE in.net environment
 Using Intel VTune Amplifier XE and Inspector XE in.net environment Levent Akyil Technical Computing, Analyzers and Runtime Software and Services group 1 Refresher - Intel VTune Amplifier XE Intel Inspector
Intel VTune Amplifier XE
 Intel VTune Amplifier XE Vladimir Tsymbal Performance, Analysis and Threading Lab 1 Agenda Intel VTune Amplifier XE Overview Features Data collectors Analysis types Key Concepts Collecting performance
Performance Profiler. Klaus-Dieter Oertel Intel-SSG-DPD IT4I HPC Workshop, Ostrava,
 Performance Profiler Klaus-Dieter Oertel Intel-SSG-DPD IT4I HPC Workshop, Ostrava, 08-09-2016 Faster, Scalable Code, Faster Intel VTune Amplifier Performance Profiler Get Faster Code Faster With Accurate
Revealing the performance aspects in your code
 Revealing the performance aspects in your code 1 Three corner stones of HPC The parallelism can be exploited at three levels: message passing, fork/join, SIMD Hyperthreading is not quite threading A popular
Intel VTune Amplifier XE. Dr. Michael Klemm Software and Services Group Developer Relations Division
 Intel VTune Amplifier XE Dr. Michael Klemm Software and Services Group Developer Relations Division Legal Disclaimer & Optimization Notice INFORMATION IN THIS DOCUMENT IS PROVIDED AS IS. NO LICENSE, EXPRESS
Microarchitectural Analysis with Intel VTune Amplifier XE
 Microarchitectural Analysis with Intel VTune Amplifier XE Michael Klemm Software & Services Group Developer Relations Division 1 Legal Disclaimer INFORMATION IN THIS DOCUMENT IS PROVIDED IN CONNECTION
Intel Xeon Phi Coprocessor Performance Analysis
 Intel Xeon Phi Coprocessor Performance Analysis Legal Disclaimer INFORMATION IN THIS DOCUMENT IS PROVIDED IN CONNECTION WITH INTEL PRODUCTS. NO LICENSE, EXPRESS OR IMPLIED, BY ESTOPPEL OR OTHERWISE, TO
Bei Wang, Dmitry Prohorov and Carlos Rosales
 Bei Wang, Dmitry Prohorov and Carlos Rosales Aspects of Application Performance What are the Aspects of Performance Intel Hardware Features Omni-Path Architecture MCDRAM 3D XPoint Many-core Xeon Phi AVX-512
Tutorial: Finding Hotspots with Intel VTune Amplifier - Linux* Intel VTune Amplifier Legal Information
 Tutorial: Finding Hotspots with Intel VTune Amplifier - Linux* Intel VTune Amplifier Legal Information Tutorial: Finding Hotspots with Intel VTune Amplifier - Linux* Contents Legal Information... 3 Chapter
Jackson Marusarz Intel Corporation
 Jackson Marusarz Intel Corporation Intel VTune Amplifier Quick Introduction Get the Data You Need Hotspot (Statistical call tree), Call counts (Statistical) Thread Profiling Concurrency and Lock & Waits
Intel Advisor XE Future Release Threading Design & Prototyping Vectorization Assistant
 Intel Advisor XE Future Release Threading Design & Prototyping Vectorization Assistant Parallel is the Path Forward Intel Xeon and Intel Xeon Phi Product Families are both going parallel Intel Xeon processor
OpenMP * 4 Support in Clang * / LLVM * Andrey Bokhanko, Intel
 OpenMP * 4 Support in Clang * / LLVM * Andrey Bokhanko, Intel Clang * : An Excellent C++ Compiler LLVM * : Collection of modular and reusable compiler and toolchain technologies Created by Chris Lattner
2
 1 2 3 4 5 6 For more information, see http://www.intel.com/content/www/us/en/processors/core/core-processorfamily.html 7 8 The logic for identifying issues on Intel Microarchitecture Codename Ivy Bridge
Achieving High Performance. Jim Cownie Principal Engineer SSG/DPD/TCAR Multicore Challenge 2013
 Achieving High Performance Jim Cownie Principal Engineer SSG/DPD/TCAR Multicore Challenge 2013 Does Instruction Set Matter? We find that ARM and x86 processors are simply engineering design points optimized
Performance Analysis using Intel VTune Amplifier XE
 Performance Analysis using Intel VTune Amplifier XE Performance methodology profiling and tuning The Goal: minimize the time it takes your program / module / function to execute Identify Hotspots and focus
Intel VTune Amplifier XE for Tuning of HPC Applications Intel Software Developer Conference Frankfurt, 2017 Klaus-Dieter Oertel, Intel
 Intel VTune Amplifier XE for Tuning of HPC Applications Intel Software Developer Conference Frankfurt, 2017 Klaus-Dieter Oertel, Intel Agenda Which performance analysis tool should I use first? Intel Application
Profiling: Understand Your Application
 Profiling: Understand Your Application Michal Merta michal.merta@vsb.cz 1st of March 2018 Agenda Hardware events based sampling Some fundamental bottlenecks Overview of profiling tools perf tools Intel
Graphics Performance Analyzer for Android
 Graphics Performance Analyzer for Android 1 What you will learn from this slide deck Detailed optimization workflow of Graphics Performance Analyzer Android* System Analysis Only Please see subsequent
Getting Started with Intel SDK for OpenCL Applications
 Getting Started with Intel SDK for OpenCL Applications Webinar #1 in the Three-part OpenCL Webinar Series July 11, 2012 Register Now for All Webinars in the Series Welcome to Getting Started with Intel
Visualizing and Finding Optimization Opportunities with Intel Advisor Roofline feature. Intel Software Developer Conference London, 2017
 Visualizing and Finding Optimization Opportunities with Intel Advisor Roofline feature Intel Software Developer Conference London, 2017 Agenda Vectorization is becoming more and more important What is
Kirill Rogozhin. Intel
 Kirill Rogozhin Intel From Old HPC principle to modern performance model Old HPC principles: 1. Balance principle (e.g. Kung 1986) hw and software parameters altogether 2. Compute Density, intensity, machine
Crosstalk between VMs. Alexander Komarov, Application Engineer Software and Services Group Developer Relations Division EMEA
 Crosstalk between VMs Alexander Komarov, Application Engineer Software and Services Group Developer Relations Division EMEA 2 September 2015 Legal Disclaimer & Optimization Notice INFORMATION IN THIS DOCUMENT
Munara Tolubaeva Technical Consulting Engineer. 3D XPoint is a trademark of Intel Corporation in the U.S. and/or other countries.
 Munara Tolubaeva Technical Consulting Engineer 3D XPoint is a trademark of Intel Corporation in the U.S. and/or other countries. notices and disclaimers Intel technologies features and benefits depend
Using Intel VTune Amplifier XE for High Performance Computing
 Using Intel VTune Amplifier XE for High Performance Computing Vladimir Tsymbal Performance, Analysis and Threading Lab 1 The Majority of all HPC-Systems are Clusters Interconnect I/O I/O... I/O I/O Message
Efficiently Introduce Threading using Intel TBB
 Introduction This guide will illustrate how to efficiently introduce threading using Intel Threading Building Blocks (Intel TBB), part of Intel Parallel Studio XE. It is a widely used, award-winning C++
MICHAL MROZEK ZBIGNIEW ZDANOWICZ
 MICHAL MROZEK ZBIGNIEW ZDANOWICZ Legal Notices and Disclaimers INFORMATION IN THIS DOCUMENT IS PROVIDED IN CONNECTION WITH INTEL PRODUCTS. NO LICENSE, EXPRESS OR IMPLIED, BY ESTOPPEL OR OTHERWISE, TO ANY
Memory & Thread Debugger
 Memory & Thread Debugger Here is What Will Be Covered Overview Memory/Thread analysis New Features Deep dive into debugger integrations Demo Call to action Intel Confidential 2 Analysis Tools for Diagnosis
Vectorization Advisor: getting started
 Vectorization Advisor: getting started Before you analyze Run GUI or Command Line Set-up environment Linux: source /advixe-vars.sh Windows: \advixe-vars.bat Run GUI or Command
Повышение энергоэффективности мобильных приложений путем их распараллеливания. Примеры. Владимир Полин
 Повышение энергоэффективности мобильных приложений путем их распараллеливания. Примеры. Владимир Полин Legal Notices This presentation is for informational purposes only. INTEL MAKES NO WARRANTIES, EXPRESS
Achieving Peak Performance on Intel Hardware. Intel Software Developer Conference London, 2017
 Achieving Peak Performance on Intel Hardware Intel Software Developer Conference London, 2017 Welcome Aims for the day You understand some of the critical features of Intel processors and other hardware
Intel Parallel Studio XE 2015
 2015 Create faster code faster with this comprehensive parallel software development suite. Faster code: Boost applications performance that scales on today s and next-gen processors Create code faster:
What's new in VTune Amplifier XE
 What's new in VTune Amplifier XE Naftaly Shalev Software and Services Group Developer Products Division 1 Agenda What s New? Using VTune Amplifier XE 2013 on Xeon Phi coprocessors New and Experimental
Getting Started Tutorial: Finding Hotspots
 Getting Started Tutorial: Finding Hotspots Intel VTune Amplifier XE 2013 for Windows* OS Fortran Sample Application Code Document Number: 327358-001 Legal Information Contents Contents Legal Information...5
Parallel Programming Features in the Fortran Standard. Steve Lionel 12/4/2012
 Parallel Programming Features in the Fortran Standard Steve Lionel 12/4/2012 Agenda Overview of popular parallelism methodologies FORALL a look back DO CONCURRENT Coarrays Fortran 2015 Q+A 12/5/2012 2
Kevin O Leary, Intel Technical Consulting Engineer
 Kevin O Leary, Intel Technical Consulting Engineer Moore s Law Is Going Strong Hardware performance continues to grow exponentially We think we can continue Moore's Law for at least another 10 years."
What s New August 2015
 What s New August 2015 Significant New Features New Directory Structure OpenMP* 4.1 Extensions C11 Standard Support More C++14 Standard Support Fortran 2008 Submodules and IMPURE ELEMENTAL Further C Interoperability
H.J. Lu, Sunil K Pandey. Intel. November, 2018
 H.J. Lu, Sunil K Pandey Intel November, 2018 Issues with Run-time Library on IA Memory, string and math functions in today s glibc are optimized for today s Intel processors: AVX/AVX2/AVX512 FMA It takes
A Simple Path to Parallelism with Intel Cilk Plus
 Introduction This introductory tutorial describes how to use Intel Cilk Plus to simplify making taking advantage of vectorization and threading parallelism in your code. It provides a brief description
Jim Cownie, Johnny Peyton with help from Nitya Hariharan and Doug Jacobsen
 Jim Cownie, Johnny Peyton with help from Nitya Hariharan and Doug Jacobsen Features We Discuss Synchronization (lock) hints The nonmonotonic:dynamic schedule Both Were new in OpenMP 4.5 May have slipped
Eliminate Threading Errors to Improve Program Stability
 Introduction This guide will illustrate how the thread checking capabilities in Intel Parallel Studio XE can be used to find crucial threading defects early in the development cycle. It provides detailed
IFS RAPS14 benchmark on 2 nd generation Intel Xeon Phi processor
 IFS RAPS14 benchmark on 2 nd generation Intel Xeon Phi processor D.Sc. Mikko Byckling 17th Workshop on High Performance Computing in Meteorology October 24 th 2016, Reading, UK Legal Disclaimer & Optimization
Intel Architecture for Software Developers
 Intel Architecture for Software Developers 1 Agenda Introduction Processor Architecture Basics Intel Architecture Intel Core and Intel Xeon Intel Atom Intel Xeon Phi Coprocessor Use Cases for Software
Using the Intel VTune Amplifier 2013 on Embedded Platforms
 Using the Intel VTune Amplifier 2013 on Embedded Platforms Introduction This guide explains the usage of the Intel VTune Amplifier for performance and power analysis on embedded devices. Overview VTune
Expressing and Analyzing Dependencies in your C++ Application
 Expressing and Analyzing Dependencies in your C++ Application Pablo Reble, Software Engineer Developer Products Division Software and Services Group, Intel Agenda TBB and Flow Graph extensions Composable
Optimize Data Structures and Memory Access Patterns to Improve Data Locality
 Optimize Data Structures and Memory Access Patterns to Improve Data Locality Abstract Cache is one of the most important resources
This guide will show you how to use Intel Inspector XE to identify and fix resource leak errors in your programs before they start causing problems.
 Introduction A resource leak refers to a type of resource consumption in which the program cannot release resources it has acquired. Typically the result of a bug, common resource issues, such as memory
Jackson Marusarz Software Technical Consulting Engineer
 Jackson Marusarz Software Technical Consulting Engineer What Will Be Covered Overview Memory/Thread analysis New Features Deep dive into debugger integrations Demo Call to action 2 Analysis Tools for Diagnosis
IXPUG 16. Dmitry Durnov, Intel MPI team
 IXPUG 16 Dmitry Durnov, Intel MPI team Agenda - Intel MPI 2017 Beta U1 product availability - New features overview - Competitive results - Useful links - Q/A 2 Intel MPI 2017 Beta U1 is available! Key
Eliminate Threading Errors to Improve Program Stability
 Eliminate Threading Errors to Improve Program Stability This guide will illustrate how the thread checking capabilities in Parallel Studio can be used to find crucial threading defects early in the development
More performance options
 More performance options OpenCL, streaming media, and native coding options with INDE April 8, 2014 2014, Intel Corporation. All rights reserved. Intel, the Intel logo, Intel Inside, Intel Xeon, and Intel
Getting Started Tutorial: Finding Hotspots
 Getting Started Tutorial: Finding Hotspots Intel VTune Amplifier XE 2013 for Linux* OS Fortran Sample Application Code Document Number: 327359-001 Legal Information Contents Contents Legal Information...5
Growth in Cores - A well rehearsed story
 Intel CPUs Growth in Cores - A well rehearsed story 2 1. Multicore is just a fad! Copyright 2012, Intel Corporation. All rights reserved. *Other brands and names are the property of their respective owners.
Intel Software Development Products Licensing & Programs Channel EMEA
 Intel Software Development Products Licensing & Programs Channel EMEA Intel Software Development Products Advanced Performance Distributed Performance Intel Software Development Products Foundation of
Using Intel Inspector XE 2011 with Fortran Applications
 Using Intel Inspector XE 2011 with Fortran Applications Jackson Marusarz Intel Corporation Legal Disclaimer INFORMATION IN THIS DOCUMENT IS PROVIDED IN CONNECTION WITH INTEL PRODUCTS. NO LICENSE, EXPRESS
Installation Guide and Release Notes
 Intel Parallel Studio XE 2013 for Linux* Installation Guide and Release Notes Document number: 323804-003US 10 March 2013 Table of Contents 1 Introduction... 1 1.1 What s New... 1 1.1.1 Changes since Intel
Alexei Katranov. IWOCL '16, April 21, 2016, Vienna, Austria
 Alexei Katranov IWOCL '16, April 21, 2016, Vienna, Austria Hardware: customization, integration, heterogeneity Intel Processor Graphics CPU CPU CPU CPU Multicore CPU + integrated units for graphics, media
Visualizing and Finding Optimization Opportunities with Intel Advisor Roofline feature
 Visualizing and Finding Optimization Opportunities with Intel Advisor Roofline feature Intel Software Developer Conference Frankfurt, 2017 Klaus-Dieter Oertel, Intel Agenda Intel Advisor for vectorization
Tutorial: Analyzing MPI Applications. Intel Trace Analyzer and Collector Intel VTune Amplifier XE
 Tutorial: Analyzing MPI Applications Intel Trace Analyzer and Collector Intel VTune Amplifier XE Contents Legal Information... 3 1. Overview... 4 1.1. Prerequisites... 5 1.1.1. Required Software... 5 1.1.2.
Obtaining the Last Values of Conditionally Assigned Privates
 Obtaining the Last Values of Conditionally Assigned Privates Hideki Saito, Serge Preis*, Aleksei Cherkasov, Xinmin Tian Intel Corporation (* at submission time) 2016/10/04 OpenMPCon2016 Legal Disclaimer
Intel Parallel Studio XE 2011 for Windows* Installation Guide and Release Notes
 Intel Parallel Studio XE 2011 for Windows* Installation Guide and Release Notes Document number: 323803-001US 4 May 2011 Table of Contents 1 Introduction... 1 1.1 What s New... 2 1.2 Product Contents...
Intel tools for High Performance Python 데이터분석및기타기능을위한고성능 Python
 Intel tools for High Performance Python 데이터분석및기타기능을위한고성능 Python Python Landscape Adoption of Python continues to grow among domain specialists and developers for its productivity benefits Challenge#1:
Mikhail Dvorskiy, Jim Cownie, Alexey Kukanov
 Mikhail Dvorskiy, Jim Cownie, Alexey Kukanov What is the Parallel STL? C++17 C++ Next An extension of the C++ Standard Template Library algorithms with the execution policy argument Support for parallel
Intel Parallel Studio XE 2011 SP1 for Linux* Installation Guide and Release Notes
 Intel Parallel Studio XE 2011 SP1 for Linux* Installation Guide and Release Notes Document number: 323804-002US 21 June 2012 Table of Contents 1 Introduction... 1 1.1 What s New... 1 1.2 Product Contents...
Intel Xeon Phi Coprocessor. Technical Resources. Intel Xeon Phi Coprocessor Workshop Pawsey Centre & CSIRO, Aug Intel Xeon Phi Coprocessor
 Technical Resources Legal Disclaimer INFORMATION IN THIS DOCUMENT IS PROVIDED IN CONNECTION WITH INTEL PRODUCTS. NO LICENSE, EXPRESS OR IMPLIED, BY ESTOPPEL OR OTHERWISE, TO ANY INTELLECTUAL PROPETY RIGHTS
Bitonic Sorting Intel OpenCL SDK Sample Documentation
 Intel OpenCL SDK Sample Documentation Document Number: 325262-002US Legal Information INFORMATION IN THIS DOCUMENT IS PROVIDED IN CONNECTION WITH INTEL PRODUCTS. NO LICENSE, EXPRESS OR IMPLIED, BY ESTOPPEL
Performance analysis tools: Intel VTuneTM Amplifier and Advisor. Dr. Luigi Iapichino
 Performance analysis tools: Intel VTuneTM Amplifier and Advisor Dr. Luigi Iapichino luigi.iapichino@lrz.de Which tool do I use in my project? A roadmap to optimisation After having considered the MPI layer,
Intel Advisor XE. Vectorization Optimization. Optimization Notice
 Intel Advisor XE Vectorization Optimization 1 Performance is a Proven Game Changer It is driving disruptive change in multiple industries Protecting buildings from extreme events Sophisticated mechanics
Tools for Intel Xeon Phi: VTune & Advisor Dr. Fabio Baruffa - LRZ,
 Tools for Intel Xeon Phi: VTune & Advisor Dr. Fabio Baruffa - fabio.baruffa@lrz.de LRZ, 27.6.- 29.6.2016 Architecture Overview Intel Xeon Processor Intel Xeon Phi Coprocessor, 1st generation Intel Xeon
Intel Threading Tools
 Intel Threading Tools Paul Petersen, Intel -1- INFORMATION IN THIS DOCUMENT IS PROVIDED IN CONNECTION WITH INTEL PRODUCTS. EXCEPT AS PROVIDED IN INTEL'S TERMS AND CONDITIONS OF SALE FOR SUCH PRODUCTS,
Overview of Intel Parallel Studio XE
 Overview of Intel Parallel Studio XE Stephen Blair-Chappell 1 30-second pitch Intel Parallel Studio XE 2011 Advanced Application Performance What Is It? Suite of tools to develop high performing, robust
Bitonic Sorting. Intel SDK for OpenCL* Applications Sample Documentation. Copyright Intel Corporation. All Rights Reserved
 Intel SDK for OpenCL* Applications Sample Documentation Copyright 2010 2012 Intel Corporation All Rights Reserved Document Number: 325262-002US Revision: 1.3 World Wide Web: http://www.intel.com Document
Intel Parallel Amplifier Sample Code Guide
 The analyzes the performance of your application and provides information on the performance bottlenecks in your code. It enables you to focus your tuning efforts on the most critical sections of your
Intel Many Integrated Core (MIC) Architecture
 Architecture") Intel Many Integrated Core (MIC) Architecture Karl Solchenbach Director European Exascale Labs BMW2011, November 3, 2011 1 Notice and Disclaimers Notice: This document contains information on products
Intel Many Integrated Core (MIC) Architecture Karl Solchenbach Director European Exascale Labs BMW2011, November 3, 2011 1 Notice and Disclaimers Notice: This document contains information on products
Jomar Silva Technical Evangelist
 Jomar Silva Technical Evangelist Agenda Introduction Intel Graphics Performance Analyzers: what is it, where do I get it, and how do I use it? Intel GPA with VR What devices can I use Intel GPA with and
Stanislav Bratanov; Roman Belenov; Ludmila Pakhomova 4/27/2015
 Stanislav Bratanov; Roman Belenov; Ludmila Pakhomova 4/27/2015 What is Intel Processor Trace? Intel Processor Trace (Intel PT) provides hardware a means to trace branching, transaction, and timing information
Performance Tuning VTune Performance Analyzer
 Performance Tuning VTune Performance Analyzer Paul Petersen, Intel Sept 9, 2005 Copyright 2005 Intel Corporation Performance Tuning Overview Methodology Benchmarking Timing VTune Counter Monitor Call Graph
Eliminate Memory Errors to Improve Program Stability
 Introduction INTEL PARALLEL STUDIO XE EVALUATION GUIDE This guide will illustrate how Intel Parallel Studio XE memory checking capabilities can find crucial memory defects early in the development cycle.
Sample for OpenCL* and DirectX* Video Acceleration Surface Sharing
 Sample for OpenCL* and DirectX* Video Acceleration Surface Sharing User s Guide Intel SDK for OpenCL* Applications Sample Documentation Copyright 2010 2013 Intel Corporation All Rights Reserved Document
Collecting OpenCL*-related Metrics with Intel Graphics Performance Analyzers
 Collecting OpenCL*-related Metrics with Intel Graphics Performance Analyzers Collecting Important OpenCL*-related Metrics with Intel GPA System Analyzer Introduction Intel SDK for OpenCL* Applications
Becca Paren Cluster Systems Engineer Software and Services Group. May 2017
 Becca Paren Cluster Systems Engineer Software and Services Group May 2017 Clusters are complex systems! Challenge is to reduce this complexity barrier for: Cluster architects System administrators Application
What s P. Thierry
 What s new@intel P. Thierry Principal Engineer, Intel Corp philippe.thierry@intel.com CPU trend Memory update Software Characterization in 30 mn 10 000 feet view CPU : Range of few TF/s and
Using Intel Transactional Synchronization Extensions
 Using Intel Transactional Synchronization Extensions Dr.-Ing. Michael Klemm Software and Services Group michael.klemm@intel.com 1 Credits The Tutorial Gang Christian Terboven Michael Klemm Ruud van der
LIBXSMM Library for small matrix multiplications. Intel High Performance and Throughput Computing (EMEA) Hans Pabst, March 12 th 2015
 Hans Pabst, March 12 th 2015") LIBXSMM Library for small matrix multiplications. Intel High Performance and Throughput Computing (EMEA) Hans Pabst, March 12 th 2015 Abstract Library for small matrix-matrix multiplications targeting
LIBXSMM Library for small matrix multiplications. Intel High Performance and Throughput Computing (EMEA) Hans Pabst, March 12 th 2015 Abstract Library for small matrix-matrix multiplications targeting
Contributors: Surabhi Jain, Gengbin Zheng, Maria Garzaran, Jim Cownie, Taru Doodi, and Terry L. Wilmarth
 Presenter: Surabhi Jain Contributors: Surabhi Jain, Gengbin Zheng, Maria Garzaran, Jim Cownie, Taru Doodi, and Terry L. Wilmarth May 25, 2018 ROME workshop (in conjunction with IPDPS 2018), Vancouver,
Intel profiling tools and roofline model. Dr. Luigi Iapichino
 Intel profiling tools and roofline model Dr. Luigi Iapichino luigi.iapichino@lrz.de Which tool do I use in my project? A roadmap to optimization (and to the next hour) We will focus on tools developed
Guy Blank Intel Corporation, Israel March 27-28, 2017 European LLVM Developers Meeting Saarland Informatics Campus, Saarbrücken, Germany
 Guy Blank Intel Corporation, Israel March 27-28, 2017 European LLVM Developers Meeting Saarland Informatics Campus, Saarbrücken, Germany Motivation C AVX2 AVX512 New instructions utilized! Scalar performance
KNL tools. Dr. Fabio Baruffa
 KNL tools Dr. Fabio Baruffa fabio.baruffa@lrz.de 2 Which tool do I use? A roadmap to optimization We will focus on tools developed by Intel, available to users of the LRZ systems. Again, we will skip the
Intel Atom Processor Based Platform Technologies. Intelligent Systems Group Intel Corporation
 Intel Atom Processor Based Platform Technologies Intelligent Systems Group Intel Corporation Legal Disclaimer INFORMATION IN THIS DOCUMENT IS PROVIDED IN CONNECTION WITH INTEL PRODUCTS. NO LICENSE, EXPRESS
Installation Guide and Release Notes
 Intel C++ Studio XE 2013 for Windows* Installation Guide and Release Notes Document number: 323805-003US 26 June 2013 Table of Contents 1 Introduction... 1 1.1 What s New... 2 1.1.1 Changes since Intel
Diego Caballero and Vectorizer Team, Intel Corporation. April 16 th, 2018 Euro LLVM Developers Meeting. Bristol, UK.
 Diego Caballero and Vectorizer Team, Intel Corporation. April 16 th, 2018 Euro LLVM Developers Meeting. Bristol, UK. Legal Disclaimer & Software and workloads used in performance tests may have been optimized
Sayantan Sur, Intel. ExaComm Workshop held in conjunction with ISC 2018
 Sayantan Sur, Intel ExaComm Workshop held in conjunction with ISC 2018 Legal Disclaimer & Optimization Notice Software and workloads used in performance tests may have been optimized for performance only
Intel Parallel Studio XE 2011 for Linux* Installation Guide and Release Notes
 Intel Parallel Studio XE 2011 for Linux* Installation Guide and Release Notes Document number: 323804-001US 8 October 2010 Table of Contents 1 Introduction... 1 1.1 Product Contents... 1 1.2 What s New...
Intel Cluster Checker 3.0 webinar
 Intel Cluster Checker 3.0 webinar June 3, 2015 Christopher Heller Technical Consulting Engineer Q2, 2015 1 Introduction Intel Cluster Checker 3.0 is a systems tool for Linux high performance compute clusters
Real World Development examples of systems / iot
 Real World Development examples of systems / iot Intel Software Developer Conference Seoul 2017 Jon Kim Software Consulting Engineer Contents IOT end-to-end Scalability with Intel x86 Architect Real World
Intel Parallel Studio XE 2015 Composer Edition for Linux* Installation Guide and Release Notes
 Intel Parallel Studio XE 2015 Composer Edition for Linux* Installation Guide and Release Notes 23 October 2014 Table of Contents 1 Introduction... 1 1.1 Product Contents... 2 1.2 Intel Debugger (IDB) is
Compiling for Scalable Computing Systems the Merit of SIMD. Ayal Zaks Intel Corporation Acknowledgements: too many to list
 Compiling for Scalable Computing Systems the Merit of SIMD Ayal Zaks Intel Corporation Acknowledgements: too many to list Takeaways 1. SIMD is mainstream and ubiquitous in HW 2. Compiler support for SIMD
12th ANNUAL WORKSHOP 2016 NVME OVER FABRICS. Presented by Phil Cayton Intel Corporation. April 6th, 2016
 12th ANNUAL WORKSHOP 2016 NVME OVER FABRICS Presented by Phil Cayton Intel Corporation April 6th, 2016 NVM Express * Organization Scaling NVMe in the datacenter Architecture / Implementation Overview Standardization
CERN IT Technical Forum
 Evaluating program correctness and performance with new software tools from Intel Andrzej Nowak, CERN openlab March 18 th 2011 CERN IT Technical Forum > An introduction to the new generation of software
Martin Kruliš, v
 Martin Kruliš 1 Optimizations in General Code And Compilation Memory Considerations Parallelism Profiling And Optimization Examples 2 Premature optimization is the root of all evil. -- D. Knuth Our goal