CERN IT Technical Forum
|
|
|
- Ilene Merry Carpenter
- 5 years ago
- Views:
Transcription

1 Evaluating program correctness and performance with new software tools from Intel Andrzej Nowak, CERN openlab March 18 th 2011 CERN IT Technical Forum
2 > An introduction to the new generation of software tools from Intel > Intel VTune Amplifier XE overview Description Features > Intel Inspector XE overview Description Features > API Organizing data Agenda This presentation contains some material from the Intel tools documentation Andrzej Nowak - Evaluating program correctness and performance with new software tools from Intel 2

3 Andrzej Nowak - Evaluating program correctness and performance with new software tools from Intel 3
4 The case for optimization > Limited scaling in hardware Some important CPU features that we used to rely on do not scale or even regress: frequency, cache, bus, internal buffers, ILP Other features (that we typically don t exploit, but we should) still scale to an extent: the number of cores, hardware threads, vectors > Software complexity is growing rapidly > Hence our interest in performance tuning As Intel puts it: What in the world is happening to my computer? What should be true, but rarely is: Optimization is an integral part of the software development process Performance is a feature Andrzej Nowak - Evaluating program correctness and performance with new software tools from Intel 4
5 Intel software tools > Designed to aid with developing software on Intel x86 processors > Previous generation: Linux undermaintained: a lot of functionality missing from the Linux versions Tools: VTune and Thread Profiler performance tuning Thread Checker threading correctness PTU 3.x ( Performance tuning utility ) > Current (new) generation: Redesigned interfaces, new functionality Unified functionality across Windows and Linux Much better software support (that means CERN software too) CERN openlab participates intensively in Alpha and Beta programs Tools: VTune Amplifier performance and profiling Inspector threading and memory correctness PTU 4.x (experimental/expert not our focus today) Andrzej Nowak - Evaluating program correctness and performance with new software tools from Intel 5
6 CERN openlab participation > CERN openlab participated intensively in the Alpha and Beta phases of the XE tools Evaluations with CERN software several showstopping bugs discovered and fixed, enabling work and avoiding long delays Enhancement proposals and feature requests (dozens made) Bugreports (dozens filed) > Cross-departmental collaborations based on Intel PTU driven by David Levinthal (Intel) > Special workshops held for advanced programmers Featured lectures by engineers from Intel working on the tools > Regular openlab workshops now promote these new tools as well (4 in a year) Featuring demos and exercises with both open-source and Intel tools Andrzej Nowak - Evaluating program correctness and performance with new software tools from Intel 6
7 Package components (both tools) > Graphical interface Based on wxwidgets Works in Linux as well as Windows > Command line interface Full collection capabilities Limited reporting capabilities > Tool API and libraries Available for program instrumentation Andrzej Nowak - Evaluating program correctness and performance with new software tools from Intel 7
8 VTune Amplifier Monitoring and tweaking performance Andrzej Nowak - Evaluating program correctness and performance with new software tools from Intel
9 Rationale > Performance tuning is increasingly growing in importance > PC tuning was missing a comprehensive product which supported: PMU based monitoring Instrumented monitoring Multi-threading and multi-core environments Graphical interpretation of results > Intel VTune was a step in that direction, later with a Thread Profiler addon > Amplifier is VTune s spiritual successor, borrowing features from the experimental Intel Performance Tuning Utility (PTU) Andrzej Nowak - Evaluating program correctness and performance with new software tools from Intel 9
10 Functionality > A performance tuning tool, adapted to multithreaded programs > Two main modes User-mode sampling and tracing instrumented; may have a heavy impact on runtime, a lot of data collected (including stack data) Hardware event-based sampling virtually no impact on runtime, good for hotspots and hardware utilization measurements The widely covered perfmon2 does the same thing, but this tool has much better visualization capabilities > Operating systems supported (same functionality): Linux Windows Andrzej Nowak - Evaluating program correctness and performance with new software tools from Intel 10
11 Issue detection capacity > Identify the most time-consuming (hot) functions in your application and/or on the whole system > Locate sections of code that do not effectively utilize available processor time > Determine the best sections of code to optimize for sequential performance and for threaded performance > Locate synchronization objects that affect the application performance > Find whether, where, and why your application spends time on input/output operations > Identify and compare the performance impact of different synchronization methods, different numbers of threads, or different algorithms > Analyze thread activity and transitions > Identify hardware-related bottlenecks in your code Andrzej Nowak - Evaluating program correctness and performance with new software tools from Intel 11
12 Select features > Analysis tree: Use the performance analysis tree to choose and configure the type of analysis for your target. > Start data collection paused: Click the Start Paused button on the command bar to start collecting performance data after a delay. > Viewpoints: Choose among preset configurations of windows and panes available for the analysis result. This helps focus on particular performance problems. > Top-down tree: Use to understand which flow in your application is more performance-critical. > Timeline analysis: Analyze the thread activity and transitions between threads. > Grouping: Group your data in different ways in the Bottom-up window to analyze the problem from different angles. > Source analysis: View source with the performance data attributed to source lines to understand a possible cause of an issue. > Comparison analysis: Compare performance analysis results for several application runs to estimate the performance gain you got after optimization. Andrzej Nowak - Evaluating program correctness and performance with new software tools from Intel 12
13 An example from the HEP world > Based on the multi-threaded Geant 4 prototype with the FullCMS simulation example A multi-threaded simulation of the passage of particles through the CMS detector > Light instrumentation discussed (~10 lines inserted in total) Andrzej Nowak - Evaluating program correctness and performance with new software tools from Intel 13

14 LAB Part 1 1 2

15 Timeline view > Blue elements are frames (events) as defined by instrumenting the event loop in the simulation > Yellow elements are tasks (regions) As defined by instrumenting the particular regions of the code > Green is runtime, brown is CPU usage Measured by the tool Frames Regions Andrzej Nowak - Evaluating program correctness and performance with new software tools from Intel 15


16 Interactive profile display Call stack

17 Concurrency histogram > Shows a histogram of elapsed time according to thread concurrency The user may adjust the values as he sees fit other views will adjust the colors accordingly Adjustable sliders Andrzej Nowak - Evaluating program correctness and performance with new software tools from Intel 17

18 Locks and waits analysis (1) > Shows time spent in locks and synchronization objects Andrzej Nowak - Evaluating program correctness and performance with new software tools from Intel 18

19 Locks and waits analysis (2) > See the precise lock location and the time spent in locks Andrzej Nowak - Evaluating program correctness and performance with new software tools from Intel 19

20 Results Timeline view Filters

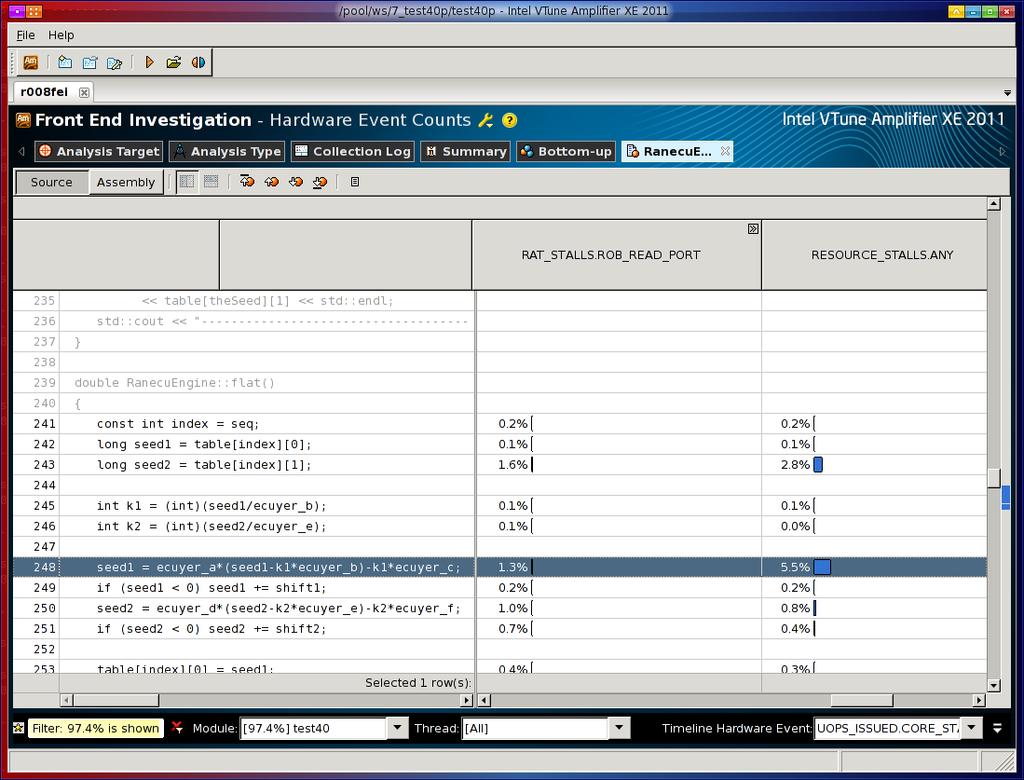
21 Different reference events available Different views available
22

23 Workflow > The basic steps to get going are identical to those in Inspector > The custom workflow for this application is also similar to Inspector s and is shown on the right Andrzej Nowak - Evaluating program correctness and performance with new software tools from Intel 23
24 Inspector Threading and memory correctness Andrzej Nowak - Evaluating program correctness and performance with new software tools from Intel
25 Introduction > A dynamic memory and threading error checking tool > Languages supported: C, C++, C#, Fortran > Technologies supported: TBB, Cilk+, pthreads, Windows threads, OpenMP > Operating systems supported (same functionality): Linux Windows > Replacement tool for Thread Checker Andrzej Nowak - Evaluating program correctness and performance with new software tools from Intel 25
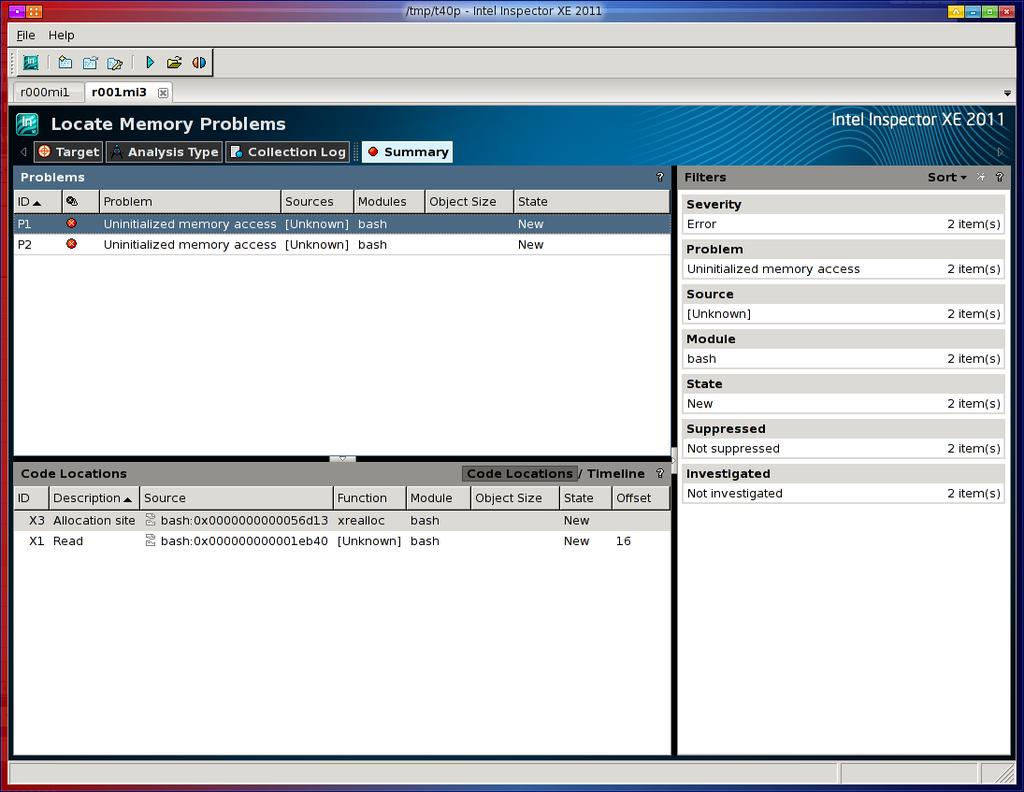
26 Features instrumented analysis > Memory error detection and location Detect leaks Detects memory leaks Detect memory problems In addition to the above: detects uninitialized accesses Locate memory problems In addition to the above: detects dangling pointers, enables guard zones, deep stack analysis > Threading error detection and location Detect deadlocks Detects lock hierarchy and deadlocks Detect data races In addition to the above: detects cross-thread stack accesses, data races Locate deadlocks and data races In addition to the above: collects stack, finer memory access granularity > Static security analysis Visualizes output from analysis performed with Intel compilers Andrzej Nowak - Evaluating program correctness and performance with new software tools from Intel 26
27

28 Basic workflow - overview Andrzej Nowak - Evaluating program correctness and performance with new software tools from Intel 28

29 Advanced workflow with regression testing Andrzej Nowak - Evaluating program correctness and performance with new software tools from Intel 29
30 API Instrumenting your programs for a streamlined optimization process Andrzej Nowak - Evaluating program correctness and performance with new software tools from Intel
31 > You can use Intel Threading Tools calls in your software in order to specify certain actions Start and stop monitoring (data collection) Describe regions of your code Rename threads Describe synchronization objects Define loop limits > Usage: Include ittnotify.h Link with ittnotify.a API Andrzej Nowak - Evaluating program correctness and performance with new software tools from Intel 31
32 API examples (Pause/Resume) // code, work collection was started paused // so no profiling data is gathered itt_resume(); // switch on profiling // code, work (profiled) itt_pause(); // switch off profiling > Example usage: Monitoring restricted to a certain routine Monitoring enabled only past a certain point Andrzej Nowak - Evaluating program correctness and performance with new software tools from Intel 32
33 API examples (Frames) itt_frame frame = itt_frame_create("g4 Events"); for (... ) { itt_frame_begin(frame); //... loop code } itt_frame_end(frame); > Example usage: Designation of cyclic occurrences such as events in a physics simulation (for display/grouping purposes) Frame groups ( domains ) available Different frame groupings available Andrzej Nowak - Evaluating program correctness and performance with new software tools from Intel 33

34 Frame grouping - example Andrzej Nowak - Evaluating program correctness and performance with new software tools from Intel 34
35 API examples (Regions/events) // 10 refers to the length of the description string itt_event ev_loop = itt_event_create( Event loop, 10); itt_event_start(ev_loop); //... Work... itt_event_end(ev_loop) ; > Example usage: Designation of code regions (for display/grouping purposes), e.g. Initialization, Detector construction, Simulation, Finalization Andrzej Nowak - Evaluating program correctness and performance with new software tools from Intel 35

36 Regions ( Task ) grouping - example Andrzej Nowak - Evaluating program correctness and performance with new software tools from Intel 36
37 Takeaway advice > Instrumented analysis might take quite a while Whenever possible, always try to choose a representative data set for monitoring Reduce the detail level of the analysis; for example, in Locks and waits, uncheck Spin time data and Collect signals whenever you don t need that data > Hardware-level analysis is as fast as the application itself No need to reduce your data set! > The tools come with APIs which you can use to instrument your source code > Results on non-intel CPUs should generally be fine, but may be offset or incorrect > Take a look at the documentation, it s worth it! Andrzej Nowak - Evaluating program correctness and performance with new software tools from Intel 37
38 Practical information > Intel tools are available pre-installed CERNwide in the standard AFS folder /afs/cern.ch/sw/intelsoftware Ideally: source all-setup.sh and you re set up > For more information, read the openlab TWiki or the openlab webpages -> openlab web > Graphical version: amplxe-gui > Command line: amplxe-cl Andrzej Nowak - Evaluating program correctness and performance with new software tools from Intel 38

39 Q & A Other questions? andrzej.nowak@cern.ch
40 BACKUP With material from the Intel tools documentation Andrzej Nowak - Evaluating program correctness and performance with new software tools from Intel
41 Key terms (1) > analysis: A process during which the tool performs collection and finalization. > code location: A fact the tool observes at a source code location, such as a write code location. Sometimes called an observation. A focus code location is a source code location with relationships you choose to explore. A related code location is a source code location with a relationship to a focus code location and possibly other code locations. > collection: A process during which the tool executes an application, identifies issues that may need handling, and collects those issues in a result. > false positive: The tool detects something that is not an error. > false negative: The tool does not detect an error because the problem may be too complex/big or involve too much runtime/memory cost. Andrzej Nowak - Evaluating program correctness and performance with new software tools from Intel 41
42 Key terms (2) > finalization: A process during which the the tool uses debug information from binary files to convert symbol information into filenames and line numbers, perform duplicate elimination, and form problem sets. > problem: A small group of closely related code locations that indicate an error in an application, such as a data race problem. > problem set: A larger group of more loosely related code locations that could share a common solution, such as a problem set resulting from deallocating an object too early during program execution. You can view problem sets only after analysis is complete. > project: A compiled application, collection of configurable attributes for the compiled application, and a container for results and private suppression rules. > result: A collection of issues that may need handling. > target: An application you inspect for errors Andrzej Nowak - Evaluating program correctness and performance with new software tools from Intel 42
43 Key terms (3) > baseline: A performance metric used as a basis for comparison of the application versions before and after optimization. Baseline should be measurable and reproducible. > CPU time: The amount of time a thread spends executing on a logical processor. For multiple threads, the CPU time of the threads is summed. The application CPU time is the sum of the CPU time of all the threads that run the application. > elapsed time: The total time your target ran, calculated as follows: Wall clock time at end of application Wall clock time at start of application. > hotspot: A section of code that took a long time to execute. Some hotspots may indicate bottlenecks and can be removed, while other hotspots inevitably take a long time to execute due to their nature. > viewpoint: A preset result tab configuration that filters out the data collected during a performance analysis and enables you to focus on specific performance problems. When you select a viewpoint, you select a set of performance metrics the tool shows in the windows/panes of the result tab. To select the required viewpoint, use the drop-down menu ( wrench ) at the top of the result tab. > wait time: The amount of time that a given thread waited for some event to occur, such as: synchronization waits and I/O waits. Andrzej Nowak - Evaluating program correctness and performance with new software tools from Intel 43

44 Key Concept: CPU Utilization > For the Concurrency and the Locks and Waits analyses, the Intel(R) VTune(TM) Amplifier XE identifies a processor utilization scale, calculates the target concurrency, and defines default utilization ranges depending on the number of processor cores. You can change the utilization ranges by dragging the slider in the Summary window. Andrzej Nowak - Evaluating program correctness and performance with new software tools from Intel 44
45 Key Concept: Hardware-level Analysis > The VTune Amplifier XE introduces a set of advanced hardware analysis types based on the event-based sampling data collection and targeted for the Intel(R) Core(TM) 2 processor family and processors based on the Intel(R) microarchitecture codename Nehalem. Depending on the analysis type, the VTune Amplifier XE monitors a set of hardware events and, as a result, provides collected data per, so-called, hardware performance metrics defined by Intel architects (for example, Clockticks per Instructions Retired, Contested Accesses, and so on). Each metric is an event ratio with its own threshold values. As soon as the performance of a program unit per metric exceeds the threshold, the VTune Amplifier XE marks this value as a performance issue and provides recommendations how to fix it. > Typically, you are recommended to start with the General Exploration analysis type that collects the maximum number of events and provides the widest picture of the hardware issues that affected the performance of your application. Andrzej Nowak - Evaluating program correctness and performance with new software tools from Intel 45
46 Key Concept: Hotspots Analysis > The Hotspots analysis helps understand the application flow and identify sections of code that took a long time to execute (hotspots). A large number of samples collected at a specific process, thread, or module can imply high processor utilization and potential performance bottlenecks. Some hotspots can be removed, while other hotspots are fundamental to the application functionality and cannot be removed. > The Intel(R) VTune(TM) Amplifier XE creates a list of functions in your application ordered by the amount of time spent in a function. It also detects the call stacks for each of these functions so you can see how the hot functions are called. > The VTune Amplifier XE uses a low overhead (about 5%) statistical sampling algorithm that gets you the information you need without a significant slowing of application execution. Andrzej Nowak - Evaluating program correctness and performance with new software tools from Intel 46
47 Key Concept: Locks and Waits Analysis > While the Concurrency analysis helps identify where your application is not parallel, the Locks and Waits analysis helps identify the cause of the ineffective processor utilization. One of the most common problems is threads waiting too long on synchronization objects (locks). Performance suffers when waits occur while cores are under-utilized. > During the Locks and Waits analysis you can estimate the impact each synchronization object introduces to the application and understand how long the application was required to wait on each synchronization object, or in blocking APIs, such as sleep and blocking I/O. Andrzej Nowak - Evaluating program correctness and performance with new software tools from Intel 47
48 Key Concept: Choosing Small, Representative Data Sets > When you run a dynamic analysis, the tool executes an application against a data set. Data set size has a direct impact on application execution time and analysis speed. > You can control analysis cost without sacrificing completeness by removing redundancies from your data set (e.g. redundant iterations). > Instead of choosing large, repetitive data sets, choose small, representative data sets. Data sets with runs in the seconds time range are ideal. You can always create additional data sets to ensure all your code is inspected. Andrzej Nowak - Evaluating program correctness and performance with new software tools from Intel 48
49 Key Concept: Data of Interest > The VTune Amplifier XE maintains a special column called Data of Interest. This column is highlighted with yellow background and a yellow star in the column header. > The data in the Data of Interest column is used by various windows as follows: The Call Stack pane calculates the contribution, shown in the contribution bar, using the Data of Interest column values. The Filter bar uses the data of interest values to calculate the percentage indicated in the filtered option. The Source/Assembly window uses this column for hotspot navigation. > If a viewpoint has more than one column with numeric data or bars, you can change the default Data of Interest column by right-clicking the required column and selecting the Set Column as Data of Interest command from the pop-up menu. Andrzej Nowak - Evaluating program correctness and performance with new software tools from Intel 49
50 Key Concept: Finalization > Finalization is a process when the VTune Amplifier XE converts the collected data to a database, resolves symbol information, and pre-computes data to make further analysis more efficient and responsive. The VTune Amplifier XE finalizes data automatically when generating results. > You may want to re-finalize a result to: update symbol information after changes in the search directories settings resolve the number of [Unknown]-s in the results Andrzej Nowak - Evaluating program correctness and performance with new software tools from Intel 50
51 Amplifier : Algorithm analysis > Algorithm analysis branch introduces analysis types targeted for software tuning. You run the analysis and use the collected data to understand where you could choose a better algorithm, and improve the application performance. Algorithm analysis includes the following analysis types: > Lightweight Hotspots: Event-based sampling analysis that monitors all the software executing on your system including the operating system modules. The collector interrupts the processor at the specified sampling interval and collects samples of instruction addresses. > Hotspots: Performance analysis based on the user-mode sampling and tracing collection. It focuses on a particular target, identifies functions that took the most CPU time to execute, restores the call tree for each function, and shows thread activity. > Concurrency: Performance analysis based on the user-mode sampling and tracing collection. It focuses on a particular target, identifies functions that took the most CPU time to execute, and shows how well your application is threaded for the existing number of logical CPUs. > Locks and Waits: Performance analysis based on the user-mode sampling and tracing collection that helps identify the synchronization objects that caused ineffective CPU usage. Andrzej Nowak - Evaluating program correctness and performance with new software tools from Intel 51
52 Amplifier : Hardware-level analysis > The Advanced hardware-level analysis introduces a set of analysis types based on the event-based sampling data collection and targeted for the Intel(R) Core(TM) 2 processor family and Intel(R) microarchitecture codename Nehalem. > General Exploration: Event-based analysis that helps identify the most significant hardware issues affect the performance of your application. Consider this analysis type as a starting point when you make the hardware-level analysis on Intel microarchitecture codename Nehalem. > Cycles and uops: Event-based analysis that helps understand where the cycles and uops issues affect the performance of your application. > Front End Investigation: Event-based analysis that helps understand where the front end issues affect the performance of your application. > Memory Access: Event-based analysis that helps understand where the memory access issues affect the performance of your application. Andrzej Nowak - Evaluating program correctness and performance with new software tools from Intel 52


53 Amplifier: Timeline view Andrzej Nowak - Evaluating program correctness and performance with new software tools from Intel 53

54 Amplifier: working with performance events Andrzej Nowak - Evaluating program correctness and performance with new software tools from Intel 54
Intel VTune Amplifier XE
 Intel VTune Amplifier XE Vladimir Tsymbal Performance, Analysis and Threading Lab 1 Agenda Intel VTune Amplifier XE Overview Features Data collectors Analysis types Key Concepts Collecting performance
Eliminate Threading Errors to Improve Program Stability
 Introduction This guide will illustrate how the thread checking capabilities in Intel Parallel Studio XE can be used to find crucial threading defects early in the development cycle. It provides detailed
Eliminate Threading Errors to Improve Program Stability
 Eliminate Threading Errors to Improve Program Stability This guide will illustrate how the thread checking capabilities in Parallel Studio can be used to find crucial threading defects early in the development
Eliminate Memory Errors to Improve Program Stability
 Introduction INTEL PARALLEL STUDIO XE EVALUATION GUIDE This guide will illustrate how Intel Parallel Studio XE memory checking capabilities can find crucial memory defects early in the development cycle.
Tutorial: Analyzing MPI Applications. Intel Trace Analyzer and Collector Intel VTune Amplifier XE
 Tutorial: Analyzing MPI Applications Intel Trace Analyzer and Collector Intel VTune Amplifier XE Contents Legal Information... 3 1. Overview... 4 1.1. Prerequisites... 5 1.1.1. Required Software... 5 1.1.2.
Getting Started Tutorial: Finding Hotspots
 Getting Started Tutorial: Finding Hotspots Intel VTune Amplifier XE 2013 for Linux* OS Fortran Sample Application Code Document Number: 327359-001 Legal Information Contents Contents Legal Information...5
Using Intel VTune Amplifier XE and Inspector XE in.net environment
 Using Intel VTune Amplifier XE and Inspector XE in.net environment Levent Akyil Technical Computing, Analyzers and Runtime Software and Services group 1 Refresher - Intel VTune Amplifier XE Intel Inspector
Eliminate Memory Errors to Improve Program Stability
 Eliminate Memory Errors to Improve Program Stability This guide will illustrate how Parallel Studio memory checking capabilities can find crucial memory defects early in the development cycle. It provides
Tutorial: Finding Hotspots with Intel VTune Amplifier - Linux* Intel VTune Amplifier Legal Information
 Tutorial: Finding Hotspots with Intel VTune Amplifier - Linux* Intel VTune Amplifier Legal Information Tutorial: Finding Hotspots with Intel VTune Amplifier - Linux* Contents Legal Information... 3 Chapter
This guide will show you how to use Intel Inspector XE to identify and fix resource leak errors in your programs before they start causing problems.
 Introduction A resource leak refers to a type of resource consumption in which the program cannot release resources it has acquired. Typically the result of a bug, common resource issues, such as memory
Microarchitectural Analysis with Intel VTune Amplifier XE
 Microarchitectural Analysis with Intel VTune Amplifier XE Michael Klemm Software & Services Group Developer Relations Division 1 Legal Disclaimer INFORMATION IN THIS DOCUMENT IS PROVIDED IN CONNECTION
Getting Started Tutorial: Finding Hotspots
 Getting Started Tutorial: Finding Hotspots Intel VTune Amplifier XE 2013 for Windows* OS Fortran Sample Application Code Document Number: 327358-001 Legal Information Contents Contents Legal Information...5
Eliminate Memory Errors and Improve Program Stability
 Eliminate Memory Errors and Improve Program Stability 1 Can running one simple tool make a difference? Yes, in many cases. You can find errors that cause complex, intermittent bugs and improve your confidence
Getting Started Tutorial: Analyzing Threading Errors
 Getting Started Tutorial: Analyzing Threading Errors Intel Inspector XE 2011 for Linux* OS Fortran Sample Application Code Document Number: 326600-001 World Wide Web: http://developer.intel.com Legal Information
Getting Started Tutorial: Analyzing Memory Errors
 Getting Started Tutorial: Analyzing Memory Errors Intel Inspector XE 2011 for Linux* OS Fortran Sample Application Code Document Number: 326596-001 World Wide Web: http://developer.intel.com Legal Information
Profiling: Understand Your Application
 Profiling: Understand Your Application Michal Merta michal.merta@vsb.cz 1st of March 2018 Agenda Hardware events based sampling Some fundamental bottlenecks Overview of profiling tools perf tools Intel
Getting Started Tutorial: Finding Hotspots
 Getting Started Tutorial: Finding Hotspots Intel VTune Amplifier XE 2013 for Linux* OS C++ Sample Application Code Document Number: 326705-002 Legal Information Contents Contents Legal Information...5
Intel VTune Amplifier XE Overview
 Intel VTune Amplifier XE Overview June 2011 1 Intel Parallel Studio XE 2011 Phase Productivity Tool Feature Benefit Advanced Build & Debug Intel Composer XE C/C++ and Fortran compilers, performance libraries,and
Performance Tuning VTune Performance Analyzer
 Performance Tuning VTune Performance Analyzer Paul Petersen, Intel Sept 9, 2005 Copyright 2005 Intel Corporation Performance Tuning Overview Methodology Benchmarking Timing VTune Counter Monitor Call Graph
Intel Parallel Inspector 2011 Getting Started Tutorials
 Intel Parallel Inspector 2011 Getting Started Tutorials Document Number: 323355-001US World Wide Web: http://developer.intel.com Legal Information Legal Information INFORMATION IN THIS DOCUMENT IS PROVIDED
Intel Parallel Studio 2011
 THE ULTIMATE ALL-IN-ONE PERFORMANCE TOOLKIT Studio 2011 Product Brief Studio 2011 Accelerate Development of Reliable, High-Performance Serial and Threaded Applications for Multicore Studio 2011 is a comprehensive
Agenda. Optimization Notice Copyright 2017, Intel Corporation. All rights reserved. *Other names and brands may be claimed as the property of others.
 Agenda VTune Amplifier XE OpenMP* Analysis: answering on customers questions about performance in the same language a program was written in Concepts, metrics and technology inside VTune Amplifier XE OpenMP
Getting Started Tutorial: Analyzing Threading Errors
 Getting Started Tutorial: Analyzing Threading Errors Intel Inspector XE 2011 for Windows* OS C++ Sample Application Code Document Number: 326597-001 World Wide Web: http://developer.intel.com Legal Information
Getting Started Tutorial: Identifying Hardware Issues
 Getting Started Tutorial: Identifying Hardware Issues Intel VTune Amplifier XE 2011 for Linux* OS C++ Sample Application Code Document Number: 326709-001 Legal Information Contents Contents Legal Information...5
Intel VTune Performance Analyzer 9.1 for Windows* In-Depth
 Intel VTune Performance Analyzer 9.1 for Windows* In-Depth Contents Deliver Faster Code...................................... 3 Optimize Multicore Performance...3 Highlights...............................................
Performance Profiler. Klaus-Dieter Oertel Intel-SSG-DPD IT4I HPC Workshop, Ostrava,
 Performance Profiler Klaus-Dieter Oertel Intel-SSG-DPD IT4I HPC Workshop, Ostrava, 08-09-2016 Faster, Scalable Code, Faster Intel VTune Amplifier Performance Profiler Get Faster Code Faster With Accurate
Jackson Marusarz Software Technical Consulting Engineer
 Jackson Marusarz Software Technical Consulting Engineer What Will Be Covered Overview Memory/Thread analysis New Features Deep dive into debugger integrations Demo Call to action 2 Analysis Tools for Diagnosis
Optimize Data Structures and Memory Access Patterns to Improve Data Locality
 Optimize Data Structures and Memory Access Patterns to Improve Data Locality Abstract Cache is one of the most important resources
Performance analysis tools: Intel VTuneTM Amplifier and Advisor. Dr. Luigi Iapichino
 Performance analysis tools: Intel VTuneTM Amplifier and Advisor Dr. Luigi Iapichino luigi.iapichino@lrz.de Which tool do I use in my project? A roadmap to optimisation After having considered the MPI layer,
Intel Xeon Phi Coprocessor Performance Analysis
 Intel Xeon Phi Coprocessor Performance Analysis Legal Disclaimer INFORMATION IN THIS DOCUMENT IS PROVIDED IN CONNECTION WITH INTEL PRODUCTS. NO LICENSE, EXPRESS OR IMPLIED, BY ESTOPPEL OR OTHERWISE, TO
Intel Parallel Amplifier Sample Code Guide
 The analyzes the performance of your application and provides information on the performance bottlenecks in your code. It enables you to focus your tuning efforts on the most critical sections of your
Tutorial: Finding Hotspots on an Android* Platform
 Tutorial: Finding Hotspots on an Android* Platform Intel VTune Amplifier for Systems (Linux* OS version) C++ Sample Application Code Legal Information Important This document was last updated for the Intel
Memory & Thread Debugger
 Memory & Thread Debugger Here is What Will Be Covered Overview Memory/Thread analysis New Features Deep dive into debugger integrations Demo Call to action Intel Confidential 2 Analysis Tools for Diagnosis
Intel VTune Amplifier XE. Dr. Michael Klemm Software and Services Group Developer Relations Division
 Intel VTune Amplifier XE Dr. Michael Klemm Software and Services Group Developer Relations Division Legal Disclaimer & Optimization Notice INFORMATION IN THIS DOCUMENT IS PROVIDED AS IS. NO LICENSE, EXPRESS
Getting Started Tutorial: Finding Hotspots
 Getting Started Tutorial: Finding Hotspots Intel VTune Amplifier XE 2013 for Windows* OS C++ Sample Application Code Document Number: 326704-002 Legal Information Contents Contents Legal Information...5
Using Intel VTune Amplifier XE for High Performance Computing
 Using Intel VTune Amplifier XE for High Performance Computing Vladimir Tsymbal Performance, Analysis and Threading Lab 1 The Majority of all HPC-Systems are Clusters Interconnect I/O I/O... I/O I/O Message
Tools for Intel Xeon Phi: VTune & Advisor Dr. Fabio Baruffa - LRZ,
 Tools for Intel Xeon Phi: VTune & Advisor Dr. Fabio Baruffa - fabio.baruffa@lrz.de LRZ, 27.6.- 29.6.2016 Architecture Overview Intel Xeon Processor Intel Xeon Phi Coprocessor, 1st generation Intel Xeon
Performance Analysis using Intel VTune Amplifier XE
 Performance Analysis using Intel VTune Amplifier XE Performance methodology profiling and tuning The Goal: minimize the time it takes your program / module / function to execute Identify Hotspots and focus
Intel profiling tools and roofline model. Dr. Luigi Iapichino
 Intel profiling tools and roofline model Dr. Luigi Iapichino luigi.iapichino@lrz.de Which tool do I use in my project? A roadmap to optimization (and to the next hour) We will focus on tools developed
Getting Started Tutorial: Analyzing Threading Errors
 Getting Started Tutorial: Analyzing Threading Errors Intel Inspector XE 2013 for Linux* OS C++ Sample Application Code Document Number: 327651-002US World Wide Web: http://developer.intel.com Legal Information
2
 1 2 3 4 5 6 For more information, see http://www.intel.com/content/www/us/en/processors/core/core-processorfamily.html 7 8 The logic for identifying issues on Intel Microarchitecture Codename Ivy Bridge
HPC Tools on Windows. Christian Terboven Center for Computing and Communication RWTH Aachen University.
 - Excerpt - Christian Terboven terboven@rz.rwth-aachen.de Center for Computing and Communication RWTH Aachen University PPCES March 25th, RWTH Aachen University Agenda o Intel Trace Analyzer and Collector
KNL tools. Dr. Fabio Baruffa
 KNL tools Dr. Fabio Baruffa fabio.baruffa@lrz.de 2 Which tool do I use? A roadmap to optimization We will focus on tools developed by Intel, available to users of the LRZ systems. Again, we will skip the
Jackson Marusarz Intel Corporation
 Jackson Marusarz Intel Corporation Intel VTune Amplifier Quick Introduction Get the Data You Need Hotspot (Statistical call tree), Call counts (Statistical) Thread Profiling Concurrency and Lock & Waits
Introduction to Performance Tuning & Optimization Tools
 Introduction to Performance Tuning & Optimization Tools a[i] a[i+1] + a[i+2] a[i+3] b[i] b[i+1] b[i+2] b[i+3] = a[i]+b[i] a[i+1]+b[i+1] a[i+2]+b[i+2] a[i+3]+b[i+3] Ian A. Cosden, Ph.D. Manager, HPC Software
Simplified and Effective Serial and Parallel Performance Optimization
 HPC Code Modernization Workshop at LRZ Simplified and Effective Serial and Parallel Performance Optimization Performance tuning Using Intel VTune Performance Profiler Performance Tuning Methodology Goal:
Intel Parallel Amplifier 2011
 THREADING AND PERFORMANCE PROFILER Intel Parallel Amplifier 2011 Product Brief Intel Parallel Amplifier 2011 Optimize Performance and Scalability Intel Parallel Amplifier 2011 makes it simple to quickly
Revealing the performance aspects in your code
 Revealing the performance aspects in your code 1 Three corner stones of HPC The parallelism can be exploited at three levels: message passing, fork/join, SIMD Hyperthreading is not quite threading A popular
Intel Threading Tools
 Intel Threading Tools Paul Petersen, Intel -1- INFORMATION IN THIS DOCUMENT IS PROVIDED IN CONNECTION WITH INTEL PRODUCTS. EXCEPT AS PROVIDED IN INTEL'S TERMS AND CONDITIONS OF SALE FOR SUCH PRODUCTS,
Intel Parallel Amplifier
 Intel Parallel Amplifier Product Brief Intel Parallel Amplifier Optimize Performance and Scalability Intel Parallel Amplifier makes it simple to quickly find multicore performance bottlenecks without needing
Using Intel Inspector XE 2011 with Fortran Applications
 Using Intel Inspector XE 2011 with Fortran Applications Jackson Marusarz Intel Corporation Legal Disclaimer INFORMATION IN THIS DOCUMENT IS PROVIDED IN CONNECTION WITH INTEL PRODUCTS. NO LICENSE, EXPRESS
Get an Easy Performance Boost Even with Unthreaded Apps. with Intel Parallel Studio XE for Windows*
 Get an Easy Performance Boost Even with Unthreaded Apps for Windows* Can recompiling just one file make a difference? Yes, in many cases it can! Often, you can achieve a major performance boost by recompiling
What's new in VTune Amplifier XE
 What's new in VTune Amplifier XE Naftaly Shalev Software and Services Group Developer Products Division 1 Agenda What s New? Using VTune Amplifier XE 2013 on Xeon Phi coprocessors New and Experimental
Getting Started Tutorial: Analyzing Memory Errors
 Getting Started Tutorial: Analyzing Memory Errors Intel Inspector XE 2013 for Windows* OS C++ Sample Application Code Document Number: 327646-002US World Wide Web: http://developer.intel.com Legal Information
ClearSpeed Visual Profiler
 ClearSpeed Visual Profiler Copyright 2007 ClearSpeed Technology plc. All rights reserved. 12 November 2007 www.clearspeed.com 1 Profiling Application Code Why use a profiler? Program analysis tools are
Performance Tools for Technical Computing
 Christian Terboven terboven@rz.rwth-aachen.de Center for Computing and Communication RWTH Aachen University Intel Software Conference 2010 April 13th, Barcelona, Spain Agenda o Motivation and Methodology
Performance Profiling
 Performance Profiling Minsoo Ryu Real-Time Computing and Communications Lab. Hanyang University msryu@hanyang.ac.kr Outline History Understanding Profiling Understanding Performance Understanding Performance
Profiling & Optimization
 Lecture 18 Sources of Game Performance Issues? 2 Avoid Premature Optimization Novice developers rely on ad hoc optimization Make private data public Force function inlining Decrease code modularity removes
VTune(TM) Performance Analyzer for Linux
 Performance Analyzer for Linux") VTune(TM) Performance Analyzer for Linux Getting Started Guide The VTune Performance Analyzer provides information on the performance of your code. The VTune analyzer shows you the performance issues,
VTune(TM) Performance Analyzer for Linux Getting Started Guide The VTune Performance Analyzer provides information on the performance of your code. The VTune analyzer shows you the performance issues,
Getting Started Tutorial: Analyzing Memory Errors
 Getting Started Tutorial: Analyzing Memory Errors Intel Inspector XE 2013 for Windows* OS Fortran Sample Application Code Document Number: 327648-002US World Wide Web: http://developer.intel.com Legal
Concurrency, Thread. Dongkun Shin, SKKU
 Concurrency, Thread 1 Thread Classic view a single point of execution within a program a single PC where instructions are being fetched from and executed), Multi-threaded program Has more than one point
CMSC Computer Architecture Lecture 12: Multi-Core. Prof. Yanjing Li University of Chicago
 CMSC 22200 Computer Architecture Lecture 12: Multi-Core Prof. Yanjing Li University of Chicago Administrative Stuff! Lab 4 " Due: 11:49pm, Saturday " Two late days with penalty! Exam I " Grades out on
Intel VTune Amplifier XE for Tuning of HPC Applications Intel Software Developer Conference Frankfurt, 2017 Klaus-Dieter Oertel, Intel
 Intel VTune Amplifier XE for Tuning of HPC Applications Intel Software Developer Conference Frankfurt, 2017 Klaus-Dieter Oertel, Intel Agenda Which performance analysis tool should I use first? Intel Application
Intel Parallel Studio: Vtune
 ntel Parallel Studio: Vtune C.Berthelot Christophe.Berthelot@atos.net Copyright c Bull S.A.S. 2016 1 C.Berthelot Christophe.Berthelot@atos.net c Atos Agenda ntroduction Bottelneck Gprof ntroduction The
Profiling & Optimization
 Lecture 11 Sources of Game Performance Issues? 2 Avoid Premature Optimization Novice developers rely on ad hoc optimization Make private data public Force function inlining Decrease code modularity removes
Intel Advisor XE Future Release Threading Design & Prototyping Vectorization Assistant
 Intel Advisor XE Future Release Threading Design & Prototyping Vectorization Assistant Parallel is the Path Forward Intel Xeon and Intel Xeon Phi Product Families are both going parallel Intel Xeon processor
Lesson 2: Using the Performance Console
 Lesson 2 Lesson 2: Using the Performance Console Using the Performance Console 19-13 Windows XP Professional provides two tools for monitoring resource usage: the System Monitor snap-in and the Performance
David R. Mackay, Ph.D. Libraries play an important role in threading software to run faster on Intel multi-core platforms.
 Whitepaper Introduction A Library Based Approach to Threading for Performance David R. Mackay, Ph.D. Libraries play an important role in threading software to run faster on Intel multi-core platforms.
Intel Thread Checker 3.1 for Windows* Release Notes
 Page 1 of 6 Intel Thread Checker 3.1 for Windows* Release Notes Contents Overview Product Contents What's New System Requirements Known Issues and Limitations Technical Support Related Products Overview
Locate a Hotspot and Optimize It
 Locate a Hotspot and Optimize It 1 Can Recompiling Just One File Make a Difference? Yes, in many cases it can! Often, you can get a major performance boost by recompiling a single file with the optimizing
Introduction to Parallel Performance Engineering
 Introduction to Parallel Performance Engineering Markus Geimer, Brian Wylie Jülich Supercomputing Centre (with content used with permission from tutorials by Bernd Mohr/JSC and Luiz DeRose/Cray) Performance:
2 TEST: A Tracer for Extracting Speculative Threads
 EE392C: Advanced Topics in Computer Architecture Lecture #11 Polymorphic Processors Stanford University Handout Date??? On-line Profiling Techniques Lecture #11: Tuesday, 6 May 2003 Lecturer: Shivnath
Effective Performance Measurement and Analysis of Multithreaded Applications
 Effective Performance Measurement and Analysis of Multithreaded Applications Nathan Tallent John Mellor-Crummey Rice University CSCaDS hpctoolkit.org Wanted: Multicore Programming Models Simple well-defined
Oracle Developer Studio Performance Analyzer
 Oracle Developer Studio Performance Analyzer The Oracle Developer Studio Performance Analyzer provides unparalleled insight into the behavior of your application, allowing you to identify bottlenecks and
A common scenario... Most of us have probably been here. Where did my performance go? It disappeared into overheads...
 OPENMP PERFORMANCE 2 A common scenario... So I wrote my OpenMP program, and I checked it gave the right answers, so I ran some timing tests, and the speedup was, well, a bit disappointing really. Now what?.
Martin Kruliš, v
 Martin Kruliš 1 Optimizations in General Code And Compilation Memory Considerations Parallelism Profiling And Optimization Examples 2 Premature optimization is the root of all evil. -- D. Knuth Our goal
Case Study: Parallelizing a Recursive Problem with Intel Threading Building Blocks
 4/8/2012 2:44:00 PM Case Study: Parallelizing a Recursive Problem with Intel Threading Building Blocks Recently I have been working closely with DreamWorks Animation engineers to improve the performance
Evolving HPCToolkit John Mellor-Crummey Department of Computer Science Rice University Scalable Tools Workshop 7 August 2017
 Evolving HPCToolkit John Mellor-Crummey Department of Computer Science Rice University http://hpctoolkit.org Scalable Tools Workshop 7 August 2017 HPCToolkit 1 HPCToolkit Workflow source code compile &
BASICS OF THE RENESAS SYNERGY PLATFORM
 BASICS OF THE RENESAS SYNERGY PLATFORM TM Richard Oed 2018.11 02 CHAPTER 11 EVENT ANALYSIS WITH TRACEX CONTENTS 11 EVENT ANALYSIS WITH TRACEX 03 11.1 An Introduction to TraceX 03 11.2 Built-in Views and
Analysing OpenMP Programs Inspector XE and Amplifier XE
 Analysing OpenMP Programs Inspector XE and Amplifier XE Berk ONAT İTÜ Bilişim Enstitüsü 22 Haziran 2012 Outline OpenMP Overhead Tools for analyzing OpenMP programs Print statement (Conven@onal way!) Intel
NightStar. NightView Source Level Debugger. Real-Time Linux Debugging and Analysis Tools BROCHURE
 NightStar Real-Time Linux Debugging and Analysis Tools Concurrent s NightStar is a powerful, integrated tool set for debugging and analyzing time-critical Linux applications. NightStar tools run with minimal
New IDE Application Profiler Enhancements
 New IDE Application Profiler Enhancements Authored by: Elena Laskavaia The new Application Profiler features are currently under development for the next release of QNX Momentics. Use the forum and provide
Zing Vision. Answering your toughest production Java performance questions
 Zing Vision Answering your toughest production Java performance questions Outline What is Zing Vision? Where does Zing Vision fit in your Java environment? Key features How it works Using ZVRobot Q & A
Performance analysis basics
 Performance analysis basics Christian Iwainsky Iwainsky@rz.rwth-aachen.de 25.3.2010 1 Overview 1. Motivation 2. Performance analysis basics 3. Measurement Techniques 2 Why bother with performance analysis
Computer Systems A Programmer s Perspective 1 (Beta Draft)
") Computer Systems A Programmer s Perspective 1 (Beta Draft) Randal E. Bryant David R. O Hallaron August 1, 2001 1 Copyright c 2001, R. E. Bryant, D. R. O Hallaron. All rights reserved. 2 Contents Preface
Computer Systems A Programmer s Perspective 1 (Beta Draft) Randal E. Bryant David R. O Hallaron August 1, 2001 1 Copyright c 2001, R. E. Bryant, D. R. O Hallaron. All rights reserved. 2 Contents Preface
Java performance - not so scary after all
 Java performance - not so scary after all Holly Cummins IBM Hursley Labs 2009 IBM Corporation 2001 About me Joined IBM Began professional life writing event framework for WebSphere 2004 Moved to work on
!OMP #pragma opm _OPENMP
 Advanced OpenMP Lecture 12: Tips, tricks and gotchas Directives Mistyping the sentinel (e.g.!omp or #pragma opm ) typically raises no error message. Be careful! The macro _OPENMP is defined if code is
Efficiently Introduce Threading using Intel TBB
 Introduction This guide will illustrate how to efficiently introduce threading using Intel Threading Building Blocks (Intel TBB), part of Intel Parallel Studio XE. It is a widely used, award-winning C++
Addressing the Increasing Challenges of Debugging on Accelerated HPC Systems. Ed Hinkel Senior Sales Engineer
 Addressing the Increasing Challenges of Debugging on Accelerated HPC Systems Ed Hinkel Senior Sales Engineer Agenda Overview - Rogue Wave & TotalView GPU Debugging with TotalView Nvdia CUDA Intel Phi 2
Introduction to Multicore Programming
 Introduction to Multicore Programming Minsoo Ryu Department of Computer Science and Engineering 2 1 Multithreaded Programming 2 Automatic Parallelization and OpenMP 3 GPGPU 2 Multithreaded Programming
A Faster Parallel Algorithm for Analyzing Drug-Drug Interaction from MEDLINE Database
 A Faster Parallel Algorithm for Analyzing Drug-Drug Interaction from MEDLINE Database Sulav Malla, Kartik Anil Reddy, Song Yang Department of Computer Science and Engineering University of South Florida
Dynamic Binary Instrumentation: Introduction to Pin
 Dynamic Binary Instrumentation: Introduction to Pin Instrumentation A technique that injects instrumentation code into a binary to collect run-time information 2 Instrumentation A technique that injects
Intel Parallel Studio XE 2015
 2015 Create faster code faster with this comprehensive parallel software development suite. Faster code: Boost applications performance that scales on today s and next-gen processors Create code faster:
Method-Level Phase Behavior in Java Workloads
 Method-Level Phase Behavior in Java Workloads Andy Georges, Dries Buytaert, Lieven Eeckhout and Koen De Bosschere Ghent University Presented by Bruno Dufour dufour@cs.rutgers.edu Rutgers University DCS
Introduction to Multicore Programming
 Introduction to Multicore Programming Minsoo Ryu Department of Computer Science and Engineering 2 1 Multithreaded Programming 2 Synchronization 3 Automatic Parallelization and OpenMP 4 GPGPU 5 Q& A 2 Multithreaded
OpenACC 2.6 Proposed Features
 OpenACC 2.6 Proposed Features OpenACC.org June, 2017 1 Introduction This document summarizes features and changes being proposed for the next version of the OpenACC Application Programming Interface, tentatively
Intel PerfMon Performance Monitoring Hardware
 Intel PerfMon Performance Monitoring Hardware Overview PerfMon Basics PerfMon is hardware throughout the silicon available through registers to tools to facilitate several system/application usages: compiler
Does the Intel Xeon Phi processor fit HEP workloads?
 Does the Intel Xeon Phi processor fit HEP workloads? October 17th, CHEP 2013, Amsterdam Andrzej Nowak, CERN openlab CTO office On behalf of Georgios Bitzes, Havard Bjerke, Andrea Dotti, Alfio Lazzaro,
CS 326: Operating Systems. Process Execution. Lecture 5
 CS 326: Operating Systems Process Execution Lecture 5 Today s Schedule Process Creation Threads Limited Direct Execution Basic Scheduling 2/5/18 CS 326: Operating Systems 2 Today s Schedule Process Creation
Operating Systems: Internals and Design Principles. Chapter 2 Operating System Overview Seventh Edition By William Stallings
 Operating Systems: Internals and Design Principles Chapter 2 Operating System Overview Seventh Edition By William Stallings Operating Systems: Internals and Design Principles Operating systems are those