Developing Applications for Data Analysis
|
|
|
- Diane Potter
- 6 years ago
- Views:
Transcription
1 Developing Applications for Data Analysis Query on Corporate Databases Reporting Operator Interface for Data Collection Statistical Analysis with Minitab


2 Custom Development Custom Reports Dashboards Automated Analyses Alert Systems
")

3 Company Data Access and Analysis Databases (SQL, MySQL, Acess) Excel Instruments Data files Variables Selection Automated Reports


4 Management of Measurement Data The need to automate the management of repetitive analysis is typical of people who use Minitab to process production data. Simplify the availability of data and the implementation of the analysis or report, with a tool which is a standard reference, becomes of primary importance
, and then the entered value 6.")
5 Data Insert Interface Having a smart interface, help people who have to carry out the data collection instruments for measuring, or who have to import data from other sources Example of interface for the integration of laboratory s data. Notice how for the variable ph there are limits set to the values 7 to 9 (for example), and then the entered value 6.98 proves to be out of specification, and then in red. The lower part displays a graph with the evolution of the variable ph


6 Analysis Interface Simplify the identification of the filtered data or a specific date range In this interface variables can be extracted, based on filters that are defined for the project. If in the Database there are more variables, then there will be multiple lines. The lower display part shows some information such as: Mean, Standard Deviation, Cp and Cpk, SPC Special Causes Tests and the Shape of Variable s Values


7 Databases Query and Analysis The application can be designed to read data from databases available on the corporate network. If the project requires it, is possible to connect different databases, combining everything into a single tool for the company analysis. The selected data are extracted and used with Minitab statistical functions, to create SPC graphs and reports according to the Company needs.
, Pressure (2) Viscosity (5). In the figure the columns Cp and Cpk display a kind of semaphore to indicate whether the variable has an acceptable value.")
8 Tabular Report Also the easiest report could be done with a simple click in order to help the user in the definition of the problem Selecting the Item X123 were extracted 3 variables: Absorption White (17 samples), Pressure (2) Viscosity (5). In the figure the columns Cp and Cpk display a kind of semaphore to indicate whether the variable has an acceptable value. If you have not set the specification limits this calculation is not possible. Clicking the Report button, you can obtain a tabular report with a summary of the characteristics of the variables

9 Reports Template The use of these interfaces allows to manage all the analysis phases and reporting, quickly and without the statistical expert need


10 Customized Reports Reports can be developed in according to customer/company needs

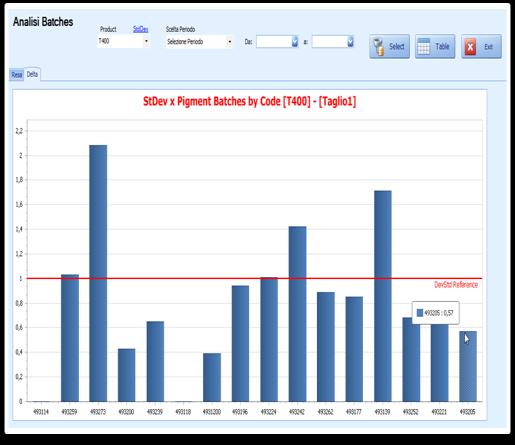
11 Customized Analysis In the example a the representation of Cp and Cpk depends on the article for week of 2011
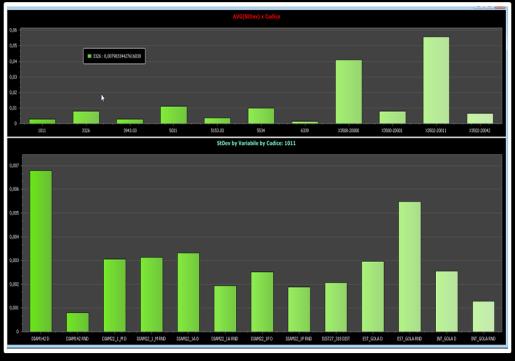
 of the Standard Deviation of all the variables which are referred to the Product Code.")
12 Interactive Dashboard The Dashboard is a special interface that shows the quality of the variables by analyzing their Standard Deviation. The histogram at the top shows the MAX (or could be the SUM) of the Standard Deviation of all the variables which are referred to the Product Code. The chart at the bottom shows the individual characteristics associated with Standard Deviation based on the product code selected by a mouse click.

13 Drill Down Analysis You can explore your data in different ways


14 Graphical Analysis In some cases the statistical analysis are not necessary, but would be useful to have a graphical visualization of the data


15 Automated Report For a specific solution, we have created an interface that is able to generate reports, automatically and recursively, without operator intervention

16 Before After Analysis This is Before After Analysis useful when the user want to evaluate the impact of a process improvement. Analysis are done using Minitab Statistical Software. If the specification limits are available also the Capability analysis will be created.

17 Out Of Specification Report This is another example of interface of analysis that helps the user to understand better the results of the industrial processes


18 Drill Down Analysis This is an example of Drill Down analysis

19 Test equipment as data sources What happens when the measured values come from instruments or measuring machines and are available in Excel, CSV, TXT, etc...? These are some examples 3D Test equipment output Excel file

20 Import data from files If the project needs to collect data from various sources files (csv, txt, excel, etc ), we can create a little stand-alone application that automatically imports the measurements values in the Databases
21 Remember We are able to provide: Web demo of some projects we have developped Little example using customer s subset of data


 -")


22 Contact us: GMSL s.r.l. - Scientific Software Distributor Via Giovanni XXIII, Nerviano (Mi) - ITALY Tel: Fax: contact@gmsl.it - Web:
QRM Web Application User Manual
 1 QRM Web Application User Manual The Compatible with LabVIEW logo is a trademark of National Instruments Corporation and is used under a license from National Instruments Corporation. 1 2 Contents 1 Document
AVANTUS TRAINING PTE LTD
 [MS20779]: Analyzing Data with Excel Length : 3 Days Audience(s) : IT Professionals Level : 300 Technology : Power BI Delivery Method : Instructor-led (Classroom) Course Overview The main purpose of the
AdisInsight User Guide. July 2015
 AdisInsight User Guide July 2015 Table of Contents Registering an account on AdisInsight Log In AdisInsight Subscription Access Basic Search Advanced Search Refine Your Search Viewing a DRUG Profile Record
BIOMA USER MANUAL VERSION
 BIOMA USER MANUAL VERSION 2.2.1304 VIENNA UNIVERSITY OF TECHNOLOGY, JULY 2013 Vienna University of Technology Institute for Water Quality, Resources and Waste Management A-1040 Wien, Karlsplatz 13/226
NEXYGEN MT v4.5. Materials Testing Software
 NEXYGEN MT v4.5 Materials Testing Software MATERIALS TESTING SOFTWARE NEXYGEN MT software provides a virtual testing laboratory. The software offers a full compliment of testing categories with multiple
Construction IC User Guide. Analyse Markets.
 Construction IC User Guide Analyse Markets clientservices.construction@globaldata.com https://construction.globaldata.com Analyse Markets Our Market Analysis Tools are designed to give you highly intuitive
Data Analyst Nanodegree Syllabus
 Data Analyst Nanodegree Syllabus Discover Insights from Data with Python, R, SQL, and Tableau Before You Start Prerequisites : In order to succeed in this program, we recommend having experience working
Best Practices for Choosing Content Reporting Tools and Datasources. Andrew Grohe Pentaho Director of Services Delivery, Hitachi Vantara
 Best Practices for Choosing Content Reporting Tools and Datasources Andrew Grohe Pentaho Director of Services Delivery, Hitachi Vantara Agenda Discuss best practices for choosing content with Pentaho Business
KANRI DISTANCE CALCULATOR. User Guide v2.4.9
 KANRI DISTANCE CALCULATOR User Guide v2.4.9 KANRI DISTANCE CALCULATORTM FLOW Participants Input File Correlation Distance Type? Generate Target Profile General Target Define Target Profile Calculate Off-Target
ER/Studio Enterprise Portal User Guide
 ER/Studio Enterprise Portal 1.1.1 User Guide Copyright 1994-2009 Embarcadero Technologies, Inc. Embarcadero Technologies, Inc. 100 California Street, 12th Floor San Francisco, CA 94111 U.S.A. All rights
Control Charts. An Introduction to Statistical Process Control
 An Introduction to Statistical Process Control Course Content Prerequisites Course Objectives What is SPC? Control Chart Basics Out of Control Conditions SPC vs. SQC Individuals and Moving Range Chart
ER/Studio Enterprise Portal Evaluation Guide. Published: March 6, 2009
 ER/Studio Enterprise Portal 1.0.3 Evaluation Guide Published: March 6, 2009 Contents Introduction to ER/Studio Enterprise Portal 1.0... 3 Session 1: Getting Started with the Enterprise Portal... 4 Session
Course Outline. Microsoft Power BI Interactive Data Visualizations Course : 2 days Instructor Led
 Microsoft Power BI Interactive Data Visualizations Course 752550: 2 days Instructor Led ABOUT THE COURSE Microsoft Power BI transforms your company data into rich visuals that facilitate new ways of thinking
Seamless Dynamic Web (and Smart Device!) Reporting with SAS D.J. Penix, Pinnacle Solutions, Indianapolis, IN
 Reporting with SAS D.J. Penix, Pinnacle Solutions, Indianapolis, IN") Paper RIV05 Seamless Dynamic Web (and Smart Device!) Reporting with SAS D.J. Penix, Pinnacle Solutions, Indianapolis, IN ABSTRACT The SAS Business Intelligence platform provides a wide variety of reporting
Paper RIV05 Seamless Dynamic Web (and Smart Device!) Reporting with SAS D.J. Penix, Pinnacle Solutions, Indianapolis, IN ABSTRACT The SAS Business Intelligence platform provides a wide variety of reporting
MicroStrategy Desktop
 MicroStrategy Desktop Quick Start Guide MicroStrategy Desktop is designed to enable business professionals like you to explore data, simply and without needing direct support from IT. 1 Import data from
Elipse Knowledgebase. Using MS SQL Server as Database in Elipse E3.
 Elipse Knowledgebase Using MS SQL Server as Database in Elipse E3. Introduction The use of relational databases involves installing and administering them. However, it is not always possible to have these
DB Export/Import/Generate data tool
 DB Export/Import/Generate data tool Main functions: quick connection to any database using defined UDL files show list of available tables and/or queries show data from selected table with possibility
New Approach in Software Education in Metrology and Quality Assurance an Empirical Study
 New Approach in Software Education in Metrology and Quality Assurance an Empirical Study Martin Dambon, Gerhard Linß Technische Universität Ilmenau (Germany) Faculty of Mechanical Engineering, Department
QuickReports Guide. Creating a New Report
 QuickReports Guide Use QuickReports to produce lists, summaries and charts from the data in SupportDesk. Reports are accessed from the QuickReports option in the menu topbar. Clicking the QuickReports
Target Surface Data Import and Quality Control
 Target Surface Data Import and Quality Control In mineral exploration, the initial focus of any exploration program is to identify potential targets for drilling. After potential targets are determined,
Introduction to BEST Viewpoints
 Introduction to BEST Viewpoints This is not all but just one of the documentation files included in BEST Viewpoints. Introduction BEST Viewpoints is a user friendly data manipulation and analysis application

KERN Industry 4.0. Application solutions/software. Increased efficiency is the key to greater success in ever tightening markets
 Increased efficiency is the key to greater success in ever tightening markets This inevitably leads to increased pressure on employees in laboratories, clinics, industrial or service companies more and
Access: You will have to
 Access: You will have to Create a new blank database Import data from a text file and set up the fields correctly Add some records to the table Create some reports. o For these reports you will need to
TRACKER DASHBOARD USER GUIDE. Version 1.0
 Version 1.0 DOCUMENT CONTROL DOCUMENT CONTROL Document Tracker Dashboard User Guide Current Version Version Date Issued Pages Reason For Issue 1.0 Nov 2013 All First issue Previous Versions Version Date
Guide to using Membership lists
 Your Membership list Guide to using Membership lists A maximum of five Committee Members per Local Group can be given website editing rights and there are two types of access available: senior rights allow
Data Analyst Nanodegree Syllabus
 Data Analyst Nanodegree Syllabus Discover Insights from Data with Python, R, SQL, and Tableau Before You Start Prerequisites : In order to succeed in this program, we recommend having experience working
Database Performance Analyzer (DPA) Quick Demo
 Quick Demo") Database Performance Analyzer (DPA) Quick Demo http://database.demo.solarwinds.com/ Log in with the username demo and password demo1. NOTE: You may encounter the following recommended video, while demoing
Database Performance Analyzer (DPA) Quick Demo http://database.demo.solarwinds.com/ Log in with the username demo and password demo1. NOTE: You may encounter the following recommended video, while demoing
= = P. IE 434 Homework 2 Process Capability. Kate Gilland 10/2/13. Figure 1: Capability Analysis
 Kate Gilland 10/2/13 IE 434 Homework 2 Process Capability 1. Figure 1: Capability Analysis σ = R = 4.642857 = 1.996069 P d 2 2.326 p = 1.80 C p = 2.17 These results are according to Method 2 in Minitab.
FC-11 FIELD COMMUNICATOR 1.54 INSTRUCTION MANUAL. IM-EN-FC11 Version 1.13
 FC-11 FIELD COMMUNICATOR 1.54 INSTRUCTION MANUAL IM-EN-FC11 Version 1.13 Table of contents 1 Description............................................................ 1 1.1 Kit contents....................................................
ER/Studio Enterprise Portal 1.1 User Guide
 ER/Studio Enterprise Portal 1.1 User Guide Copyright 1994-2009 Embarcadero Technologies, Inc. Embarcadero Technologies, Inc. 100 California Street, 12th Floor San Francisco, CA 94111 U.S.A. All rights
ChartView Out-of-the-Box Setup, Acquisition, & Real-Time Display Software
 Out-of-the-Box Setup, Acquisition, & Real-Time Display Software ChartView Software Display and record data in minutes, with no programming Display strip charts in real time Make on-screen measurements
55049: PowerPivot, Power View and SharePoint 2013 Business Intelligence Center for Analysts
 Let s Reach For Excellence! TAN DUC INFORMATION TECHNOLOGY SCHOOL JSC Address: 103 Pasteur, Dist.1, HCMC Tel: 08 38245819; 38239761 Email: traincert@tdt-tanduc.com Website: www.tdt-tanduc.com; www.tanducits.com
HOW TO CREATE INFOGRAPHICS WITH INFOGRAM
 HOW TO CREATE INFOGRAPHICS WITH INFOGRAM Compliments of Women in Ecommerce - www.wecai.org According to Wikipedia: Infographics (a clipped compound of "information" and "graphics") are graphic visual representations
Quality Gates User guide
 Quality Gates 3.3.5 User guide 06/2013 1 Table of Content 1 - Introduction... 4 2 - Navigation... 5 2.1 Navigation tool bar... 5 2.2 Navigation tree... 5 2.3 Folder Tree... 6 2.4 Test history... 7 3 -
MMS Fast operation (15 Samples simultaneously), 30 minutes for ash in coal, 120 minutes for ash in flour(patented)
, 30 minutes for ash in coal, 120 minutes for ash in flour(patented)") NI Multiple Sample Quick Moisture - Ash Analyzer for large throughput, Patented (Accurate TGA method) MMS 3000 The MMS-3000 (Multiple Matrix - Multiple Sample TGA) Allows determinations of moisture - ash
NI Multiple Sample Quick Moisture - Ash Analyzer for large throughput, Patented (Accurate TGA method) MMS 3000 The MMS-3000 (Multiple Matrix - Multiple Sample TGA) Allows determinations of moisture - ash
into a Powerful Instrument Control Application LABTRONICS INC. The Instrument Interfacing Experts
 Collect Pro Converts Excel into a Powerful Instrument Control Application LABTRONICS INC. The Instrument Interfacing Experts Instrument Control The Power of Collect Pro Collect Pro combines the power of
PANORAMA NxT Complete software solution for advanced process automation
 PANORAMA - 2000 NxT Complete software solution for advanced process automation Control & Automation Division LARSEN & TOUBRO LIMITED I NTRODUCTION Panorama 2000 NxT lets you see your plant in action! Gives
Bull Fast Track/PDW and Big Data
 Bull Fast Track/PDW and Big Data Add High Performance BI to your Big Data Roger Van Unen Expert Microsoft / BI roger.van-unen@bull.net http://www.bull.fr/bi/fastrack.html Michael Schmitter BI Sales Germany
LicMan License Manager USER MANUAL. version 1.0 issue 10/11/98 archive number MI-54
 LicMan USER MANUAL version 1.0 issue 10/11/98 archive number MI-54 publication issued by s.r.l. Via Del Lavoro, 13-48011 Alfonsine (RA) - ITALY Tel. (+39) 0544 84277 (+39) 0544 866811 Fax (+39) 0544 80635
Ovation Process Historian
 Ovation Process Historian Features Designed to meet the needs of precision, performance, scalability and historical data management for the Ovation control system Collects historical data of Ovation process
SCREEN RECORDER KD-Series TYPE
 SCREEN RECORDER KD-Series TYPE USER S MANUAL FOR KD ARCHIVE v.2.1 PROGRAM CONTENTS 1 INTRODUCTION... 3 2 PROGRAM INSTALLATION... 3 3 USING THE APPLICATION... 5 3.1 Main application window view without
TD 311 USER MANUAL DataStudio 3D April DATASTUDIO 3D Post-processing software
 TD 311 USER MANUAL DataStudio 3D April 2016 DATASTUDIO 3D Post-processing software Page 2 April 2016 - TD 311 USER MANUAL DataStudio 3D Preliminary Edition 5 th of April 2016 Copyright: Aanderaa Data Instruments
COGNOS BI I) BI introduction Products Introduction Architecture Workflows
 BI introduction Products Introduction Architecture Workflows") COGNOS BI I) BI introduction Products Architecture Workflows II) Working with Framework Manager (Modeling Tool): Architecture Flow charts Creating Project Creating Data Sources Preparing Relational Metadata
COGNOS BI I) BI introduction Products Architecture Workflows II) Working with Framework Manager (Modeling Tool): Architecture Flow charts Creating Project Creating Data Sources Preparing Relational Metadata
NOISE-HUB2 SOFTWARE USER MANUAL
 NOISE-HUB2 SOFTWARE USER MANUAL CIRRUS RESEARCH PLC Edition 2 October 2013 The content of this manual, any illustrations, technical information and descriptions within this document were correct at the
Progressive Athletic Performance Basic Monitoring Database 2.0 User Manual
 Progressive Athletic Performance Basic Monitoring Database 2.0 User Manual Thank you checking out the website and showing interest in this updated version of the progressive athletic performance basic
All associated job or inspection files, health and safety reports etc. can also be stored within ElcoMaster.
 Page 1 of 5 ElcoMaster Data Management Software ElcoMaster is a fast, easy to use software and mobile app for all your data management, reporting and quality assurance needs. It s not just taking measurements
Getting Started with Intellicus. Version: 16.0
 Getting Started with Intellicus Version: 16.0 Copyright 2016 Intellicus Technologies This document and its content is copyrighted material of Intellicus Technologies. The content may not be copied or derived
Website User Guide Your guide to making the most of your Metal Bulletin subscription
 1 Website User Guide Your guide to making the most of your Metal Bulletin subscription 2 Contents Website Navigation My Account / Account Settings My Account / Email Preferences Metal Bulletin Price Book
Operators Agree LabLite PC = Data Security
 888-954-5483 lablite.com info@lablite.com Operators Agree LabLite PC = Data Security Enter Results by Hour, Day, or Week No More Compliance Reporting Problems E-Mail & Fax & Printed Output Instant Trend
Sage 500 ERP Business Intelligence
 Sage 500 ERP Business Intelligence Getting Started Guide Sage 500 Intelligence (7.4) Getting Started Guide The software described in this document is protected by copyright, And may not be copied on any
FlowJo Software Lecture Outline:
 FlowJo Software Lecture Outline: Workspace Basics: 3 major components 1) The Ribbons (toolbar) The availability of buttons here can be customized. *One of the best assets of FlowJo is the help feature*
CMX Light. Easy-to-use calibration software for a single workstation.
 CMX Light Easy-to-use calibration software for a single workstation. CMX Light Calibration management made smart and simple. Good calibration management software reduces your workload, because it carries
Big Data Executive Program
 Big Data Executive Program Big Data Executive Program Business Visualization for Big Data (BV) SAS Visual Analytics help people see things that were not obvious to them before. Even when data volumes are
WinTest1 : User Guide Software Release 7.1
 WinTest1 : User Guide Software Release 7.1 WinTest1 manages la serial communication with the AEP transducers with internal battery. It allows to create and archive test graphs, to export data to Microsoft
Diploma of Laboratory Technology. Assessment 2 Control charts. Data Analysis. MSL Analyse data and report results.
 Diploma of Laboratory Technology Assessment 2 Control charts Data Analysis MSL925001 Analyse data and report results www.cffet.net PURPOSE 2 ASSESSMENT MAP 2 SUBMISSION 2 GETTING STARTED 3 TASK 1 X CHART
Webview Help Guide. OnSite Telemetry System. Distributed by: Chart Inc th Street NW New Prague, MN USA (800)
") Webview Help Guide OnSite Telemetry System Distributed by: Chart Inc. 407 7th Street NW New Prague, MN 56071 USA (800) 400-4683 Part Number 21107927 Rev. A 2016 Chart Inc. Webview Help Guide - OnSite
Webview Help Guide OnSite Telemetry System Distributed by: Chart Inc. 407 7th Street NW New Prague, MN 56071 USA (800) 400-4683 Part Number 21107927 Rev. A 2016 Chart Inc. Webview Help Guide - OnSite
ER/Studio Enterprise Portal User Guide
 ER/Studio Enterprise Portal 1.0.3 User Guide Copyright 1994-2009 Embarcadero Technologies, Inc. Embarcadero Technologies, Inc. 100 California Street, 12th Floor San Francisco, CA 94111 U.S.A. All rights
Welcome. Accessing Your Banner Reports
 Welcome Accessing Your Banner Reports Objective Introduction Show e~print users how to select, retrieve, view, save, and print e~print reports from their browsers. Intended Use Self-Training Guided Training
Analyze Bug Statistics using Kibana Dashboard and Get Voice Alerts
 Analyze Bug Statistics using Kibana Dashboard and Get Voice Alerts Kibana Dashboard Elast Alert Sensiple Notification System Abstract This white paper describes how Kibana Dashboard can be used to analyze
What is JIRA? software development tool. planning and tracking the projects progress and supporting the team collaboration
 Jakub Sykora What is JIRA? software development tool planning and tracking the projects progress and supporting the team collaboration supports both Agile (Scrum & Kanban) and waterfall methodologies What
SAP Exam C_BOWI_41 SAP Certified Application Associate SAP BusinessObjects Web Intelligence 4.1 Version: 7.0 [ Total Questions: 143 ]
![SAP Exam C_BOWI_41 SAP Certified Application Associate SAP BusinessObjects Web Intelligence 4.1 Version: 7.0 [ Total Questions: 143 ]](/thumbs/83/87152790.jpg "SAP Exam C_BOWI_41 SAP Certified Application Associate SAP BusinessObjects Web Intelligence 4.1 Version: 7.0 [ Total Questions: 143 ]") s@lm@n SAP Exam C_BOWI_41 SAP Certified Application Associate SAP BusinessObjects Web Intelligence 4.1 Version: 7.0 [ Total Questions: 143 ] Question No : 1 Which three rules apply when you manually synchronize
s@lm@n SAP Exam C_BOWI_41 SAP Certified Application Associate SAP BusinessObjects Web Intelligence 4.1 Version: 7.0 [ Total Questions: 143 ] Question No : 1 Which three rules apply when you manually synchronize
Getting Started Guide. Sage MAS Intelligence 500
 Getting Started Guide Sage MAS Intelligence 500 Table of Contents Getting Started Guide... 1 Login Properties... 1 Standard Reports Available... 2 Financial Report... 2 Financial Trend Analysis... 3 Dashboard
SharePoint 2013 Business Intelligence
 SharePoint 2013 Business Intelligence 55158; 3 Days; Instructor-led Course Description This course covers the services and features in SharePoint that offer support for Business Intelligence scenarios.
Viewer. Quick Reference Guide
 Viewer Quick Reference Guide igrafx 2009 Viewer Quick Reference Guide Table of Contents igrafx Viewer Quick Reference Guide........................................................3 igrafx Viewer Interface..................................................
55158: SharePoint 2013 Business Intelligence
 Let s Reach For Excellence! TAN DUC INFORMATION TECHNOLOGY SCHOOL JSC Address: 103 Pasteur, Dist.1, HCMC Tel: 08 38245819; 38239761 Email: traincert@tdt-tanduc.com Website: www.tdt-tanduc.com; www.tanducits.com
Extrusion Control System
 Extrusion Control System General Information Our extrusion control system is based on PLC (one or several) with remote I/O (Input/Output) stations. We offer the choice of Allen-Bradley, Siemens, Modicon,
21 CFR Part 11 Administrative Tools Part 11 Trackable Changes Maintenance Plans Upgrades Part 11 LDAP Support QC-SORT
 Product Catalog Software Solutions Prolink offers an entire suite of software solutions to address and automate the data collection and quality analysis tasks performed throughout your organization. As
Using Interactive Reports and Dashboards
 Using Interactive Reports and Dashboards Typical interactive features Use onscreen filters to modify a dashboard or report and choose whether to see all or only some of the data available. The screen will
Intellicus Enterprise Reporting and BI Platform
 Getting Started with Intellicus Intellicus Enterprise Reporting and BI Platform Intellicus Technologies info@intellicus.com www.intellicus.com Getting Started with Intellicus i Copyright 2012 Intellicus
Hyperion Interactive Reporting Reports & Dashboards Essentials
 Oracle University Contact Us: +27 (0)11 319-4111 Hyperion Interactive Reporting 11.1.1 Reports & Dashboards Essentials Duration: 5 Days What you will learn The first part of this course focuses on two
PC-FAX.com Web Customer Center
 PC-FAX.com Web Customer Center Web Customer Center is a communication center right in your browser. You can use it anywhere you are. If you are registered by Fax.de, you have received a customer number
General Improvements for Version 8.1.0
 Page 1 of 6 General Improvements for Version 8.1.0 Home > General Improvements for GainSeeker v8.1.0 Contents [Hide] New WebViz module Mixed Reports now combine SPC, DMS and Advanced retrievals Filters
Using vrealize Log Insight
 vrealize Log Insight 4.3 This document supports the version of each product listed and supports all subsequent versions until the document is replaced by a new edition. To check for more recent editions
Pivot Tables in Excel Contents. Updated 5/19/2016
 Pivot Tables in Excel 2010 Updated 5/19/2016 Contents Setup a Pivot Table in Excel 2010... 2 General Field List Features... 4 Summing and Counting Together... 6 Grouping Date Data... 7 Grouping Non-Date
Graphing on Excel. Open Excel (2013). The first screen you will see looks like this (it varies slightly, depending on the version):
. The first screen you will see looks like this (it varies slightly, depending on the version):") Graphing on Excel Open Excel (2013). The first screen you will see looks like this (it varies slightly, depending on the version): The first step is to organize your data in columns. Suppose you obtain
Graphing on Excel Open Excel (2013). The first screen you will see looks like this (it varies slightly, depending on the version): The first step is to organize your data in columns. Suppose you obtain
Datazen. Bent On-premise mobile BI. November 28, #sqlsatparma #sqlsat462
 Datazen On-premise mobile BI Bent Pedersen @Bent_n_pedersen www.biblog.eu Sponsors Organizers getlatestversion.it Who am i Senior Business Analytics Consultant at Kapacity 9 years with SQL Server Speaker
ScholarOne Manuscripts. COGNOS Reports User Guide
 ScholarOne Manuscripts COGNOS Reports User Guide 1-May-2018 Clarivate Analytics ScholarOne Manuscripts COGNOS Reports User Guide Page i TABLE OF CONTENTS USE GET HELP NOW & FAQS... 1 SYSTEM REQUIREMENTS...
Using vrealize Log Insight. April 12, 2018 vrealize Log Insight 4.6
 Using vrealize Log Insight April 12, 2018 vrealize Log Insight 4.6 You can find the most up-to-date technical documentation on the VMware website at: https://docs.vmware.com/ If you have comments about
Installation and Getting Started Guide Alchemex for MYOB Account Right
 Installation and Getting Started Guide Alchemex for MYOB Account Right Table of Contents Introduction... 1 What is Alchemex for MYOB Account Right?... 1 What are the benefits of using Alchemex for MYOB
Dbvisit Product and Company Website Copy
 Dbvisit Product and Company Website Copy To promote maximum effectiveness with our partnership, we are supplying you with Dbvisit copy for your website. Below you will find copy by Dbvisit Partner Type
Data acquisition hardware
 Data acquisition hardware Data acquisition (DAQ) is the process of sampling signals that measure real world physical conditions and converting the resulting samples into digital numeric values that can
KEMKRAFT ENGINEERING, INC. MODEL KEI-200A SPC DIGITAL INCLINOMETER
 INSTRUCTIONAL MANUAL SPC DIGITAL INCLINOMETER MODEL KEI-200A W/ BAR CODE OPTION REVISION DATE: JAN 26, 1999 96-014.doc Page 1 of 8 OPERATION PROCEDURE: This unit should be calibrated once a week minimum.
Content Management Systems. Week 14 LBSC 671 Creating Information Infrastructures
 Content Management Systems Week 14 LBSC 671 Creating Information Infrastructures Putting the Pieces Together Browser HTML CGI Web Server SQL Query Database HTML Results Why Database-Generated Pages? Remote
Pilot Pollution Analysis
 Pilot Pollution Analysis Based on UE or Scanner test data, Pilot Pollution Analysis is used to analyze the signal strength of serving and neighbor cells for 3/4G network technologies. The function analyzes
Miami s Quick Start Guide for Using. Snap 9 Professional. to Create a Paper Keyed Survey. Miami s Survey Solutions
 Miami s Quick Start Guide for Using Snap 9 Professional to Create a Paper Keyed Survey 1 Miami s Survey Solutions Snap 9 Professional Getting Started This Quick Start Guide is intended to help you become
ArcGIS Online: Managing Data. Jeremy Bartley Sentha Sivabalan
 ArcGIS Online: Managing Data Jeremy Bartley (jbartley@esri.com) Sentha Sivabalan (ssivabalan@esri.com) Agenda Creating and managing content like Apps, Maps, Scenes and Layers in ArcGIS Today s Topics:
DATA 301 Introduction to Data Analytics Visualization. Dr. Ramon Lawrence University of British Columbia Okanagan
 DATA 301 Introduction to Data Analytics Visualization Dr. Ramon Lawrence University of British Columbia Okanagan ramon.lawrence@ubc.ca DATA 301: Data Analytics (2) Why learn Visualization? Visualization
IHS Standards Expert FAQs
 IHS Standards Expert FAQs New IHS Standards Expert FAQs based on Customer First surveys How can I find out what is part of my subscription? How do I know what I have access to? There are two easy ways
WEBGATE400. Do you want to give a new life to your RPG programs and enrich them with innovative features?
 Modernize your RPG application and make it Windows and Internet native on the IBM Power System platform Do you want to give a new life to your RPG programs and enrich them with innovative features? Would
Campaign Manager Quick Reference Guide
 Campaign Manager Quick Reference Guide Table of Contents Campaign Manager Quick Reference Guide... 1 Accessing the Campaign Manager Menu... 3 Issue, Campaign, and Project Level Dashboard... 4 Activity
PeopleSoft Enterprise 9.2 Human Capital Management
 PeopleSoft Enterprise 9.2 Human Capital Management Delta Features and Enhancements Presented by: Tony Townsend, SpearMC Consulting www.spearmc.com 1-866-SPEARMC HCM 9.2 General Enhancements Human Resources
uniflow and SAP Systems
 WP_uF_SAP_V1_1_EN.doc Canon Ref: uniwp-017 uniflow and SAP Systems Version no:1.1 Stand: November 17, 2004 WP_uF_SAP_V1_1_EN.doc Version: 1.01 Date: November 17, 2004 First Draw-up Date: November 9, 2004
REPORTING Copyright Framework Private Equity Investment Data Management Ltd
 REPORTING Copyright Framework Private Equity Investment Data Management Ltd - 2016 Table of Contents Standard Reports... 3 Standard Report Pack... 4 General Data Protection and Framework... 7 Partner Bank
PRESENTING. TWS/WebAdmin. The Web Interface to TWS
 PRESENTING TWS/WebAdmin The Web Interface to TWS Table of Contents Introduction Plan Management Reports Forecasts/History Alerts Job Notes Click on one of the tabs to jump directly to that subject. Or
BUSINESS ANALYTICS. 96 HOURS Practical Learning. DexLab Certified. Training Module. Gurgaon (Head Office)
") SAS (Base & Advanced) Analytics & Predictive Modeling Tableau BI 96 HOURS Practical Learning WEEKDAY & WEEKEND BATCHES CLASSROOM & LIVE ONLINE DexLab Certified BUSINESS ANALYTICS Training Module Gurgaon
SAS (Base & Advanced) Analytics & Predictive Modeling Tableau BI 96 HOURS Practical Learning WEEKDAY & WEEKEND BATCHES CLASSROOM & LIVE ONLINE DexLab Certified BUSINESS ANALYTICS Training Module Gurgaon
Managing Oracle Real Application Clusters. An Oracle White Paper January 2002
 Managing Oracle Real Application Clusters An Oracle White Paper January 2002 Managing Oracle Real Application Clusters Overview...3 Installation and Configuration...3 Oracle Software Installation on a
Implementing Data Models and Reports with SQL Server 2014
 Course 20466D: Implementing Data Models and Reports with SQL Server 2014 Page 1 of 6 Implementing Data Models and Reports with SQL Server 2014 Course 20466D: 4 days; Instructor-Led Introduction The focus
A Guide to Creating QuickReports
 A Guide to Creating QuickReports Use QuickReports to produce lists, summaries and charts from the data in SupportDesk. If in the Windows application Access QuickReports, from Reporting within the Explorer
Quick Reference Card - Basic
 Process: Business Warehouse reports can be modified to meet the specific needs of the users. The following steps will show you how you can design your report layout to analyze the data. The techniques