Advanced Excel Skills
|
|
|
- Wilfred Jenkins
- 6 years ago
- Views:
Transcription
1 Advanced Excel Skills Note : This tutorial is based upon MSExcel If you are using MSExcel 2002, there may be some operations which look slightly different (e.g. pivot tables), but the same principles apply. Excel Tips for Data Management and Analysis The following document will explain some Excel functions that are extremely useful when manipulating and analysing large datasets (e.g. coverage, expenditures ). It focuses on skills that can be applied preparing for or developing Financial Sustainability Plans, as well as more broadly for managing any spreadsheet-based data. The first section will review some advanced Excel functions that simplify data management and avoid common mistakes during spreadsheet manipulations. The second section will inform you about the Analysis ToolPak that you can install on your computer for easy data and statistical analysis. An Excel file (Excel Advanced-English.xls) can be used to familiarise yourself with these functions. A DATA MANAGMENT Many of the data management function are located in you menu bar under DATA. The key functions reviewed in this document will be: Sort; AutoFilters; Subtotals and, Pivot Tables. Most of these functions can save you hours of work and minimize data manipulation errors. A.1 Essential Short Keys Before learning about some of the Excel functions listed above, it is useful to review some essential Excel Short keys. These will help you navigate through your worksheet with great ease and edit/manipulate your data much faster. Navigation Keys - Moving faster through your Worksheet/Workbook Ctrl + End Moves to the last cell in the used area of the worksheet Ctrl + Home Moves to the upper-left corner of the worksheet Ctrl + Page Up Moves to the previous worksheet in the workbook Ctrl + Page Down Moves to the next worksheet in the workbook Ctrl + Right Arrow Moves to the right-most region of data Ctrl + Left Arrow Moves to the left-most region of data Ctrl + Up Arrow Moves to the top region of data Ctrl + Down Arrow Moves to the bottom region of data Developed by Patrick Lydon (WHO), Alan Brooks (CVP/PATH), and Anne McArthur (CVP/PATH); Version 2 May, To download from internet: For more information: abrooks@path.org
2 Faster editing/selections in your Worksheet ESC Cancel an entry in the cell or formula bar Ctrl + Space Selects the entire column Ctrl + Space + (+ or ) Adds/deletes columns (need number pad to use +/- keys) Shift + Space Selects the entire line Shift + Space + (+ or ) Adds/deletes line (need number pad to use +/- keys) Ctrl + 1 Display the Format Cells dialog box. F2 Direct cell edit Practice Short Keys: Open the Excel file Excel Advanced-English.xlsand spend about 5 minutes trying some of the short keys above in one of the worksheets. After practising, CLOSE the file without SAVING before going on so that so that any changes you may have made to the worksheet don t alter the next activities. Page 2
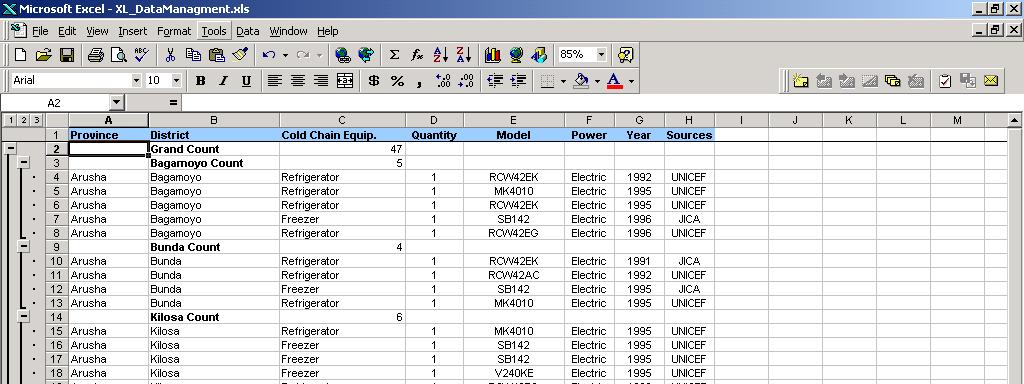
3 A.2 Sorting Sorting is the most frequently used data management function in Excel. Why Sort your Data? Since keeping track of your data is a common use of spreadsheets - like records of expenditures, coverage, target population - it is not unusual to want to change the order of the information (or records) in your worksheet. Sorting can also allow you to check the extremes or range of your data. For instance, sorting coverage data by province in ascending order will place the province with the lowest coverage at the top of the list, and the province with the maximum coverage at the end of your list. Finally, the Sort function is extremely useful when merging two different files together that have at least one common column. For example, if you have two files listing all the Districts in your country, but one showing program expenditures by District and the other showing program budget by District. You could sort both files by District name, then copy and paste the expenditure data into a column next to the budget data on one worksheet, allowing you to analyse and compare the data more easily. By sorting the District column in both files you can be sure the correct expenditure data remains in line with the correct District name and program budget data. If you would like an example of this using population and coverage data, open file Excel Advanced-English.xls, and go to worksheet Re-SortCoveragePop. Using the Sort Function When you sort, Excel rearranges rows, columns, or individual cells by using the sort order that you specify. You can sort lists in ascending (1 to 9, A to Z) or descending (9 to 1, Z to A) order, and sort based on the contents of one or more columns. Practice Sorting Data: Open the file Excel Advanced-English.xls if you haven t already, and make sure the worksheet Cold Chain is showing. You can see that the worksheet shows cold chain equipment for a set of provinces and districts, organised by columns. You also notice that data is first sorted alphabetically by the name of the province, and then by the name of the district. Short Key Sorting Method 1. It is always prudent to save your file prior to using a function. (If you make a mistake you can always close down without saving and retrieve your original file). 2. Let s say you want to know who has the oldest cold chain equipment so you can begin planning how many refrigerators and freezers may need to be replaced in each of the next 5 years. Click at the top data cell in the column you would like to sort by, for example cell F2. Generally avoid clicking the column title to minimise the chance that Excel will sort it as well. Page 3
4 3. Press Shift & Space Bar (at the same time). This will then select the remainder of the row, while still identifying to Excel the column you want to sort by. 4. Then press Shift End & Down (at the same time). This highlights the remainder of the cells while still identifying to Excel the column you want to sort by. 5. On the Tool bar click on the Sort Icon (either ascending or descending.) 6. All the columns on the worksheet should be automatically resorted according to the year of the equipment, allowing easy estimation of how many of what equipment may need to be replaced in each year. Warning: Always be cautious when sorting to make sure data remains associated correctly with one another. The technique above should ensure this happens. However, if only some of the columns get sorted, and Excel can be tricky about this sometimes, you run the risk of getting different columns of data out of order. And remember that you can use the EDIT-UNDO and REDO features to go back and forth after sorting to verify that rows have the correct data. Regular Sorting Method Excel allows you to do one or multiple sorting at once. For example, look at the Cold Chain worksheet again. You could determine in what year, what source (UNICEF, JICA, etc) was supporting what models of equipment. This might give a program manager an idea of what agency to approach again for new, updated equipment. To do multiple sorting: 1. Click any cell with data. 2. Go to menu DATA-SORT 3. Excel automatically highlights the cells it intends to include in the sort (in this case it should be cells from A2 to H47.) 4. In the dialogue box which appears (see below), Select: Sort by: Year (Ascending) Then by: Sources (Ascending) Then by: Model (Ascending) The Cold Chain worksheet does have a Header or title row. Stipulating that were asked avoids including it in the sort. 5. Then click OK Page 4

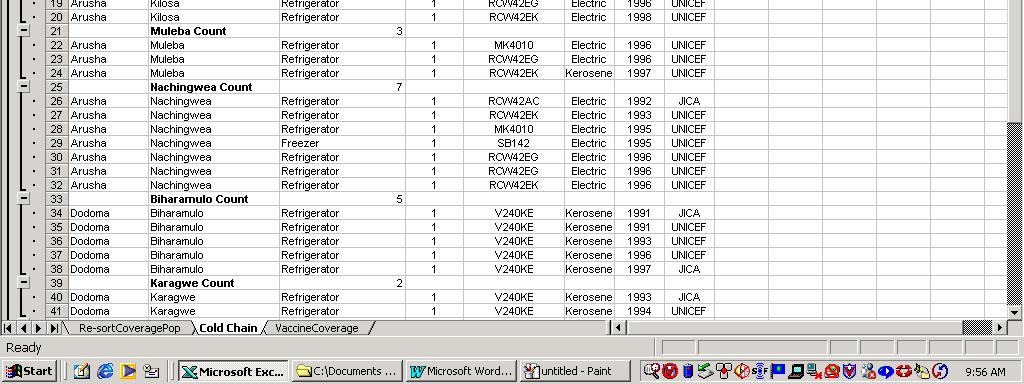
5 The resorted data should show that for example, JICA bought 3 refrigerators in 1991, and UNICEF bought one, as well as clearly showing the model and quantity. Warning: Always be cautious when sorting to make sure data remains associated correctly with one another. If only some of the columns get sorted, you run the risk of getting different columns of data out of order. And remember that you can use the EDIT-UNDO and REDO features to go back and forth after sorting to verify that rows have the correct data. Page 5

6 A.2 AutoFilter The AutoFilter is not as well know to most Excel users but is a useful function for quickly viewing your data. Why use a filter? Filtering lets you explore data in Excel by allowing you to view the data that meets your chosen criteria. Excel's AutoFilter function makes it easy to hide everything in a database except the records you want to see. When you choose the AutoFilter command, Excel inserts drop-down list buttons to every cell with a field name in that row. This will allow you to filter all your columns. To add a filter on one particular range of data, first highlight the column of information you wish to filter and then select AutoFilter. Practice - Creating a Filter: Open the file Excel Advanced-English.xls, and select the worksheet Cold Chain. All you have to do to filter a database is: 1. Position the cell pointer some place on the worksheet (e.g. on Cold Chain) 2. Go to menu DATA-FILTER-AUTOFILTER as shown below 1. Click any columns drop-down list button (top right of each column) to open a list box containing all the entries made in that field and select the one you want to use as a filter. You can note that Excel inserts a drop-down list buttons to every column. This will allow you to do filter one or many columns. Page 6


7 2. Excel then displays only those records that contain the value you selected in that field (all other records are temporarily hidden). The example below shows a multiple filter to view only the cold chain equipment in Makete district that was purchased in The Filter criteria s were District (selecting Makete) and Year (selecting 1995). Try this on the Cold Chain worksheet. 3. When you want to display all the records in the database again, choose menu DATA- FILTER-SHOW ALL. Alternatively you can also remove a filter from a particular field by selecting its drop-down list button and then selecting the All option at the top of the drop-down list. Page 7

8 A.3 Subtotals Excel's Subtotal function is an excellent way to summarize data contained in a sorted dataset. Why use Subtotals? You can sum, count, average, etc groups of data in your dataset. For instance, you might want to count the number of cold chain equipment you have in each province, and have it subtotal with each change to the data. Practice: Creating a Subtotal Open the file Excel Advanced-English.xls if you haven t already, and make sure the worksheet Cold Chain is showing. 1. Sort the list by the column for which you want to calculate subtotals. In this case, use the DATA-SORT feature to sort the data by Province then District. The dataset must be sorted according to whatever column(s) is used for subtotalling. 2. Click a cell in the list 3. Select menu DATA-SUBTOTAL 4. In the At each change in box, click the column that contains the groups for which you want subtotal. That way a subtotal will reflect the function below for one province then the next, or for one district then the next. For example, select District 5. In the Use functions box, select if you want to sum, average, count. Select Count. 6. In the Add Subtotal to box, select the column where you would like the subtotal. Select Cold Chain Equip. The result of the subtotals are a Grand Total at the top, then subtotals showing the number of items of cold chain equipment listed for each district. Page 8
9 Page 9

10 A.4 Pivot Table Pivot tables are extremely powerful tool to use if your data is normalized. It can save a great deal of time when you are processing your data. Why Use a Pivot Table? Pivot tables provide a way to easily summarize, analyze, consolidate, filter, prepare data for charting, and report on large quantities of raw data in a fast, flexible, and ad hoc manner. They are called pivot tables because you can change their layout by rearranging, or pivoting, the row and column headings quickly and easily. Warning: Data must generally be constructed as that we ve used (e.g. Cold Chain), with one or more classifications (e.g. Province and District) along one row with additional variables or pieces of data continuing along the row, all pertaining to the original classifications. Such a standardised format for data allows one to take most advantage of Excel s features. This is known as normalized data. Practice: Creating a Pivot Table Creating a Pivot Table is very easy. All you need to do is follow the Pivot Table Wizard. Open the file Excel Advanced-English.xls if you haven t already, and make sure the worksheet Vaccine Coverage is showing. 1. Select the first cell of the range (e.g. cell A1) before starting the Pivot Table Wizard, Excel will automatically search down and to the right to find the range's extent and use that range in the pivot table. The easiest option is to click on the upper-leftmost cell of the range. 2. Go to menu DATA-PIVOT CHART REPORT. 3. In the first dialog box, choose "Microsoft Excel list or database", and click "Next". Page 10


11 4. In the second dialog box, accept the "Range" by clicking "Next". Excel will help select the range of data you wish to Pivot including headers/titles to you columns. 5. The third dialog box should look similar to below. Select where you would like to put your Pivot table and click on Finish. Excel will open a new worksheet which looks like the picture below. Page 11

12 The menu in the middle (PivotTable) shows the titles of all the columns from the original spreadsheet. Behind outlined in blue, one can see areas where the different column headings can be dragged and dropped. Buttons at the right of the dialog box represents the data fields. You drag and drop the buttons to create the desired layout of your table. If you place the wrong field onto the table you can remove it by dragging it anywhere outside the table. Row: Column: Page: Data: Contains the field(s) to be used as row titles Contains the field(s) to be used as column titles Is used to filter the row and column data for a particular Page field value. A Page dropdown will contain all the unique values for the field(s) contained in Page. At least one field must be placed in the data area. This will be the summary data that is reported inside the rows and columns of the pivot table. The same field can be placed in the data area more than once. Important: Excel always makes a Pivot Table perform a mathematics function, generally adding or counting what is placed in the data field. Note that numeric fields will default to Sum and non-numeric fields will default to Count for the summary statistic. You can change the default summarization type by double-clicking on the button in the data area and selecting a different calculation type (Sum, Count, Average, Min, Max ). Page 12

13 Let s give it a try. Drag the word Vaccine and drop it on the column bar. Drag the word Province and put it in the row bar. Drag the word coverage and put it in the Data section. You should get the following. What does it show? --The top left corner shows that the operation Excel performed was to Sum of Coverage. Therefore, Excel went to every place where Arusha reported a coverage number for BCG, for example, and added them all up, to So it added the 1999, 2000, and 2001 coverage together the output is totally meaningless. This illustrates that one must be cautious with excel tables, and their interpretation. Let s look at the data again, but first double click on the top left corner saying Sum of Coverage. Select Average of Coverage. You get the table as below. Page 13

14 What does the data show? It now shows the average coverage for each vaccine, from 1999 to So the average coverage for BCG in Arusha over these three years was 89%. The data is reported with 2-4 decimal places. To make it easier to read, select all the cells with numbers, then push the, button on the toolbar, then press the button to decrease decimal places. Notice that a filter is available on the year (shown as All ), so aggregate data for one or more years can be shown. Notice also that by default Excel will provide you with Grand Totals, although in some cases they may not be relevant or meaningful. The grand totals could be particularly useful when using Pivot Tables for financing data. You can add additional fields into the row or column headings. Give it a try, but be cautious as the data can get pretty complex to interpret. There s a sample shown below. Page 14


15 If Vaccine had been put where Year was placed, on the Page section, it would have allowed a similar sheet, but showing one or all vaccines for 3 years. If you have time, try to construct such a Pivot Table. While vaccine coverage data was used to illustrate pivot tables, they cab be quite useful for tracking, presenting, and analysing budget and expenditure data over time. Page 15

16 B DATA ANALYSIS The analysis ToolPak that is available in Excel is a useful Add-in to activate. As an Add-in you must specifically activate for it to be available. It will allow you to do descriptive and more advanced statistics at the click of the mouse. For example it quickly gives you the mean (average), median, statistical difference, and other basic statistics for a set of numbers. These types of analysis don t pertain as frequently, possibly, to financial analysis, but are likely useful as part of general program management and for interpreting immunisation data. Enabling Analysis ToolPak If the TOOLS menu does not have an option for DATA ANALYSIS, you need to install the Analysis ToolPak in Microsoft Excel. To install the Analysis ToolPak 1. On the TOOLS menu, click ADD-INS. 2. Select the Analysis ToolPak check box. Practice: Analysis ToolPak Open the file Excel Advanced-English.xls if you haven t already, and make sure the worksheet Vaccine Coverage is showing. Example: Analysing the recent Measles coverage for Arusha Province. 1. Before using an analysis tool, you must arrange the data you want to analyse in columns or rows on your worksheet. This is your input range. Use the SORT command to sort the table by Province, then Vaccine, then Coverage. Remember you can do this all in one step using the SORT command. 2. On the TOOLS menu, click DATA ANALYSIS. Page 16


17 3. In the Analysis Tools box, click Descriptive Statistics. 4. Enter the input range and the output range by highlighting the numbers you want analysed, and then select the options you want (See below). Page 17
18 5. When you click OK, the results are presented in a table, similar to below: Column1 Mean Standard Error Median Mode #N/A Standard Deviation Sample Variance Kurtosis #DIV/0! Skewness Range Minimum Maximum Sum Count 3.00 This shows, among other things, that over the past three years in Arusha Province, Measles coverage has averaged (mean) 43%, the median was 52%, and the minimum and maximum reported coverage was 12% and 65% respectively. Conclusion In this module, we worked through some advanced Excel skills. Mastery of a program like Excel takes much time and use. However the skills covered in this are some of the most commonly used and useful for financial and programmatic analysis. And when things don t seem to be working correctly, don t forget to try the excellent HELP menu. Just type your question and Excel will help try to find the item you are interested in. Page 18

19 Some other skills you may want to investigate if you are not familiar with them: Dragging Formulas: Excel is excellent for inserting a number or formula into one cell, then dragging it in any direction to apply to other cells. This is a great way to save time. Note that using a $ in a function means that the number will not change when moved, or drug to another cell. Logical Functions (See below) True/False: These can be verify powerful ways of validating data. For example, a cell can be told to return a FALSE statement if certain conditions aren t met in other data. This can be used to verify validity of data. IF: The IF function can be used to apply a set of conditions for a total to be returned, and what should be given, if those conditions aren t met. Paste Link: Sometimes the same piece of data, cost or number should be reflected in more than one place on a worksheet, or even on more than one worksheet. This is an ideal time to use PASTE SPECIAL - PASTE LINK. Then, when one changes the original cell, the change is automatically reflected in all the other linked cells. Clicking on the linked cell shows that it has only the location of the source cell (e.g. =B5.) This can be particularly useful if for example you have a currency exchange rate you are applying to multiple numbers. If all the calculations link back to one cell, adjusting that one cell with a new exchange rate automatically adjusts all the linked data. Page 19
Basic Microsoft Excel Skills
 Basic Microsoft Excel Skills Note : This tutorial is based upon Microsoft Excel 2000. If you are using MSExcel 1997 or 2002, there may be some operations which look slightly different (e.g. graphs), but
Tutorial 5: Working with Excel Tables, PivotTables, and PivotCharts. Microsoft Excel 2013 Enhanced
 Tutorial 5: Working with Excel Tables, PivotTables, and PivotCharts Microsoft Excel 2013 Enhanced Objectives Explore a structured range of data Freeze rows and columns Plan and create an Excel table Rename
Excel 2007/2010. Don t be afraid of PivotTables. Prepared by: Tina Purtee Information Technology (818)
") Information Technology MS Office 2007/10 Users Guide Excel 2007/2010 Don t be afraid of PivotTables Prepared by: Tina Purtee Information Technology (818) 677-2090 tpurtee@csun.edu [ DON T BE AFRAID OF
Information Technology MS Office 2007/10 Users Guide Excel 2007/2010 Don t be afraid of PivotTables Prepared by: Tina Purtee Information Technology (818) 677-2090 tpurtee@csun.edu [ DON T BE AFRAID OF
EXCEL Using Excel for Data Query & Management. Information Technology. MS Office Excel 2007 Users Guide. IT Training & Development
 Information Technology MS Office Excel 2007 Users Guide EXCEL 2007 Using Excel for Data Query & Management IT Training & Development (818) 677-1700 Training@csun.edu TABLE OF CONTENTS Introduction... 1
Introductory Excel Walpole Public Schools. Professional Development Day March 6, 2012
 Introductory Excel 2010 Walpole Public Schools Professional Development Day March 6, 2012 By: Jessica Midwood Agenda: What is Excel? How is Excel 2010 different from Excel 2007? Basic functions of Excel
New Perspectives on Microsoft Excel Module 5: Working with Excel Tables, PivotTables, and PivotCharts
 New Perspectives on Microsoft Excel 2016 Module 5: Working with Excel Tables, PivotTables, and PivotCharts Objectives, Part 1 Explore a structured range of data Freeze rows and columns Plan and create
Excel Shortcuts Increasing YOUR Productivity
 Excel Shortcuts Increasing YOUR Productivity CompuHELP Division of Tommy Harrington Enterprises, Inc. tommy@tommyharrington.com https://www.facebook.com/tommyharringtonextremeexcel Excel Shortcuts Increasing
DESCRIPTION 1 TO DEFINE A NAME 2. USING RANGE NAMES 2 Functions 4 THE IF FUNCTION 4 THE VLOOKUP FUNCTION 5 THE HLOOKUP FUNCTION 6
 Table of contents The use of range names 1 DESCRIPTION 1 TO DEFINE A NAME 2 USING RANGE NAMES 2 Functions 4 THE IF FUNCTION 4 THE VLOOKUP FUNCTION 5 THE HLOOKUP FUNCTION 6 THE ROUND FUNCTION 7 THE SUMIF
Basics of Spreadsheet
 106 :: Data Entry Operations 6 Basics of Spreadsheet 6.1 INTRODUCTION A spreadsheet is a large sheet having data and information arranged in rows and columns. As you know, Excel is one of the most widely
Patricia Andrada Quick Guide Excel 2010 Data Management-July 2011 Page 1
 Patricia Andrada Quick Guide Excel 2010 Data Management-July 2011 Page 1 Excel 2010 Data Management AutoFill and Custom Lists AutoFill 1. Select the range that contains the initial value(s) of the series
Excel Level 1
 Excel 2016 - Level 1 Tell Me Assistant The Tell Me Assistant, which is new to all Office 2016 applications, allows users to search words, or phrases, about what they want to do in Excel. The Tell Me Assistant
Excel Tables & PivotTables
 Excel Tables & PivotTables A PivotTable is a tool that is used to summarize and reorganize data from an Excel spreadsheet. PivotTables are very useful where there is a lot of data that to analyze. PivotTables
Excel Tables and Pivot Tables
 A) Why use a table in the first place a. Easy to filter and sort if you only sort or filter by one item b. Automatically fills formulas down c. Can easily add a totals row d. Easy formatting with preformatted
Microsoft Excel 2010 Tutorial
 1 Microsoft Excel 2010 Tutorial Excel is a spreadsheet program in the Microsoft Office system. You can use Excel to create and format workbooks (a collection of spreadsheets) in order to analyze data and
Creating a Pivot Table
 Contents Introduction... 1 Creating a Pivot Table... 1 A One-Dimensional Table... 2 A Two-Dimensional Table... 4 A Three-Dimensional Table... 5 Hiding and Showing Summary Values... 5 Adding New Data and
Quick Guide for Excel 2015 Data Management November 2015 Training:
 http://pfw.edu Quick Guide for Excel 2015 Data Management November 2015 Training: http://pfw.edu/training Excel 2016 Data Management AutoFill and Custom Lists AutoFill 1. Select the range that contains
EXCEL TUTORIAL.
 EXCEL TUTORIAL Excel is software that lets you create tables, and calculate and analyze data. This type of software is called spreadsheet software. Excel lets you create tables that automatically calculate
Excel 2007 New Features Table of Contents
 Table of Contents Excel 2007 New Interface... 1 Quick Access Toolbar... 1 Minimizing the Ribbon... 1 The Office Button... 2 Format as Table Filters and Sorting... 2 Table Tools... 4 Filtering Data... 4
Formulas, LookUp Tables and PivotTables Prepared for Aero Controlex
 Basic Topics: Formulas, LookUp Tables and PivotTables Prepared for Aero Controlex Review ribbon terminology such as tabs, groups and commands Navigate a worksheet, workbook, and multiple workbooks Prepare
Chapter 9 Data Analysis
 Calc Guide Chapter 9 Data Analysis Using Scenarios, Goal Seek, Solver, others Copyright This document is Copyright 2010-2012 by its contributors as listed below. You may distribute it and/or modify it
Export a PROTECT Report to Excel (User s Guide Lesson 21 : Reports) Tips for Using Microsoft Excel and Exported Reports
 Tips for Using Microsoft Excel and Exported Reports") Export a PROTECT Report to Excel (User s Guide Lesson 21 : Reports) 1. Run a PROTECT Export report 2. Click the Export button which is at far left on the toolbar in the PROTECT report window. 3. The Export
Export a PROTECT Report to Excel (User s Guide Lesson 21 : Reports) 1. Run a PROTECT Export report 2. Click the Export button which is at far left on the toolbar in the PROTECT report window. 3. The Export
Microsoft Excel 2013/2016 Pivot Tables
 Microsoft Excel 2013/2016 Pivot Tables Creating PivotTables PivotTables are powerful data analysis tools. They let you summarize data in various ways and instantly change the view you use. A PivotTable
1. Managing Information in Table
 1. Managing Information in Table Spreadsheets are great for making lists (such as phone lists, client lists). The researchers discovered that not only was list management the number one spreadsheet activity,
THE EXCEL ENVIRONMENT... 1 EDITING...
 Excel Essentials TABLE OF CONTENTS THE EXCEL ENVIRONMENT... 1 EDITING... 1 INSERTING A COLUMN... 1 DELETING A COLUMN... 1 INSERTING A ROW... DELETING A ROW... MOUSE POINTER SHAPES... USING AUTO-FILL...
Microsoft Office Excel 2007
 Microsoft Office Excel 2007 Data Processing in Spreadsheets 1/28/2009 Microsoft Excel 1 Use Excel s functions! A function is a predefined (built-in) formula for commonly used calculations. Each Excel function
Rev. C 11/09/2010 Downers Grove Public Library Page 1 of 41
 Table of Contents Objectives... 3 Introduction... 3 Excel Ribbon Components... 3 Office Button... 4 Quick Access Toolbar... 5 Excel Worksheet Components... 8 Navigating Through a Worksheet... 8 Making
Chapter 4. Microsoft Excel
 Chapter 4 Microsoft Excel Topic Introduction Spreadsheet Basic Screen Layout Modifying a Worksheet Formatting Cells Formulas and Functions Sorting and Filling Borders and Shading Charts Introduction A
Mathematical Operators for Excel
 EXCEL ADVANCED 1 Mathematical Operators for Excel < > = >=
Creating a Spreadsheet by Using Excel
 The Excel window...40 Viewing worksheets...41 Entering data...41 Change the cell data format...42 Select cells...42 Move or copy cells...43 Delete or clear cells...43 Enter a series...44 Find or replace
1 Introduction to Using Excel Spreadsheets
 Survey of Math: Excel Spreadsheet Guide (for Excel 2007) Page 1 of 6 1 Introduction to Using Excel Spreadsheets This section of the guide is based on the file (a faux grade sheet created for messing with)
Excel Tutorial 5: Working with Excel Tables, PivotTables, and PivotCharts. 6. You can use a table s sizing handle to add columns or rows to a table.
 Excel Tutorial 5: Working with Excel Tables, PivotTables, and PivotCharts TRUE/FALSE 1. The header row must be row 1. ANS: F PTS: 1 REF: EX 234 2. If you freeze the top row in a worksheet and press Ctrl+Home,
VII. Data Management Essentials
 VII. Sort Excel recognizes a list or data set if the data in the list is contiguous, bordered by blank cells or an edge of the worksheet, and has labels that are differentiated in some way from the data.
1. Managing Information in Table
 1. Managing Information in Table Spreadsheets are great for making lists (such as phone lists, client lists). The researchers discovered that not only was list management the number one spreadsheet activity,
Working with Data in Microsoft Excel 2010
 Working with Data in Microsoft Excel 2010 This document provides instructions for using the sorting and filtering features in Microsoft Excel, as well as working with multiple worksheets in the same workbook
Pivot Tables in Excel Contents. Updated 5/19/2016
 Pivot Tables in Excel 2010 Updated 5/19/2016 Contents Setup a Pivot Table in Excel 2010... 2 General Field List Features... 4 Summing and Counting Together... 6 Grouping Date Data... 7 Grouping Non-Date
Copyright 2018 MakeUseOf. All Rights Reserved.
 The Beginner s Guide to Microsoft Excel Written by Sandy Stachowiak Published April 2018. Read the original article here: https://www.makeuseof.com/tag/beginners-guide-microsoftexcel/ This ebook is the
EDIT202 Spreadsheet Lab Prep Sheet
 EDIT202 Spreadsheet Lab Prep Sheet While it is clear to see how a spreadsheet may be used in a classroom to aid a teacher in marking (as your lab will clearly indicate), it should be noted that spreadsheets
Good Byer Stores Australia Ltd Inventory - Whitegoods department
 Managing Data Lists Chapter 1 Excel has some excellent features that make working with lists easy. Lists of records can be sorted, searched and filtered to produce useful information. Good Byer Stores
How to Create and Use a Pivot Table in Excel
 How to Create and Use a Pivot Table in Excel Nikki Casasanto What you need Microsoft Office: Excel 2013 Data Why use a Pivot Table? Microsoft Excel pivot tables offer a way to quickly summarize data. It
Introduction to Microsoft Excel 2010
 Introduction to Microsoft Excel 2010 This class is designed to cover the following basics: What you can do with Excel Excel Ribbon Moving and selecting cells Formatting cells Adding Worksheets, Rows and
Excel Tips for Compensation Practitioners Weeks Pivot Tables
 Excel Tips for Compensation Practitioners Weeks 23-28 Pivot Tables Week 23 Creating a Pivot Table Pivot tables are one of the most amazing and powerful tools in Excel, but many users do not know how to
Excel Advanced
 Excel 2016 - Advanced LINDA MUCHOW Alexandria Technical & Community College 320-762-4539 lindac@alextech.edu Table of Contents Macros... 2 Adding the Developer Tab in Excel 2016... 2 Excel Macro Recorder...
Advanced Excel Selecting and Navigating Cells
 Advanced Excel 2007 One major organizational change in Excel 2007, when compared to 2003, is the introduction of ribbons. Each ribbon reveals many more options depending on what tab is selected. The Help
Using Tables, Sparklines and Conditional Formatting. Module 5. Adobe Captivate Wednesday, May 11, 2016
 Slide 1 - Using Tables, Sparklines and Conditional Formatting Using Tables, Sparklines and Conditional Formatting Module 5 Page 1 of 27 Slide 2 - Lesson Objectives Lesson Objectives Explore the find and
Creating an Excel resource
 Excel Mobile Excel Mobile is a Microsoft application similar to Excel, but designed to run on handhelds. This mobile version of Excel is a spreadsheet application that allows you to manipulate numbers,
Data Should Not be a Four Letter Word Microsoft Excel QUICK TOUR
 Toolbar Tour AutoSum + more functions Chart Wizard Currency, Percent, Comma Style Increase-Decrease Decimal Name Box Chart Wizard QUICK TOUR Name Box AutoSum Numeric Style Chart Wizard Formula Bar Active
Working with Data and Charts
 PART 9 Working with Data and Charts In Excel, a formula calculates a value based on the values in other cells of the workbook. Excel displays the result of a formula in a cell as a numeric value. A function
A Tutorial for Excel 2002 for Windows
 INFORMATION SYSTEMS SERVICES Data Manipulation with Microsoft Excel 2002 A Tutorial for Excel 2002 for Windows AUTHOR: Information Systems Services DATE: August 2004 EDITION: 1.0 TUT 130 UNIVERSITY OF
WAAT-PivotTables Accounting Seminar
 WAAT-PivotTables-08-26-2016-Accounting Seminar Table of Contents What does a PivotTable do?... 2 How to create PivotTable:... 2 Add conditions to the PivotTable:... 2 Grouping Daily Dates into Years, Quarters,
Candy is Dandy Project (Project #12)
") Candy is Dandy Project (Project #12) You have been hired to conduct some market research about M&M's. First, you had your team purchase 4 large bags and the results are given for the contents of those
Candy is Dandy Project (Project #12) You have been hired to conduct some market research about M&M's. First, you had your team purchase 4 large bags and the results are given for the contents of those
Quick Reference Summary
 Microsoft Excel 2010 Quick Reference Summary Microsoft Excel 2010 Quick Reference Summary 3-D Chart, Rotate EX 462 3-D Rotation button (Chart Tools Layout tab Background, change rotation (Format Chart
Lastly, in case you don t already know this, and don t have Excel on your computers, you can get it for free through IT s website under software.
 Welcome to the EASE workshop series, part of the STEM Gateway program. Before we begin, I want to make sure we are clear that this is by no means meant to be an all inclusive class in Excel. At each step,
Excel 2010: Basics Learning Guide
 Excel 2010: Basics Learning Guide Exploring Excel 2010 At first glance, Excel 2010 is largely the same as before. This guide will help clarify the new changes put into Excel 2010. The File Button The purple
Excel 2013 for Beginners
 Excel 2013 for Beginners Class Objective: This class will familiarize you with the basics of using Microsoft Excel. Class Outline: Introduction to Microsoft Excel 2013... 1 Microsoft Excel...2-3 Getting
Kenora Public Library. Computer Training. Introduction to Excel
 Kenora Public Library Computer Training Introduction to Excel Page 2 Introduction: Spreadsheet programs allow users to develop a number of documents that can be used to store data, perform calculations,
Excel 2016 Intermediate for Windows
 1 Excel 2016 Intermediate for Windows Excel Intermediate Training Objective To learn the tools and features of Excel 2016, and gain vital skills to use Excel more efficiently and effectively. What you
Using Microsoft Excel
 Using Microsoft Excel Table of Contents The Excel Window... 2 The Formula Bar... 3 Workbook View Buttons... 3 Moving in a Spreadsheet... 3 Entering Data... 3 Creating and Renaming Worksheets... 4 Opening
PHLI Instruction (734) Introduction. Lists.
 Introduction. Lists.") INTERMEDIATE EXCEL Introduction Microsoft Excel has many purposes. In addition to being an excellent data manger, Excel provides the means to perform complex analysis and evaluation of data. This brief
INTERMEDIATE EXCEL Introduction Microsoft Excel has many purposes. In addition to being an excellent data manger, Excel provides the means to perform complex analysis and evaluation of data. This brief
Spreadsheet Applications Test
 Spreadsheet Applications Test 1. The expression returns the maximum value in the range A1:A100 and then divides the value by 100. a. =MAX(A1:A100/100) b. =MAXIMUM(A1:A100)/100 c. =MAX(A1:A100)/100 d. =MAX(100)/(A1:A100)
Introduction to Excel 2013
 Introduction to Excel 2013 Copyright 2014, Software Application Training, West Chester University. A member of the Pennsylvania State Systems of Higher Education. No portion of this document may be reproduced
COPYRIGHTED MATERIAL. Making Excel More Efficient
 Making Excel More Efficient If you find yourself spending a major part of your day working with Excel, you can make those chores go faster and so make your overall work life more productive by making Excel
Skill Set 5. Outlines and Complex Functions
 Spreadsheet Software OCR Level 3 ITQ Skill Set 5 Outlines and Complex Functions By the end of this Skill Set you should be able to: Create an Outline Work with an Outline Create Automatic Subtotals Use
Spreadsheet definition: Starting a New Excel Worksheet: Navigating Through an Excel Worksheet
 Copyright 1 99 Spreadsheet definition: A spreadsheet stores and manipulates data that lends itself to being stored in a table type format (e.g. Accounts, Science Experiments, Mathematical Trends, Statistics,
How to Set up a Budget Advanced Excel Part B
 How to Set up a Budget Advanced Excel Part B A budget is probably the most important spreadsheet you can create. A good budget will keep you focused on your ultimate financial goal and help you avoid spending
Excel Foundation Quick Reference (Windows PC)
") Excel Foundation Quick Reference (Windows PC) See https://staff.brighton.ac.uk/is/training/pages/excel/foundation.aspx for videos and exercises to accompany this quick reference card. Structure of a spreadsheet
Excel Foundation Quick Reference (Windows PC) See https://staff.brighton.ac.uk/is/training/pages/excel/foundation.aspx for videos and exercises to accompany this quick reference card. Structure of a spreadsheet
Intro To Excel Spreadsheet for use in Introductory Sciences
 INTRO TO EXCEL SPREADSHEET (World Population) Objectives: Become familiar with the Excel spreadsheet environment. (Parts 1-5) Learn to create and save a worksheet. (Part 1) Perform simple calculations,
Filter and PivotTables in Excel
 Filter and PivotTables in Excel FILTERING With filters in Excel you can quickly collapse your spreadsheet to find records meeting specific criteria. A lot of reporters use filter to cut their data down
GO! with Microsoft Excel 2016 Comprehensive
 GO! with Microsoft Excel 2016 Comprehensive First Edition Chapter 7 Creating PivotTables and PivotCharts Learning Objectives Create a PivotTable Report Use Slicers and Search Filters Modify a PivotTable
Excel Introduction to Excel Databases & Data Tables
 Creating an Excel Database Key field: Each record should have some field(s) that helps to uniquely identify them, put these fields at the start of your database. In an Excel database each column is a field
download instant at
 CHAPTER 1 - LAB SESSION INTRODUCTION TO EXCEL INTRODUCTION: This lab session is designed to introduce you to the statistical aspects of Microsoft Excel. During this session you will learn how to enter
Microsoft Excel Level 2
 Microsoft Excel Level 2 Table of Contents Chapter 1 Working with Excel Templates... 5 What is a Template?... 5 I. Opening a Template... 5 II. Using a Template... 5 III. Creating a Template... 6 Chapter
Getting the Most from your Microsoft Excel
 Getting the Most from your Microsoft Excel Anne Del Pizzo PATHS, LLC What we will cover What s new in 2007/2010 Conditional formatting Sparklines Pivot Table Slicers Functions Macros Pivot Tables 1 What
Introducing Microsoft Office Specialist Excel Module 1. Adobe Captivate Wednesday, May 11, 2016
 Slide 1 - Introducing Microsoft Office Specialist Excel 2013 Introducing Microsoft Office Specialist Excel 2013 Module 1 Page 1 of 25 Slide 2 - Lesson Objectives Lesson Objectives Understand what Microsoft
Microsoft Excel 2010 Handout
 Microsoft Excel 2010 Handout Excel is an electronic spreadsheet program you can use to enter and organize data, and perform a wide variety of number crunching tasks. Excel helps you organize and track
GOOGLE SHEETS MANAGING YOUR DATA
 GOOGLE SHEETS MANAGING YOUR DATA TABLE OF CONTENTS USING GOOGLE SHEETS AS A DATABASE... 1 CREATING A DATABASE... 2 DATA MENU... 3 SORTING LISTS... 4 SORTING IN ASCENDING/DESCENDING ORDER... 5 FILTERING
CHAPTER TWO: SPREADS HEETS WITH EXCEL 1
 CHAPTER TWO: SPREADS HEETS WITH EXCEL 1 CHAPTER 2 SPREADSHEETS WITH EXCEL TOPIC Create Pivot Tables Create and Modify Charts Sort and Filter CHAPTER TWO: SPREADS HEETS WITH EXCEL 2 CREATE AND MODIFY CHARTS
Microsoft Excel 2010
 www.jadehorizon.com Microsoft Excel 2010 Sorting and Filtering Sorting and Filtering Microsoft Excel 2010 Table of Contents Table of Contents INTRODUCTION... 3 CONVENTIONS... 3 TABLE DESIGN RULES... 5
Microsoft How to Series
 Microsoft How to Series Getting Started with EXCEL 2007 A B C D E F Tabs Introduction to the Excel 2007 Interface The Excel 2007 Interface is comprised of several elements, with four main parts: Office
Sample Chapters. To learn more about this book, visit the detail page at: go.microsoft.com/fwlink/?linkid= Copyright 2010 by Curtis Frye
 Sample Chapters Copyright 2010 by Curtis Frye All rights reserved. To learn more about this book, visit the detail page at: go.microsoft.com/fwlink/?linkid=191751 Chapter at a Glance Analyze data dynamically
SPREADSHEET (Excel 2007)
") SPREADSHEET (Excel 2007) 1 U N I T 0 4 BY I F T I K H A R H U S S A I N B A B U R Spreadsheet Microsoft Office Excel 2007 (or Excel) is a computer program used to enter, analyze, and present quantitative
SPREADSHEET (Excel 2007) 1 U N I T 0 4 BY I F T I K H A R H U S S A I N B A B U R Spreadsheet Microsoft Office Excel 2007 (or Excel) is a computer program used to enter, analyze, and present quantitative
Survey of Math: Excel Spreadsheet Guide (for Excel 2016) Page 1 of 9
 Page 1 of 9") Survey of Math: Excel Spreadsheet Guide (for Excel 2016) Page 1 of 9 Contents 1 Introduction to Using Excel Spreadsheets 2 1.1 A Serious Note About Data Security.................................... 2 1.2
Survey of Math: Excel Spreadsheet Guide (for Excel 2016) Page 1 of 9 Contents 1 Introduction to Using Excel Spreadsheets 2 1.1 A Serious Note About Data Security.................................... 2 1.2
Microsoft Excel Keyboard Shortcuts
 Microsoft Excel Keyboard Shortcuts Here is a complete list of keyboard shortcuts for Microsoft Excel. Most of the shortcuts will work on all Excel versions on Windows based computer. Data Processing Shortcuts
SAMaRT User Guide Microsoft Excel (Advanced version)
") SAMaRT User Guide Microsoft Excel (Advanced version) Before you start...2 Macros...2 Exploring the tool...2 Using the tool for the first time...3 Introduction page...3 Changing the drop down list options...3
SAMaRT User Guide Microsoft Excel (Advanced version) Before you start...2 Macros...2 Exploring the tool...2 Using the tool for the first time...3 Introduction page...3 Changing the drop down list options...3
SUM - This says to add together cells F28 through F35. Notice that it will show your result is
 COUNTA - The COUNTA function will examine a set of cells and tell you how many cells are not empty. In this example, Excel analyzed 19 cells and found that only 18 were not empty. COUNTBLANK - The COUNTBLANK
Introduction to Microsoft Excel 2010
 Introduction to Microsoft Excel 2010 This class is designed to cover the following basics: What you can do with Excel Excel Ribbon Moving and selecting cells Formatting cells Adding Worksheets, Rows and
Introduction to Excel
 Introduction to Excel Written by Jon Agnone Center for Social Science Computation & Research 145 Savery Hall University of Washington Seattle WA 98195 U.S.A. (206)543-8110 November 2004 http://julius.csscr.washington.edu/pdf/excel.pdf
Access 2003 Introduction to Report Design
 Access 2003 Introduction to Report Design TABLE OF CONTENTS CREATING A REPORT IN DESIGN VIEW... 3 BUILDING THE REPORT LAYOUT... 5 SETTING THE REPORT WIDTH... 5 DISPLAYING THE FIELD LIST... 5 WORKING WITH
For Microsoft Office XP or Student Workbook. TECHNOeBooks Project-based Computer Curriculum ebooks.
 TECHNOConsultant For Microsoft Office XP or 2003 Student Workbook TECHNOeBooks Project-based Computer Curriculum ebooks www.bepublishing.com Copyright 1993 2010. TechnoKids Inc. in partnership with B.E.
Excel Forecasting Tools Review
 Excel Forecasting Tools Review Duke MBA Computer Preparation Excel Forecasting Tools Review Focus The focus of this assignment is on four Excel 2003 forecasting tools: The Data Table, the Scenario Manager,
Using Microsoft Excel
 Using Microsoft Excel Introduction This handout briefly outlines most of the basic uses and functions of Excel that we will be using in this course. Although Excel may be used for performing statistical
Excel Training - Beginner March 14, 2018
 Excel Training - Beginner March 14, 2018 Working File File was emailed to you this morning, please log in to your email, download and open the file. Once you have the file PLEASE CLOSE YOUR EMAIL. Open
4Functions & Formulas
 The Original Quick Reference Guides Microsoft Excel 2010 Excel is a spreadsheet program that enables you to perform simple or complex calculations using a broad range of statistical and mathematical tools,
12 BASICS OF MS-EXCEL
 12 BASICS OF MS-EXCEL 12.1 INTRODUCTION MS-Excel 2000 is a Windows based application package. It is quite useful in entering, editing, analysis and storing of data. Arithmetic operations with numerical
INTRODUCTION... 1 UNDERSTANDING CELLS... 2 CELL CONTENT... 4
 Introduction to Microsoft Excel 2016 INTRODUCTION... 1 The Excel 2016 Environment... 1 Worksheet Views... 2 UNDERSTANDING CELLS... 2 Select a Cell Range... 3 CELL CONTENT... 4 Enter and Edit Data... 4
CSSCR Excel Intermediate 4/13/06 GH Page 1 of 23 INTERMEDIATE EXCEL
 CSSCR Excel Intermediate 4/13/06 GH Page 1 of 23 INTERMEDIATE EXCEL This document is for those who already know the basics of spreadsheets and have worked with either Excel for Windows or Excel for Macintosh.
Introduction to Microsoft Excel 2016
 Screen Elements: Introduction to Microsoft Excel 2016 The Ribbon The Ribbon is designed to help you quickly find the commands that you need to complete a task. Commands are organized in logical groups,
Excel 2010 Level 1: The Excel Environment
 Excel 2010 Level 1: The Excel Environment Table of Contents The Excel 2010 Environment... 1 The Excel Window... 1 File Tab... 1 The Quick Access Toolbar... 4 Access the Customize the Quick Access Toolbar
Division of School Facilities
 Division of School Facilities Module 3 EXCEL HIDE/ FILTER/ SORT & PRINT New York City Department of Education Office of Enterprise Development and Support Applications Support Group 2011 TABLE of CONTENTS
Excel 2016: Part 2 Functions/Formulas/Charts
 Excel 2016: Part 2 Functions/Formulas/Charts Updated: March 2018 Copy cost: $1.30 Getting Started This class requires a basic understanding of Microsoft Excel skills. Please take our introductory class,
Access Intermediate
 Access 2013 - Intermediate 103-134 Advanced Queries Quick Links Overview Pages AC124 AC125 Selecting Fields Pages AC125 AC128 AC129 AC131 AC238 Sorting Results Pages AC131 AC136 Specifying Criteria Pages