Comprehensive Geostatistical Technology on PC Platform
|
|
|
- Alicia Laurel Murphy
- 5 years ago
- Views:
Transcription
1 Comprehensive Geostatistical Technology on PC Platform C. Stevenson Correlations Company 112 Manzanares St. Socorro, NM Abstract Geostatistics has attracted the attention of many earth scientist and engineers who need better modeling tools for natural gas reservoirs. Two years ago Correlations Company responded to this need through the peer reviewed, DOE Small Business Innovative Research program to develop a fractal algorithm for interpolating between measurements and mapping the consequences. During the two years research period Correlations Company has combined geostatistical modeling with high quality graphics to produce Gviz. This software provides accurate 3D reservoir modeling tools and high quality 3D graphics for PC platforms enabling engineers and geologists to better comprehend reservoirs and consequently improve their decisions. Until recently geostatistical modeling was only available to the limited number of earth scientist familiar with UNIX based platforms. Gviz runs on any PC with Windows 95 or Windows NT operating system. The Gviz pre-processing module reads LAS and ASCII files. The pre-processing module facilitates selection of the stratigraphic units prior to processing by a nearest neighbor, kriging and co-kriging, conditional simulation, or fractal module. A user friendly GUI simplifies the examination of the statistical data and the geostatistical analyses using isotropic and anisotropic variograms. After completing the analyses, the post-processing unit can generate 1D models of well logs, 2D models such as cross-sections, or a 3D model of any petrophysical property. Postprocessing includes the display of reservoir slices, multiple cross-sections, rotation along any axis, and identification of geobodies (visually inspect the effect of porosity cutoffs on connected pore volume). The post-processor includes an up-scaling module to transform a fine scale grid into a reservoir simulation grid which can then be exported in an Eclipse format. Gviz emphasizes a self-explanatory GUI and visually oriented help pages which guides even a novice through the process of generating realistic, two to five million cell, 3D reservoir models. Beta testing of Gviz will finish in April 1997 and a working version of the PC software package, at one fifth of the cost of a comparable UNIX system, will be available to domestic gas and oil producers in mid Acknowledgments Royal Watts was the initial FETC Contracting Officer s Representative during the Phase I and Phase II performance period ( 33 months ending in March 1997). Following Mr. Watts retirement, Mr. William J. Gwilliam has assisted Correlations Company in completing the contract. Research sponsored by the U.S. Department of Energy s Federal Energy Technology Center under contract DE-FG05-94ER81821 with Correlations Company, 112 Manzanares St. Socorro, NM 87801;
2 GViz 1.0 High Performance Geostatistical Mapping & Visualization Package For Windows 95 & Windows NT - 4
3 GViz Unique Features Includes five fast geostatistical algorithms. High quality graphics and user friendly graphical user interface. Import and Export tools for easy flow of data from GViz to other Software. As many as 2 million cells model. Available on a PC with 500 MHz DEC Alpha processor for large models.
4 Correlations Company Provides Full Reservoir Description Services. The Company s Expertise is: Geostatistical modeling using GViz. Software development for Windows 95 and Windows NT 4. Special reservoir description problems: Modeling fractured reservoirs with limited data. Modeling old fields with limited data.
5 Mapping Methods Deterministic/ Nearest Neighbor methods Kriging/Co-Kriging Unconditional/Conditional Simulation Fractal Simulation Map Post Processing Boolean Maps Additive Combination Multiplicative Combination Map Conditioning Jack-Knife/Map Validation

6 Importing LAS Well Log files. Import ASCII files. Selection of stratigraphic markers within GViz.
7 Data File [col] "X(ft)" "Y(ft)" "Z(ft)" "Porosity(%)" [log] "3-1" [log] "8-1" [log] "2-3" Create your Input file in Word Processor, Spreadsheet, Or any ASCII Editor

8 GViz Project Manager Single Integrated Environment Create, Modify and View Maps and Plots Easy to use Graphical User Interface

9

10

11

12

13

14

15

16

17
18 Variogram Features Both Isotropic and Ansiotropic. A wide variety of Models: 1. Spherical 2. Gaussian 3. Exponential 4. Linear 5. fbm: Fractional Brownian Motion Automatic Estimation of Model Parameters Interactive Estimation of Model Parameters


19 Interactive Variogram

20

21

22
23

24

25

26

27

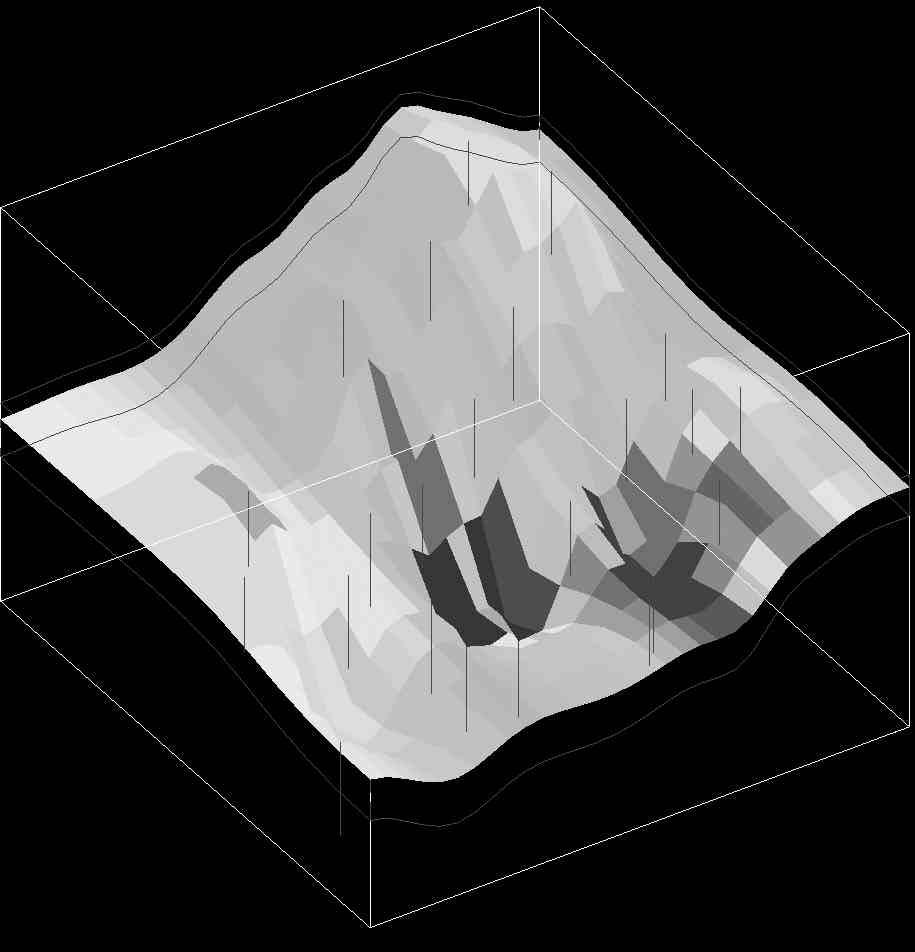
28 Reservoir Continuity (10% Cutoff) Sand Bodies Where Porosity is Higher than 10% Boolean Map
29 Exporting Areal/Vertical Upscaling Export Models to Reservoir Simulations 1. ECLIPSE 2. VIP 3. CMG 4. SABRE 5. ASCII FILES: Row, Column & XYZ. Export Map & Plot to JPEG & BMP format. Export Map & Plot to Microsoft Word and Microsoft PowerPoint for presentation.
30 GViz 1.0 3D Reservoir Modeling on PCs 3D Reservoir Models 2D XY Plane Problems 2D Cross Section Problems 1D Problems
Appropriate algorithm method for Petrophysical properties to construct 3D modeling for Mishrif formation in Amara oil field Jawad K.
 Appropriate algorithm method for Petrophysical properties to construct 3D modeling for Mishrif formation in Amara oil field Jawad K. Radhy AlBahadily Department of geology, college of science, Baghdad
11. Petrophysical Modeling
 11. Petrophysical Modeling 11.1 Deterministic Modeling When the well logs have been scaled up to the resolution of the cells in the 3D grid, the values for each cell along the well trajectory can be interpolated
High Resolution Geomodeling, Ranking and Flow Simulation at SAGD Pad Scale
 High Resolution Geomodeling, Ranking and Flow Simulation at SAGD Pad Scale Chad T. Neufeld, Clayton V. Deutsch, C. Palmgren and T. B. Boyle Increasing computer power and improved reservoir simulation software
Software Tutorial Session Universal Kriging
 Software Tutorial Session Universal Kriging The example session with PG2000 which is described in this and Part 1 is intended as an example run to familiarise the user with the package. This documented
Variogram Inversion and Uncertainty Using Dynamic Data. Simultaneouos Inversion with Variogram Updating
 Variogram Inversion and Uncertainty Using Dynamic Data Z. A. Reza (zreza@ualberta.ca) and C. V. Deutsch (cdeutsch@civil.ualberta.ca) Department of Civil & Environmental Engineering, University of Alberta
2D Geostatistical Modeling and Volume Estimation of an Important Part of Western Onland Oil Field, India.
 and Volume Estimation of an Important Part of Western Onland Oil Field, India Summary Satyajit Mondal*, Liendon Ziete, and B.S.Bisht ( GEOPIC, ONGC) M.A.Z.Mallik (E&D, Directorate, ONGC) Email: mondal_satyajit@ongc.co.in
Petrel TIPS&TRICKS from SCM
 Petrel TIPS&TRICKS from SCM Knowledge Worth Sharing Petrel 2D Grid Algorithms and the Data Types they are Commonly Used With Specific algorithms in Petrel s Make/Edit Surfaces process are more appropriate
Geostatistics 3D GMS 7.0 TUTORIALS. 1 Introduction. 1.1 Contents
 GMS 7.0 TUTORIALS Geostatistics 3D 1 Introduction Three-dimensional geostatistics (interpolation) can be performed in GMS using the 3D Scatter Point module. The module is used to interpolate from sets
Gridding and Contouring in Geochemistry for ArcGIS
 Gridding and Contouring in Geochemistry for ArcGIS The Geochemsitry for ArcGIS extension includes three gridding options: Minimum Curvature Gridding, Kriging and a new Inverse Distance Weighting algorithm.
A Geostatistical and Flow Simulation Study on a Real Training Image
 A Geostatistical and Flow Simulation Study on a Real Training Image Weishan Ren (wren@ualberta.ca) Department of Civil & Environmental Engineering, University of Alberta Abstract A 12 cm by 18 cm slab
Learn the various 3D interpolation methods available in GMS
 v. 10.4 GMS 10.4 Tutorial Learn the various 3D interpolation methods available in GMS Objectives Explore the various 3D interpolation algorithms available in GMS, including IDW and kriging. Visualize the
Geostatistics 2D GMS 7.0 TUTORIALS. 1 Introduction. 1.1 Contents
 GMS 7.0 TUTORIALS 1 Introduction Two-dimensional geostatistics (interpolation) can be performed in GMS using the 2D Scatter Point module. The module is used to interpolate from sets of 2D scatter points
Tools Menu (Frequently Used Features)
") Tools Menu (Frequently Used Features) Exit VoxelCalc Shop for features Show VoxelCalc User Guide (right click on oither icons shows user guide for that function) Region of Interest (ROI) tool with beam
Tools Menu (Frequently Used Features) Exit VoxelCalc Shop for features Show VoxelCalc User Guide (right click on oither icons shows user guide for that function) Region of Interest (ROI) tool with beam
GEO 580 Lab 4 Geostatistical Analysis
 GEO 580 Lab 4 Geostatistical Analysis In this lab, you will move beyond basic spatial analysis (querying, buffering, clipping, joining, etc.) to learn the application of some powerful statistical techniques
Datamine Solutions for Industrial Minerals and Construction Materials, including Dimension Stones.
 Datamine Solutions for Industrial Minerals and Construction Materials, including Dimension Stones. Datamine Overview Global Presence 250 staff in 12 countries Canada, USA, Peru, Chile, Mexico, Brazil,
The Industry Standard in Mapping Solutions. Contouring and 3D Surface Mapping for Scientists and Engineers
 The Industry Standard in Mapping Solutions Only $599! Contouring and 3D Surface Mapping for Scientists and Engineers w w w. g o l d e n s o f t w a r e. c o m The software of choice for creating contour
Permedia Viewers Software
 DATA SHEET Permedia Viewers Software OVERVIEW Petroleum Systems Software KEY FEATURES Co-render and analyze data from multiple packages and across all length scales With exploration and drilling increasingly
Geostatistics on Unstructured Grids: Application to Teapot Dome
 Geostatistics on Unstructured Grids: Application to Teapot Dome John G. Manchuk This work demonstrates some of the developments made in using geostatistical techniques to populate unstructured grids with
Tutorial 3: Constructing a PEBI simulation grid
 Objective The aim of this section is to demonstrate how a PEBI simulation grid can be constructed using the Unstructured Gridder option in ECLIPSE Office. The primary purpose of this tutorial is to familiarize
TPG4160 Reservoir simulation, Building a reservoir model
 TPG4160 Reservoir simulation, Building a reservoir model Per Arne Slotte Week 8 2018 Overview Plan for the lectures The main goal for these lectures is to present the main concepts of reservoir models
Using the PetraSim Pre- and Post-Processor for TETRAD
 Thunderhead Engineering Consultants 1006 Poyntz Avenue Manhattan, KS 66502-5459 USA www.thunderheadeng.com (+1) 785-770-8511 I N C O R P O R A T E D Using the PetraSim Pre- and Post-Processor for TETRAD
Using the CRM Pivot Tables
 Using the CRM Pivot Tables Pivot tables have now been added to your CRM system: we hope that these will provide you with an easy way to produce charts and graphs straight from your CRM, using the most
Trend Modeling Techniques and Guidelines
 Trend Modeling Techniques and Guidelines Jason A. M c Lennan, Oy Leuangthong, and Clayton V. Deutsch Centre for Computational Geostatistics (CCG) Department of Civil and Environmental Engineering University
Geostatistics on Stratigraphic Grid
 Geostatistics on Stratigraphic Grid Antoine Bertoncello 1, Jef Caers 1, Pierre Biver 2 and Guillaume Caumon 3. 1 ERE department / Stanford University, Stanford CA USA; 2 Total CSTJF, Pau France; 3 CRPG-CNRS
Tensor Based Approaches for LVA Field Inference
 Tensor Based Approaches for LVA Field Inference Maksuda Lillah and Jeff Boisvert The importance of locally varying anisotropy (LVA) in model construction can be significant; however, it is often ignored
TOUGH2 Example: Initial State and Production Analyses in a Layered Model
 403 Poyntz Avenue, Suite B Manhattan, KS 66502 USA +1.785.770.8511 www.thunderheadeng.com TOUGH2 Example: Initial State and Production Analyses in a Layered Model PetraSim 5 Table of Contents Acknowledgements...
Geostatistical Reservoir Characterization of McMurray Formation by 2-D Modeling
 Geostatistical Reservoir Characterization of McMurray Formation by 2-D Modeling Weishan Ren, Oy Leuangthong and Clayton V. Deutsch Department of Civil & Environmental Engineering, University of Alberta
TerraStation II v7 Training
 WORKED EXAMPLE Loading and using Core Analysis Data Core Analysis Data is frequently not available at exact well increments. In order to retain the exact depth at which this data is sampled, it needs to
Spatial Interpolation & Geostatistics
 (Z i Z j ) 2 / 2 Spatial Interpolation & Geostatistics Lag Lag Mean Distance between pairs of points 1 Tobler s Law All places are related, but nearby places are related more than distant places Corollary:
APPLICATION OF ARTIFICIAL INTELLIGENCE TO RESERVOIR CHARACTERIZATION: AN INTERDISCIPLINARY APPROACH. (DOE Contract No. DE-AC22-93BC14894) FINAL REPORT
 FINAL REPORT") APPLICATION OF ARTIFICIAL INTELLIGENCE TO RESERVOIR CHARACTERIZATION: AN INTERDISCIPLINARY APPROACH (DOE Contract No. DE-AC22-93BC14894) FINAL REPORT Submitted by The University of Tulsa Tulsa, Oklahoma
APPLICATION OF ARTIFICIAL INTELLIGENCE TO RESERVOIR CHARACTERIZATION: AN INTERDISCIPLINARY APPROACH (DOE Contract No. DE-AC22-93BC14894) FINAL REPORT Submitted by The University of Tulsa Tulsa, Oklahoma
Tutorial 1. Getting Started
 Tutorial 1 Getting Started Table of Contents Objective 2 Step-by-Step Procedure... 2 Section 1 Input Data Preparation and Main Menu Options. 2 Step 1: Create New Project... 2 Step 2: Define Base Grid Size
Spatial Interpolation - Geostatistics 4/3/2018
 Spatial Interpolation - Geostatistics 4/3/201 (Z i Z j ) 2 / 2 Spatial Interpolation & Geostatistics Lag Distance between pairs of points Lag Mean Tobler s Law All places are related, but nearby places
Modeling Uncertainty in the Earth Sciences Jef Caers Stanford University
 Modeling spatial continuity Modeling Uncertainty in the Earth Sciences Jef Caers Stanford University Motivation uncertain uncertain certain or uncertain uncertain Spatial Input parameters Spatial Stochastic
NAME: BEST FIT LINES USING THE NSPIRE
 NAME: BEST FIT LINES USING THE NSPIRE For this portion of the activity, you will be using the same data sets you just completed where you visually estimated the line of best fit..) Load the data sets into
GUIDE TO ISMap. This tutorial is divided into two parts and each one can be run independently. These parts are:
 ISMap Guide Introduction to ISMap... 1 Part 1: Depth Structure Example... 2 Reading the Seismic Data into ISMap... 8 Cross Plots... 15 Variogram Modeling... 18 Kriging the Well Log Data... 23 Cokriging
A Geomodeling workflow used to model a complex carbonate reservoir with limited well control : modeling facies zones like fluid zones.
 A Geomodeling workflow used to model a complex carbonate reservoir with limited well control : modeling facies zones like fluid zones. Thomas Jerome (RPS), Ke Lovan (WesternZagros) and Suzanne Gentile
Downscaling saturations for modeling 4D seismic data
 Downscaling saturations for modeling 4D seismic data Scarlet A. Castro and Jef Caers Stanford Center for Reservoir Forecasting May 2005 Abstract 4D seismic data is used to monitor the movement of fluids
Grid-less Simulation of a Fluvio-Deltaic Environment
 Grid-less Simulation of a Fluvio-Deltaic Environment R. Mohan Srivastava, FSS Canada Consultants, Toronto, Canada MoSrivastava@fssconsultants.ca and Marko Maucec, Halliburton Consulting and Project Management,
AVO for one- and two-fracture set models
 GEOPHYSICS, VOL. 70, NO. 2 (MARCH-APRIL 2005); P. C1 C5, 7 FIGS., 3 TABLES. 10.1190/1.1884825 AVO for one- and two-fracture set models He Chen 1,RaymonL.Brown 2, and John P. Castagna 1 ABSTRACT A theoretical
Oasis montaj Advanced Mapping
 Oasis montaj Advanced Mapping As more information becomes available in digital format, Earth science specialists are recognizing that it is essential to work with a variety of data from different sources.
2016 GeoSoftware Training Catalog
 2016 GeoSoftware Training Catalog Public CGG GeoSoftware Training Programs for 2016 GeoSoftware offers a comprehensive solution for your integrated geophysical, geological, petrophysical, rock physics
ASSIGNMENT 4. (a) First you will construct a visual representation of the data a follows:
 First you will construct a visual representation of the data a follows:") ESE 502 Tony E. Smith ASSIGNMENT 4 This study is designed as an extension of Assignment 3. Hence there is no need to repeat everything you said (or perhaps didn't say!) in that assignment. One strategy
ESE 502 Tony E. Smith ASSIGNMENT 4 This study is designed as an extension of Assignment 3. Hence there is no need to repeat everything you said (or perhaps didn't say!) in that assignment. One strategy
A009 HISTORY MATCHING WITH THE PROBABILITY PERTURBATION METHOD APPLICATION TO A NORTH SEA RESERVOIR
 1 A009 HISTORY MATCHING WITH THE PROBABILITY PERTURBATION METHOD APPLICATION TO A NORTH SEA RESERVOIR B. Todd HOFFMAN and Jef CAERS Stanford University, Petroleum Engineering, Stanford CA 94305-2220 USA
User-defined compaction curves
 User-defined compaction curves Compaction curves define the decrease in porosity of a given lithology with increasing burial depth. In Move, the 2D Kinematic and 3D Kinematic modules use compaction curves
Rubis (NUM) Tutorial #1
 Tutorial #1") Rubis (NUM) Tutorial #1 1. Introduction This example is an introduction to the basic features of Rubis. The exercise is by no means intended to reproduce a realistic scenario. It is assumed that the user
Rubis (NUM) Tutorial #1 1. Introduction This example is an introduction to the basic features of Rubis. The exercise is by no means intended to reproduce a realistic scenario. It is assumed that the user
2018 GeoSoftware Training Catalog
 2018 GeoSoftware Training Catalog Public CGG GeoSoftware Training Programs for 2018 GeoSoftware offers a comprehensive solution for your integrated geophysical, geological, petrophysical, rock physics
2017 GeoSoftware Training Catalog
 2017 GeoSoftware Training Catalog Public CGG GeoSoftware Training Programs for 2017 GeoSoftware offers a comprehensive solution for your integrated geophysical, geological, petrophysical, rock physics
Product information. Hi-Tech Electronics Pte Ltd
 Product information Introduction TEMA Motion is the world leading software for advanced motion analysis. Starting with digital image sequences the operator uses TEMA Motion to track objects in images,
Creating 3D Models of Lithologic/Soil Zones using 3D Grids
 65 Creating 3D Models of Lithologic/Soil Zones using 3D Grids By Skip Pack Dynamic Graphics, Inc 1015 Atlantic Avenue Alameda, CA 94501 Telephone: (510) 522-0700, ext 3118 Fax: (510) 522-5670 e-mail: skip@dgicom
B002 DeliveryMassager - Propagating Seismic Inversion Information into Reservoir Flow Models
 B2 DeliveryMassager - Propagating Seismic Inversion Information into Reservoir Flow Models J. Gunning* (CSIRO Petroleum) & M.E. Glinsky (BHP Billiton Petroleum) SUMMARY We present a new open-source program
A workflow to account for uncertainty in well-log data in 3D geostatistical reservoir modeling
 A workflow to account for uncertainty in well-log data in 3D geostatistical reservoir Jose Akamine and Jef Caers May, 2007 Stanford Center for Reservoir Forecasting Abstract Traditionally well log data
Indicator Simulation for Categorical Variables
 Reservoir Modeling with GSLIB Indicator Simulation for Categorical Variables Sequential Simulation: the Concept Steps in Sequential Simulation SISIM Program Sequential Simulation: the Concept 2 1 3 1.
403 Poyntz Avenue, Suite B Manhattan, KS PetraSim Example Manual
 403 Poyntz Avenue, Suite B Manhattan, KS 66502-6081 1.785.770.8511 www.thunderheadeng.com PetraSim Example Manual July 2007 TMVOC Example Guide Table of Contents 1.... 1 Description... 1 Specify the Simulator
We G Updating the Reservoir Model Using Engineeringconsistent
 We G102 09 Updating the Reservoir Model Using Engineeringconsistent 4D Seismic Inversion S. Tian* (Heriot-Watt University), C. MacBeth (Heriot-Watt University) & A. Shams (Heriot-Watt University) SUMMARY
Thermal Reservoir Simulator for Microsoft Windows TM
 Thermal Reservoir Simulator for Microsoft Windows TM Designed for use with the Microsoft Windows XP TM, and later, operating systems: Simulator Features Simulator Applications Radial and Cartesian Coordinates
SPE Copyright 1999, Society of Petroleum Engineers Inc.
 SPE 56654 Methodology for Variogram Interpretation and Modeling for Improved Reservoir Characterization E. Gringarten, SPE, Landmark Graphics Corp., and C. V. Deutsch, SPE, University of Alberta Copyright
Fractals: a way to represent natural objects
 Fractals: a way to represent natural objects In spatial information systems there are two kinds of entity to model: natural earth features like terrain and coastlines; human-made objects like buildings
3D MULTIDISCIPLINARY INTEGRATED GEOMECHANICAL FRACTURE SIMULATOR & COMPLETION OPTIMIZATION TOOL
 PETROPHYSICS RESERVOIR GEOMECHANICS COMPLETIONS DRILLING PRODUCTION SERVICE 3D MULTIDISCIPLINARY INTEGRATED GEOMECHANICAL FRACTURE SIMULATOR & COMPLETION OPTIMIZATION TOOL INTEGRATED GEOMECHANICAL FRACTURE
Tutorial 7. Water Table and Bedrock Surface
 Tutorial 7 Water Table and Bedrock Surface Table of Contents Objective. 1 Step-by-Step Procedure... 2 Section 1 Data Input. 2 Step 1: Open Adaptive Groundwater Input (.agw) File. 2 Step 2: Assign Material
Technique to Integrate Production and Static Data in a Self-Consistent Way Jorge L. Landa, SPE, Chevron Petroleum Technology Co.
 SPE 71597 Technique to Integrate Production and Static Data in a Self-Consistent Way Jorge L. Landa, SPE, Chevron Petroleum Technology Co. Copyright 2001, Society of Petroleum Engineers Inc. This paper
Variogram Tutorial 2d 3d Data Modeling And Analysis
 We have made it easy for you to find a PDF Ebooks without any digging. And by having access to our ebooks online or by storing it on your computer, you have convenient answers with variogram tutorial 2d
Exercise 3-1: Soil property mapping
 Exercise 3-1: Soil property mapping Mapping objectives: Create a soil analysis point layer from tabular data in QGIS Create a continuous surface soil property map using Kriging Interpolation in SAGA GIS
3DS Learning Solutions GEOVIA Surpac. GEOVIA Surpac Course Catalog North America
 GEOVIA Surpac Course Catalog North America 1 ABOUT OUR TRAINING COURSES Dassault Systèmes offers a wide range of GEOVIA training courses designed to suit all levels of mining professionals, from Geologists
Data analysis with ParaView CSMP Workshop 2009 Gillian Gruen
 Data analysis with ParaView 3.4.0 CSMP Workshop 2009 Gillian Gruen How to...... display a data set ( Contour, Glyph, Clip, Slice) be efficient in displaying similar data sets ( work with Lookmarks )...
Tutorial 1: Standard usage
 Introduction This tutorial details the following steps: importing an existing data set, editing the data, saving the project, running and monitoring simulation, viewing results vectors, and creating reports.
Summary of New DARWIN TM Capabilities for Surface Damage Tolerance Assessment and Related Enhancements
 Summary of New DARWIN TM Capabilities for Surface Damage Tolerance Assessment and Related Enhancements Mike Enright, Luc Huyse, Yi-Der Lee, Graham Chell, Craig McClung, Gerald Leverant Southwest Research
Business Intelligence and Reporting Tools
 Business Intelligence and Reporting Tools Release 1.0 Requirements Document Version 1.0 November 8, 2004 Contents Eclipse Business Intelligence and Reporting Tools Project Requirements...2 Project Overview...2
AEMLog Users Guide. Version 1.01
 AEMLog Users Guide Version 1.01 INTRODUCTION...2 DOCUMENTATION...2 INSTALLING AEMLOG...4 AEMLOG QUICK REFERENCE...5 THE MAIN GRAPH SCREEN...5 MENU COMMANDS...6 File Menu...6 Graph Menu...7 Analysis Menu...8
COMPONENTS. The web interface includes user administration tools, which allow companies to efficiently distribute data to internal or external users.
 COMPONENTS LASERDATA LIS is a software suite for LiDAR data (TLS / MLS / ALS) management and analysis. The software is built on top of a GIS and supports both point and raster data. The following software
AEMLog users guide V User Guide - Advanced Engine Management 2205 West 126 th st Hawthorne CA,
 AEMLog users guide V 1.00 User Guide - Advanced Engine Management 2205 West 126 th st Hawthorne CA, 90250 310-484-2322 INTRODUCTION...2 DOCUMENTATION...2 INSTALLING AEMLOG...4 TRANSFERRING DATA TO AND
TMVOC Buckley-Leverett Flow
 403 Poyntz Avenue, Suite B Manhattan, KS 66502 USA +1.785.770.8511 www.thunderheadeng.com TMVOC Buckley-Leverett Flow PetraSim 2016.1 Table of Contents 1. Buckley-Leverett Flow...1 Description... 1 Create
JMAG-Designer Next Generation Electromagnetic Simulation Pre/Post System
 JMAG-Designer Next Generation Electromagnetic Simulation Pre/Post System Draft Engineering Technology Division JRI Solutions, Ltd. 1 Contents Introduction Transition from JMAG-Designer to JMAG Concept
Software that Works the Way Petrophysicists Do
 Software that Works the Way Petrophysicists Do Collaborative, Efficient, Flexible, Analytical Finding pay is perhaps the most exciting moment for a petrophysicist. After lots of hard work gathering, loading,
GO! with Microsoft PowerPoint 2016 Comprehensive
 GO! with Microsoft PowerPoint 2016 Comprehensive First Edition Chapter 3 Enhancing a Presentation with Animation, Video, Tables, and Charts Learning Objectives Customize Slide Backgrounds and Themes Animate
Facies Modeling Using a Markov Mesh Model Specification
 Math Geosci (2011) 43:611 624 DOI 10.1007/s11004-011-9350-9 Facies Modeling Using a Markov Mesh Model Specification Marita Stien Odd Kolbjørnsen Received: 28 April 2010 / Accepted: 13 February 2011 / Published
Spatial Interpolation & Geostatistics
 (Z i Z j ) 2 / 2 Spatial Interpolation & Geostatistics Lag Lag Mean Distance between pairs of points 11/3/2016 GEO327G/386G, UT Austin 1 Tobler s Law All places are related, but nearby places are related
Revolve 3D geometry to display a 360-degree image.
 Tutorial 24. Turbo Postprocessing Introduction This tutorial demonstrates the turbomachinery postprocessing capabilities of FLUENT. In this example, you will read the case and data files (without doing
ISMap and Emerge. In this document, we will combine the EMERGE multi-attribute transform algorithm with the geostatistical algorithms in ISMap.
 ISMap and Emerge In this document, we will combine the EMERGE multi-attribute transform algorithm with the geostatistical algorithms in ISMap. Before doing so, we will briefly review the theory of the
Visualization Of A Deterministic Radiation Transport Model Using Standard Visualization Tools
 Visualization Of A Deterministic Radiation Transport Model Using Standard Visualization Tools James A. Galbraith and L. Eric Greenwade, Idaho National Engineering and Environmental Laboratory ABSTRACT:
CREWES computer systems
 CREWES computer systems CREWES computer systems Rolf Maier, Kevin Hall and Henry Bland ABSTRACT Much of the research performed at CREWES is centred on numerical geophysics. Computers and the software packages
MODFLOW Interpolating Layer Data
 GMS TUTORIALS MODFLOW For sites with complex stratigraphy and three-dimensional flow, a multi-layer MODFLOW model can be much more accurate than a one layer, two-dimensional model. When creating multi-layer
Discover the Depths of Your Data!
 www.goldensoftware.cz Discover the Depths of Your Data! Golden Software Presents Powerful and Innovative Well Log and Borehole Plotting for Geoscientists Golden Software, Inc. From the developers of Surfer
The 3 Voxet axes can be annotated: Menu > Voxet > Tools > Annotate Voxet > Custom system.
 Annotate Voxet The 3 Voxet axes can be annotated: Menu > Voxet > Tools > Annotate Voxet > Custom system. You can then enter the start and end coordinate values as well as custom labels. The annotation
Reservoir Modeling Combining Geostatistics with Markov Chain Monte Carlo Inversion
 Reservoir Modeling Combining Geostatistics with Markov Chain Monte Carlo Inversion Andrea Zunino, Katrine Lange, Yulia Melnikova, Thomas Mejer Hansen and Klaus Mosegaard 1 Introduction Reservoir modeling
Statistics on Structures 3.1
 New features exploring new fields of application Christian Bucher, Claudia Bucher, Christopher Riemel, Sebastian Wolff* DYNARDO Austria GmbH WOST 2014, 6./7.11.2014, Weimar optislang & SoS: What is the
Short Note: Some Implementation Aspects of Multiple-Point Simulation
 Short Note: Some Implementation Aspects of Multiple-Point Simulation Steven Lyster 1, Clayton V. Deutsch 1, and Julián M. Ortiz 2 1 Department of Civil & Environmental Engineering University of Alberta
Prerequisites: This tutorial assumes that you are familiar with the menu structure in FLUENT, and that you have solved Tutorial 1.
 Tutorial 22. Postprocessing Introduction: In this tutorial, the postprocessing capabilities of FLUENT are demonstrated for a 3D laminar flow involving conjugate heat transfer. The flow is over a rectangular
A Lattice-Boltzmann Based Method Applied to Digital Rock Characterization of Perforation Tunnel Damage
 SCA2016-058 1/6 A Lattice-Boltzmann Based Method Applied to Digital Rock Characterization of Perforation Tunnel Damage Bernd Crouse, David M Freed, Nils Koliha, Gana Balasubramanian EXA CORP Rajani Satti,
Getting Started. What is SAS/SPECTRAVIEW Software? CHAPTER 1
 3 CHAPTER 1 Getting Started What is SAS/SPECTRAVIEW Software? 3 Using SAS/SPECTRAVIEW Software 5 Data Set Requirements 5 How the Software Displays Data 6 Spatial Data 6 Non-Spatial Data 7 Summary of Software
Ground LiDAR fuel measurements of the Prescribed Fire Combustion and Atmospheric Dynamics Research Experiment
 Ground LiDAR fuel measurements of the Prescribed Fire Combustion and Atmospheric Dynamics Research Experiment Eric Rowell, Erik Apland and Carl Seielstad IAWF 4 th Fire Behavior and Fuels Conference, Raleigh,
New Features in SGeMS
 Annual Meeting 2010 Stanford Center for Reservoir Forecasting New Features in SGeMS Rahul Gupta Computer Sciences, Stanford University Alexandre Boucher EESS, Stanford University Outline Introduction to
Direct Sequential Co-simulation with Joint Probability Distributions
 Math Geosci (2010) 42: 269 292 DOI 10.1007/s11004-010-9265-x Direct Sequential Co-simulation with Joint Probability Distributions Ana Horta Amílcar Soares Received: 13 May 2009 / Accepted: 3 January 2010
Tutorial 3. Correlated Random Hydraulic Conductivity Field
 Tutorial 3 Correlated Random Hydraulic Conductivity Field Table of Contents Objective. 1 Step-by-Step Procedure... 2 Section 1 Generation of Correlated Random Hydraulic Conductivity Field 2 Step 1: Open
Fig. 1.1: Petrel Workflow Tools
 1. Introduction In this project, a 3D geological (static) model of a sample petroleum reservoir will be built. All steps will be shown in detail with screen shots of the necessary figures. The software
GMS 8.0 Tutorial MODFLOW Interpolating Layer Data Interpolating MODFLOW elevations and other data from discrete points
 v. 8.0 GMS 8.0 Tutorial Interpolating MODFLOW elevations and other data from discrete points Objectives Learn how to effectively use GMS tools to interpolate MODFLOW layer elevation data and other MODFLOW
Rotation and affinity invariance in multiple-point geostatistics
 Rotation and ainity invariance in multiple-point geostatistics Tuanfeng Zhang December, 2001 Abstract Multiple-point stochastic simulation of facies spatial distribution requires a training image depicting
Kriging Great Lakes Sediment Contamination Values Cookbook for ArcGIS 10.x
 Kriging Great Lakes Sediment Contamination Values Cookbook for ArcGIS 10.x By Michael Dennis, K. Wayne Forsythe, Cameron Hare, and Adrian Gawedzki 2004-2012 To reference this document: Dennis, M., K.W.
Grade 8 Mathematics Item Specification C1 TC
 Task Model 1 Graphing DOK Level 1, interpreting the unit rate as the slope of the graph. Compare two different example, compare a distance-time graph to a distance-time two moving objects has greater speed.
DI TRANSFORM. The regressive analyses. identify relationships
 July 2, 2015 DI TRANSFORM MVstats TM Algorithm Overview Summary The DI Transform Multivariate Statistics (MVstats TM ) package includes five algorithm options that operate on most types of geologic, geophysical,
Lab Activity #2- Statistics and Graphing
 Lab Activity #2- Statistics and Graphing Graphical Representation of Data and the Use of Google Sheets : Scientists answer posed questions by performing experiments which provide information about a given