QGIS for Geoscientists
|
|
|
- Bertha Williams
- 5 years ago
- Views:
Transcription

1 QGIS for Geoscientists Robin Armit, Tom Carmichael, Lachlan Grose Monash Structural Geophysics group 22 nd 26th February 2016
2 GIS A geographic information system (GIS) is a system designed to capture, store, manipulate, analyze, manage, and present all types of spatial data. From tracking diseases to vectors to mineralisation. 2
3 GIS GIS 3-4D modelling External data analysis 3

4 GIS QGIS is a open source, GIS package that can is freely available for Windows, Mac, Linux, BSD and Android. As with ArcGIS, it allows you to capture, store, manipulate, manage, conduct analyses and visualise a wide array of Geographical data. QGIS Download for Windows (2.8) QGIS Download for Mac OS X (2.8) QGIS Download for Linux (2.8)

5 GIS QGIS has an active support community which have answers to a wide array of questions. QGIS Support for users QGIS Documentation QGIS Stackexchange Forum QGIS Known issues and bug tracking A QGIS FAQ for how to ask a QGIS question and increase your chances of getting a response! Practical 1


6 Modern Light Table 6
7 The interface 7

8 A quick note on coordinate systems The co-ordinate system you choose for a map (or an individual point) defines where it appears in your GIS project. Older maps often have different datum to what is the current norm. Australia has moved approximately 18 centimeters since the calculation of GDA 94, always keep this in mind and check your measurements and coordinate system! Lake Cethana - Tasmania Point in GDA 94/WGS 84 space Point in AGD 66/AGD 84 co-ordinate system


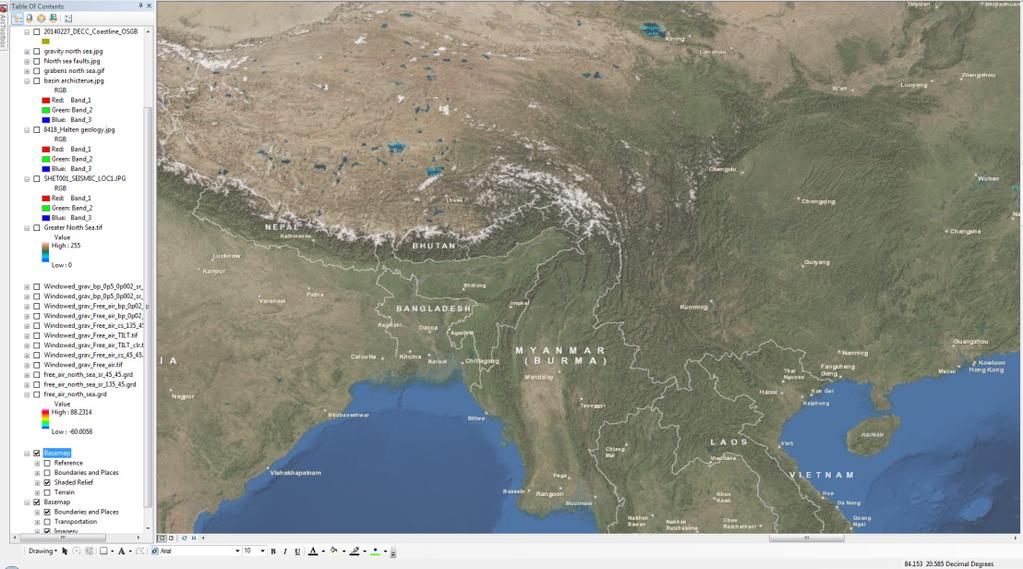
9 Setting the coordinate system in QGIS There are two common ways to set the coordinate system in QGIS, either select the CRS (Coordinate reference system) tab. Or, if you re importing grids which have already been correctly referenced, right click on them in the layers bar and select set project CRS from Layer.


 AMG84 ANS70 AGD84 UTM (local using zones) MGA94 GRS80 AFN")
10 More on coordinate systems You must make a choice of Datum and coordinate system for your project. Normally depends on scale and location of project. Making an error here can put your 100 of metres out to half the globe. Below is a brief summary of the Australian map grid systems. Spheroid Datum Projection WGS84 WGS84 World UTM (world) AMG66 ANS70 AGD66 UTM (local using zones) AMG84 ANS70 AGD84 UTM (local using zones) MGA94 GRS80 AFN / GDA94 UTM (local using zones)

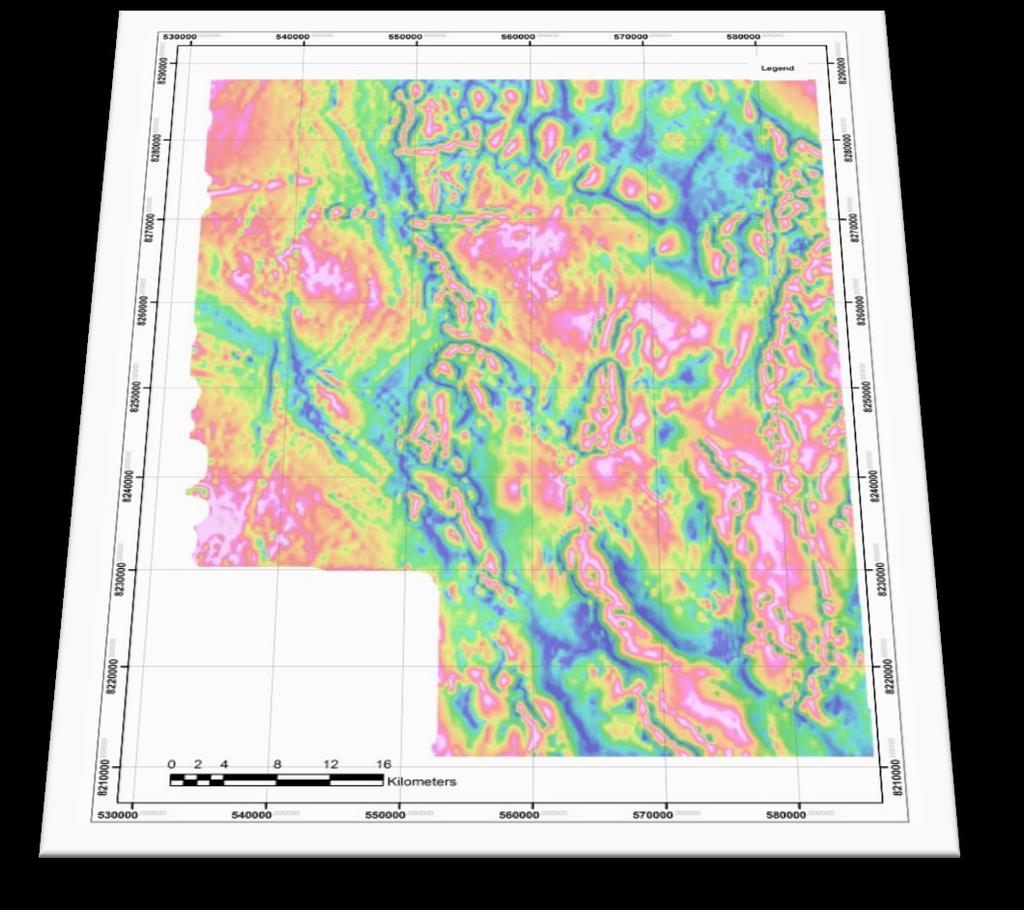
11 Georeferencing an image To georeference an image is to define where it sits in a particular space (or this case, a defined datum). This is crucial for importing Raster images into your project and using them for interpretation and analyses of an area. The British library has georeferenced 1000s of maps from its archive so that they can be viewed in Google Maps as overlays to compare with modern maps. This is an image first created in 1857 for the British Hydrographic survey.
 From the Settings menu, choose Transformation Settings.")
12 Georeferencing an image 1. Choose the Georeferencer tool from the Raster menu. Select Open Raster from the File menu. Input the correct Coordinate system (AGD 66/AMG zone 54) From the Settings menu, choose Transformation Settings. Add Control Points by making sure that Add Point is highlighted then select a point on the map where the coordinates are known. Input the required easting and northing. Repeat this step at least 3 times. Choose the transformation type: Linear, Resampling Method: Linear. Change the Target SRS to a more modern projection (WGS 84/Zone 54S). Give the file an appropriate title and location. Select Start Georeferencing.
 From the Settings menu, choose Transformation Settings.")

13 Georeferencing an image Choose the Georeferencer tool from the Raster menu. 2. Select Open Raster from the File menu. 3. Input the correct Coordinate system (AGD 66/AMG zone 54) From the Settings menu, choose Transformation Settings. Add Control Points by making sure that Add Point is highlighted then select a point on the map where the coordinates are known. Input the required easting and northing. Repeat this step at least 3 times. Choose the transformation type: Linear, Resampling Method: Linear. Change the Target SRS to a more modern projection (WGS 84/Zone 54S). Give the file an appropriate title and location. Select Start Georeferencing.


14 Georeferencing an image Choose the Georeferencer tool from the Raster menu. Select Open Raster from the File menu. Input the correct Coordinate system (AGD 66/AMG zone 54) 4. Add Control Points by making sure that Add Point is highlighted then select a point on the map where the coordinates are known. Input the required easting and northing. 5. Repeat this step at least 3 times.

.")
15 Georeferencing an image 6. From the Settings menu, choose Transformation Settings. 7. Choose the transformation type: Linear, Resampling Method: Linear. Change the Target SRS to a more modern projection (WGS 84/Zone 54S). Give the file an appropriate title and location. 8. Select Start Georeferencing.


16 Basemaps Setting the coordinate system in QGIS 16


17 Loading a layer (Raster or Vector) The majority of your GIS projects will be defined by layers made up of either Rasters or Vectors. A Raster is a spatial dataset that defines space as an array of equal sized cells arranged into rows and columns (e.g. Satellite imagery or referenced geological maps) A Vector dataset is one that is represented as geographic features, such as points, lines and polygons. Each layer type has its own drawbacks and advantages and are used to describe different data.

18 Loading a layer (Raster or Vector) Loading an existing layer is done through the Layer menu, either by choosing Add Raster Layer or Add Vector Layer depending the dataset you re importing. There are a range of other options depending on what data types you have available, but Vector and Raster are the most common.

19 Creating a new layer (Creating Points, Polylines and Polygons) To better interpret your data and to get a more detailed understanding, the creation of a set of different datasets is required. On the Ararat 50K mapsheet, there are many different features that can be observered, in its current state the image is a Raster but turning sections of it into a Vector can provide more insight. There are features on this map that can be turned into points, lines or polygons.

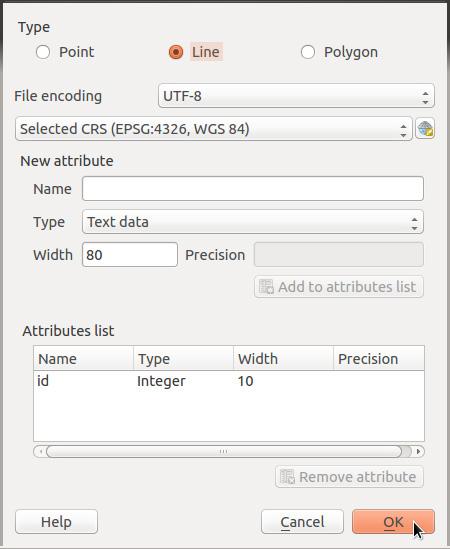
20 Creating a new layer (Creating Points, Polylines and Polygons) 1. From the Layer menu, select New Shapefile Layer. From the New Vector Layer window, choose Point. Choose the correct CRS. Give the new layer at least one Attribute. Save the Layer in a reasonable location.

21 Creating a new layer (Creating Points, Polylines and Polygons) From the Layer menu, select New Shapefile Layer. 2. From the New Vector Layer window, choose Point. 3. Choose the correct CRS. 4. Give the new layer at least one Attribute. 5. Save the Layer in a reasonable location.
22 Adding to a layer (Point) 1. Make sure that the Digitizing toolbar is selected. 2. The correct Layer needs to be highlighted (Points) From the Digitizing ribbon, select the Toggle Edits cursor. Select the Add Feature button. Select a point of interest, give it the Attributes that you previously assigned. Click Save Edits once you ve completed adding points.
 3.")

23 Adding to a layer (Point) Make sure that the Digitizing toolbar is selected. The correct Layer needs to be highlighted (Points) 3. From the Digitizing ribbon, select the Toggle Edits cursor. 4. Select the Add Feature button. 5. Select a point of interest, give it the Attributes that you previously assigned. 6. Click Save Edits once you re done.

24 Polylines Digitizing polylines is done in the same way that the creation of points, except that the end result is defined by a line, instead of a single point. The can be used to represent a large amount of geological data that is defined as linear. It is extremely important to use the style tool to make sure that you can visualise what each of your line represents. This will be covered later in this course.


25 Polygons Layers that are created as Polygons are initially added in the same way that polylines and points are. Polygons are used to define enclosed 2D areas. It is defined by a set of (x,y) co-ordinate pairs.


26 Polygons Create an initial polygon by selecting four points on the map, the program will join these four points with straight lines. By using the Snapping Options from the Settings menu and choosing the tolerance as around 20 pixels, you can snap to a node from your polygon when you are close to it.


27 Polygons By adding extra nodes to a line, by double clicking on the edge of a polygon with the Node Tool selected. With the Node tool still selected, each of these individual nodes can be manoeuvred to better represent the underlying geology. By doing this over the entire area you can create a polygon that is representative of this geology

 into something more workable.")
28 Importing Tables The data you initially collect in the field will unlikely be in a format that you can directly import into a GIS package. The easiest way to solve this is to convert a table (usually a.csv file) into something more workable. Using GIS it is possible to turn field data, into manipulable, useful, information


29 Importing a table 2. Select your text delimited file and fill in the data required. 1. Choose Delimited Text Layer from the Layer menu.
30 A quick word on tables It is vital that before you go out into the field, that you know what data you re going to collect and how your input table should be set up. What information do you need to record at each location? Do you have a comments section to record pertinent information? What coordinate system is my GPS in? Was my data input into my table correctly? (Have I qaqc d my data?) Are all my measurements in Strike and dip or dip and dip direction? Do my numbers make sense? Did I record them all in the same way? All of these questions (and more!) need to be dealt with before you try to import your data. Otherwise, any errors that you bring in will be involved in your interpretation.
31 Todays task Familiarisation with GIS Download and install QGIS Setup the plugins Import existing data stylise the data Draw onto your map Export as a PDF or Image file
32 Setting up the files Download KANMANTOO PRAC.ZIP Create the following directories GFG Day1 images shapefiles Unzip the files inside the kanmantoo into the images folder The otherfiles into the "shapefiles" folder Move all the map_extent files from images to shapefiles
33 Plugins Way to add extra features to the program QGIS plugin repository has about 500 plugins Or you could write your own For this course we need: Openlayers Autotrace Clipper Contour Generalizer Qgis2threejs

34 The plugin manager

35 Adding existing data
36 Organising your project Select all the images and right click group Select all shape files "map extent, geology of Kannmantoo, Cambrian geology of Kanmantoo" and group You can name these groups as you want

37 Stylising your shapefiles Find out the properties each shapefile has: Right click and open attribute table Work out the best one to colour them by... eg lith group Right click shapefile and open properties then click the style tab Column == the attribute to colour them by Select categorised Press classify

38 Creating a shapefile
39 Naming and saving your files Use a descriptive name not "shapefile" Try to avoid spaces Try to save them in the one place You can save multiple lines (form lines, faults etc) in the one shapefile no need for a shape file for each fault type!

40 Now setup the attributes Think about how you will classify a line e.g. type, age etc. Open up the attribute table and click the pen to make the shapefile editable. Add new column - select the appropriate type e.g. integer, double or text pay attention to the length and precision you need
41 Adding a feature Add a normal fault Add feature draw a line (doesn't need to be a fault) Add the relevent attributes SAVE
42 Stylising the fault line Open the shapefile properties and classify by your relevant column Double click the symbol for your "normal fault" Add another line Change to a marker line Change marker to an esri font that looks like a normal fault symbol Change offset so marker sits on the line

43 Try and make a sinistral and dextral symbol
44 You should be able to Import raster and vector files Stylise your vector files Create your own shapefile and assign attributes to draw structures Create a polygon shapefile for lithologies Now we will export a map

45 Additional toolbars Advanced editing and digitising - clipping, merging, tracing


46 Advanced editing and digitising - clipping, merging, tracing


47 Using the clipping tool Make two polygons share a border Select the polygon(s) you want to keep Vector clipper Shape to keep
48 Autotrace Alternative to using the clipping tool The AutoTrace plugin for QGIS allows for new polygons to be digitized based on the vertices of pre-existing features. To use the AutoTrace feature, the snapping options will need to be set that it is simple to clip a vertex. To use the AutoTrace tool, first Toggle Editing of a layer, then select the AutoTrace tool. When snapped to a new vertex, trace along features with the shift key Trace the longest distance around a polygon (between two vertices) with the ctrl+shift keys together. AutoTrace (Editing enabled)
49 Freehand drawing
50 Generaliser Select your shapefile that has the lines Open up generaliser

51 Print composer The print composer is a powerful way of exporting your map with grids, axis, labels etc.

52 Once it is open add your map
53 To change the settings of the map layout You can resize by dragging the corners View -- panels : make sure item properties is checked
54 To add grid lines Item properties grid and add a new grid.
55 To add labels
56 Adding an overview Add another map that is your "zoomed in" area Go to the main qgis window and select the area you want to zoom in on Go to your new map and set map canvas extent
57 Adding an overview box on the larger map Now select the original map

58 Changing the style of the overview outline
59 What's missing? Try adding a north arrow Scale bar Legend Export to a pdf/png/svg


60 Custom forms Select type you have used before Can increment with arrows Choose lithos from your lithology shapefile

61 Custom form for adding feature

62 Custom form for adding feature Create a category as a tab main Select main and transfer the attributes you want across using the > button

63 Changing the input of attributes Unique values editable gives you a drop down menu and you can add new fields.. Prevents typos Range for numerical data e.g. strike dip 0-90 Value relation to get attributes from another shapefile
 based on its attributes.")

64 Using data attributes One of the most powerful aspects of a GIS package is the ability to highlight aspects of a data set (be it a pointset, polygon or polyline) based on its attributes. Using data attributes can be used to represent properties about a data point too, such as rotation of a symbol to represent strike and dip. It is also possible to save data that has certain attributes as a new dataset by using a query to interrogate the data.


65 Assigning values to data based on a characteristic. Select Style from the sidebar and Categorized from the drop down menu. Select properties from the drop down menu of a layer (alternatively, double click)


66 Assigning values to data based on a characteristic. Choose a column to categorize by, then hit classify. By changing the symbol and colour ramp, you can create a map which is relevant to your data.

67 Strike and Dip Example of directional markers By choosing a rotation field in the Style menu of the Layer Properties menu, it is possible to rotate a symbol by a certain column. If you have dip direction as a column, you can rotate a symbol by this value. You can also scale the size of an observation by a column too. In QGIS you can create your own symbols, or download them.

68 Query Builder Open the General tab from the Layer Properties menu. Select Query Builder.
 you get the values that are present in that field.")
69 Query Builder There are several important features of the query builder which can make your life infinitely easier. If you select an option from the Fields sub-menu and then hit sample (or all) you get the values that are present in that field. By using the Operators we can build a query which will highlight certain things. If we re working with text then its easiest to choose a value from the Values because it needs to be exact. The IF and AND functions can help highlight areas which have more then one characteristic that we re interested in.
 and are Intrusives.")
70 Query Builder By creating this query we can highlight only the features which are Silurian(Ludlow) and are Intrusives.
71 Query Builder By using Save As after right clicking on the layer that you ve built a query of will allow you to save a Shape File which only has the characteristics that you ve saved. There are more complicated Querys you can build, with more detailed explanations of each of the query functions in the QGIS wiki.
ArcGIS for Geoscientists
 School of Geosciences ArcGIS for Geoscientists R. Armit & T. Carmichael GIS A geographic information system (GIS) is a system designed to capture, store, manipulate, analyze, manage, and present all types
Geological mapping using open
 Geological mapping using open source QGIS MOHSEN ALSHAGHDARI -2017- Abstract Geological mapping is very important to display your field work in a map for geologist and others, many geologists face problems
A Practical Guide to Using QGIS
 A Practical Guide to Using QGIS 1.1 INTRODUCTION Quantum GIS (QGIS) is a useful mapping software that enables the compilation and displaying of spatial data in the form of a map. Gaining experience in
Orchard Link Mapping Workshop (QGIS Training) Contact
 Contact") Orchard Link Mapping Workshop (QGIS Training) Contact email: info@neetmaps.co.uk for technical support, bespoke mapping or further information or visit www.neetmaps.co.uk 1 2 1: Introduction to QGIS What
Orchard Link Mapping Workshop (QGIS Training) Contact email: info@neetmaps.co.uk for technical support, bespoke mapping or further information or visit www.neetmaps.co.uk 1 2 1: Introduction to QGIS What
Introduction to using QGIS for Archaeology and History Workshop by the Empirical Reasoning Center
 Introduction to using QGIS for Archaeology and History Workshop by the Empirical Reasoning Center In this workshop, we will cover the basics of working with spatial data, as well as its main uses for archaeology.
Geographical Information Systems Institute. Center for Geographic Analysis, Harvard University. LAB EXERCISE 1: Basic Mapping in ArcMap
 Harvard University Introduction to ArcMap Geographical Information Systems Institute Center for Geographic Analysis, Harvard University LAB EXERCISE 1: Basic Mapping in ArcMap Individual files (lab instructions,
CHAPTER 2 GEOREFERENCING AND SHAPEFILE CREATION
 CHAPTER 2 GEOREFERENCING AND SHAPEFILE CREATION Georeferencing is the process of assigning real-world coordinates to each pixel of the raster. These coordinates are obtained by doing field surveys - collecting
OS OpenData masterclass 2013 Cartographic Design workshop
 OS OpenData masterclass 2013 Cartographic Design workshop 1 Quantum GIS Quantum GIS (QGIS) is a user-friendly Open Source Geographic Information System (GIS,) licensed under the GNU General Public License.
All data is in Universal Transverse Mercator (UTM) Zone 6 projection, and WGS 84 datum.
 Zone 6 projection, and WGS 84 datum.") 111 Mulford Hall, College of Natural Resources, UC Berkeley (510) 643-4539 EXPLORING MOOREA DATA WITH QUANTUM GIS In this exercise, you will be using an open-source FREE GIS software, called Quantum GIS,
111 Mulford Hall, College of Natural Resources, UC Berkeley (510) 643-4539 EXPLORING MOOREA DATA WITH QUANTUM GIS In this exercise, you will be using an open-source FREE GIS software, called Quantum GIS,
Geographic Information Systems. using QGIS
 Geographic Information Systems using QGIS 1 - INTRODUCTION Generalities A GIS (Geographic Information System) consists of: -Computer hardware -Computer software - Digital Data Generalities GIS softwares
Quick Guide to MapWindow GIS Desktop Application
 Quick Guide to MapWindow 1 Quick Guide to MapWindow GIS Desktop Application Version 2 January 2007 Adapted by Tom Croft. This is a summary user guide for commonly used tools and capabilities and does not
Tutorial 1: Finding and Displaying Spatial Data Using ArcGIS
 Tutorial 1: Finding and Displaying Spatial Data Using ArcGIS This tutorial will introduce you to the following: Websites where you may browse to find geospatial information Identifying spatial data, usable
USING CCCR S AERIAL PHOTOGRAPHY IN YOUR OWN GIS
 USING CCCR S AERIAL PHOTOGRAPHY IN YOUR OWN GIS Background: In 2006, the Centre for Catchment and Coastal Research purchased 40 cm resolution aerial photography for the whole of Wales. This product was
Exercise 1-1: Using GPS track data to create a field boundary
 Exercise 1-1: Using GPS track data to create a field boundary Learning objectives: Add QGIS plugins Create a point vector file from a text file Convert GPS tracking points to a field boundary Data folder:
Digitising a map in arcgis desktop 10.3
 Digitising a map in arcgis desktop 10.3 1 CONTENTS 2 Evaluating your map... 2 3 Setting up the base map... 3 4 Georeferencing your map/maps... 3 4.1 Georeferencing tips.... 4 5 Digitising your maps...
EDINA Workshop: Creating a Campus Map and Displaying it in OpenLayers
 Contents Introduction... 2 What steps are involved?... 3 Before you start... 4 Create your campus map... 5 1. Load the basemap data into ArcMap... 5 2. Set up Symbology and Labels of Layers... 6 Improve
Importing GPS points and Hyperlinking images.
 Geol 3050 GIS for Geologists Exercise 15 Exercise 15 Making a Virtual Fieldtrip: Importing GPS points and Hyperlinking images. Due: Thursday, March 22. Goal: A) Get familiar with importing GPS points and
Intro to GIS (requirements: basic Windows computer skills and a flash drive)
") Introduction to GIS Intro to GIS (requirements: basic Windows computer skills and a flash drive) Part 1. What is GIS. 1. System: hardware (computers, devices), software (proprietary or free), people. 2.
Introduction to GIS Intro to GIS (requirements: basic Windows computer skills and a flash drive) Part 1. What is GIS. 1. System: hardware (computers, devices), software (proprietary or free), people. 2.
INTRODUCTION TO GIS WORKSHOP EXERCISE
 111 Mulford Hall, College of Natural Resources, UC Berkeley (510) 643-4539 INTRODUCTION TO GIS WORKSHOP EXERCISE This exercise is a survey of some GIS and spatial analysis tools for ecological and natural
Exercise 3-1: Soil property mapping
 Exercise 3-1: Soil property mapping Mapping objectives: Create a soil analysis point layer from tabular data in QGIS Create a continuous surface soil property map using Kriging Interpolation in SAGA GIS
Launch QGIS. Launch QGIS from. Open window Quantum GIS (Figure 1.1 below) Start All Programs Quantum GIS. QGISIcon on the desk top
 Start All Programs Quantum GIS. QGISIcon on the desk top") QGIS Launch QGIS Launch QGIS from Start All Programs Quantum GIS OR QGISIcon on the desk top Open window Quantum GIS (Figure 1.1 below) 2 Figure 1.1 3 Opening Raster For this exercise we demonstrate three
QGIS Launch QGIS Launch QGIS from Start All Programs Quantum GIS OR QGISIcon on the desk top Open window Quantum GIS (Figure 1.1 below) 2 Figure 1.1 3 Opening Raster For this exercise we demonstrate three
GY301 Geomorphology Lab 5 Topographic Map: Final GIS Map Construction
 GY301 Geomorphology Lab 5 Topographic Map: Final GIS Map Construction Introduction This document describes how to take the data collected with the total station for the campus topographic map project and
Introduction to GIS & Mapping: ArcGIS Desktop
 Introduction to GIS & Mapping: ArcGIS Desktop Your task in this exercise is to determine the best place to build a mixed use facility in Hudson County, NJ. In order to revitalize the community and take
Low Cost and Free Public Health Mapping Tools
 Low Cost and Free Public Health Mapping Tools Quantum GIS - QGIS 1) Download and Install a) QGIS can be quickly and easily installed on Windows, Macs and Linux from installers found here: http://hub.qgis.org/projects/quantum-gis/wiki/download
Segmentation Guide using open source resources By Paul Russell, Ana Carolina Fiorini, and Trevor Caughlin
 Segmentation Guide using open source resources By Paul Russell, Ana Carolina Fiorini, and Trevor Caughlin This guide aims to give you a step by step guidance to digitize tree cover in google earth using
Press the Plus + key to zoom in. Press the Minus - key to zoom out. Scroll the mouse wheel away from you to zoom in; towards you to zoom out.
 Navigate Around the Map Interactive maps provide many choices for displaying information, searching for more details, and moving around the map. Most navigation uses the mouse, but at times you may also
Equipping Municipalities with GIS Software
 Equipping Municipalities with GIS Software Tutorial for QGIS 2.2 Prepared by Aylo Engineering s.a.r.l. 25/05/2014 www.ayloengineering.com Overview Welcome to the wonderful world of Geographical Information
ArcGIS Extension User's Guide
 ArcGIS Extension 2010 - User's Guide Table of Contents OpenSpirit ArcGIS Extension 2010... 1 Installation ( ArcGIS 9.3 or 9.3.1)... 3 Prerequisites... 3 Installation Steps... 3 Installation ( ArcGIS 10)...
I. An Intro to ArcMap Version 9.3 and 10. 1) Arc Map is basically a build your own Google map
 Arc Map is basically a build your own Google map") I. An Intro to ArcMap Version 9.3 and 10 What is Arc Map? 1) Arc Map is basically a build your own Google map a. Display and manage geo-spatial data (maps, images, points that have a geographic location)
I. An Intro to ArcMap Version 9.3 and 10 What is Arc Map? 1) Arc Map is basically a build your own Google map a. Display and manage geo-spatial data (maps, images, points that have a geographic location)
Lab 3: Digitizing in ArcGIS Pro
 Lab 3: Digitizing in ArcGIS Pro What You ll Learn: In this Lab you ll be introduced to basic digitizing techniques using ArcGIS Pro. You should read Chapter 4 in the GIS Fundamentals textbook before starting
GGR 375 QGIS Tutorial
 GGR 375 QGIS Tutorial With text taken from: Sherman, Gary E. Shuffling Quantum GIS into the Open Source GIS Stack. Free and Open Source Software for Geospatial (FOSS4G) Conference. 2007. Available online
Converting AutoCAD Map 2002 Projects to ArcGIS
 Introduction This document outlines the procedures necessary for converting an AutoCAD Map drawing containing topologies to ArcGIS version 9.x and higher. This includes the export of polygon and network
QUANTUM GIS GUIDE FOR WASH FACILITY DATA COLLECTORS AND -MANAGERS
 COWASH Training Quantum GIS 1 QUANTUM GIS GUIDE FOR WASH FACILITY DATA COLLECTORS AND -MANAGERS Quantum GIS (QGIS) is widely used open source GIS software which usage is very similar to GIS-software market
Introduction to QGIS: Instructor s Notes
 2016 Introduction to QGIS: Instructor s Notes Created by: MARK DE BLOIS, CEO / FOUNDER, UPANDE LIMITED WITH SUPPORT FROM THE WORLD BANK AND THE UK DEPARTMENT FOR INTERNATIONAL DEVELOPMENT (DFID) Module
Lab 18c: Spatial Analysis III: Clip a raster file using a Polygon Shapefile
 Environmental GIS Prepared by Dr. Zhi Wang, CSUF EES Department Lab 18c: Spatial Analysis III: Clip a raster file using a Polygon Shapefile These instructions enable you to clip a raster layer in ArcMap
Mapping Census data in QGIS
 Mapping Census data in QGIS Contents Contents 1. Introduction...3 1.1. Census data...3 1.2. Boundary data...3 1.3. Mapping software...3 2. Obtain your census data...4 Step 1: Geography...4 Step 2: Topics...5
Topic 1: Getting started Topic 2: Finding a location... 5
 Navigating LISTmap Topic 1: Getting started... 3 1. What is LISTmap?... 3 2. Compatible browsers... 3 3. A quick look at LISTmap... 3 Topic 2: Finding a location... 5 1. Using the search bar... 5 2. Zooming...
Spatial data and QGIS
 Spatial data and QGIS Xue Jingbo IT Center 2017.08.07 A GIS consists of: Spatial Data. Computer Hardware. Computer Software. Longitude Latitude Disease Date 26.870436-31.909519 Mumps 13/12/2008 26.868682-31.909259
Building Vector Layers
 Building Vector Layers in QGIS Introduction: Spatially referenced data can be separated into two categories, raster and vector data. This week, we focus on the building of vector features. Vector shapefiles
Startup. Why are you here? What are your experiences? What are your major working/research topics? What do you want to learn?
 Startup Why are you here? What are your experiences? What are your major working/research topics? What do you want to learn? Introduction to Geographic information systems Description of a GIS GIS is a
Georeferencing and Digitizing
 INTRODUCTION There is a great deal of geographic data available in formats that cannot be immediately integrated with other GIS data. In order to use these types of data in GIS it is necessary to align
Bharath Setturu Research scholar, EWRG, Center for Ecological Sciences, IISc, Bangalore & EWRG-CES IIIT-HYDERABAD
 Bharath Setturu Research scholar, EWRG, Center for Ecological Sciences, IISc, Bangalore settur@ces.iisc.ernet.in & IIIT-HYDERABAD Introduction to QGIS oquantum GIS (QGIS) is a GIS tool for managing geographical
Getting Started with GIS using ArcGIS 10.6 What is GIS? and - Module 1 Creating a map document
 Getting Started with GIS using ArcGIS 10.6 What is GIS? and - Module 1 Creating a map document Marcel Fortin Map & Data Library mdl@library.utoronto.ca 2018 http://mdl.library.utoronto.ca This workshop
ArcCatalog or the ArcCatalog tab in ArcMap ArcCatalog or the ArcCatalog tab in ArcMap ArcCatalog or the ArcCatalog tab in ArcMap
 ArcGIS Procedures NUMBER OPERATION APPLICATION: TOOLBAR 1 Import interchange file to coverage 2 Create a new 3 Create a new feature dataset 4 Import Rasters into a 5 Import tables into a PROCEDURE Coverage
QGIS Workshop Su Zhang and Laura Gleasner 11/15/2018. QGIS Workshop
 1. Introduction to QGIS QGIS Workshop QGIS is a free and open source Geographic Information System (GIS). QGIS can help users create, edit, visualize, analyze, and publish geospatial information on various
Using ArcGIS 10.x Introductory Guide University of Toronto Mississauga Library Hazel McCallion Academic Learning Centre
 Using ArcGIS 10.x Introductory Guide University of Toronto Mississauga Library Hazel McCallion Academic Learning Centre FURTHER ASSISTANCE If you have questions or need assistance, please contact: Andrew
Chapter 7. A Quick Tour of ArcGIS Pro
 Chapter 7 A Quick Tour of ArcGIS Pro Skills you will learn: This tutorial is intended to get you going using ArcGIS Pro, a new desktop application that is part of ArcGIS Desktop. A separate tutorial gives
Workshop #1: Set Up Project File and RAS Mapper
 Workshop #1: Set Up Project File and RAS Mapper 1 In this workshop, you will: Install and open HEC-RAS 5.0.3 Create a project file Obtain terrain and projection data Import terrain data into RAS Mapper
CHAPTER 5 DIGITAL ELEVATION MODEL AND 3D VISUALIZATION
 CHAPTER 5 DIGITAL ELEVATION MODEL AND 3D VISUALIZATION A digital elevation model (DEM) is a digital model or 3D representation of a terrain's surface. A DEM can be represented as a raster (a grid of squares,
QGIS Level 2 Stuart Ladd
 QGIS Level 2 Stuart Ladd Introduction This guide will take you through some more advanced, field work-related tasks that can be done with QGIS. It assumes you have successfully been through the Level 1
SPATIAL DESIGN NETWORK ANALYSIS sdna in QGIS
 SPATIAL DESIGN NETWORK ANALYSIS sdna in QGIS 1 Installing sdna+ as plugin for QGIS... 2 1.1 Download & Install sdna... 2 1.2 Setting up sdna in QGIS... 3 1.3 Open the sdna toolbox... 5 2 sdna in QGIS Processing
Bharath Setturu Research scholar, EWRG, Center for Ecological Sciences, IISc, Bangalore & IIIT-HYDERABAD
 Bharath Setturu Research scholar, EWRG, Center for Ecological Sciences, IISc, Bangalore settur@ces.iisc.ernet.in & IIIT-HYDERABAD Introduction to QGIS oquantum GIS (QGIS) is a GIS tool for managing geographical
for ArcSketch Version 1.1 ArcSketch is a sample extension to ArcGIS. It works with ArcGIS 9.1
 ArcSketch User Guide for ArcSketch Version 1.1 ArcSketch is a sample extension to ArcGIS. It works with ArcGIS 9.1 ArcSketch allows the user to quickly create, or sketch, features in ArcMap using easy-to-use
Introduction to QGIS: Student Workbook
 2016 Introduction to QGIS: Student Workbook Created by: MARK DE BLOIS, CEO / FOUNDER, UPANDE LIMITED WITH SUPPORT FROM THE WORLD BANK AND THE UK DEPARTMENT FOR INTERNATIONAL DEVELOPMENT (DFID) Module 3:
How to...create a Video VBOX Gauge in Inkscape. So you want to create your own gauge? How about a transparent background for those text elements?
 BASIC GAUGE CREATION The Video VBox setup software is capable of using many different image formats for gauge backgrounds, static images, or logos, including Bitmaps, JPEGs, or PNG s. When the software
An Introduction to Geographic Information Systems (GIS) using ArcGIS 9.2
 using ArcGIS 9.2") An Introduction to Geographic Information Systems (GIS) using ArcGIS 9.2 by Marcel Fortin, GIS and Map Librarian, University of Toronto Libraries, 2009 gis.maps@utoronto.ca http://www.library.utoronto.ca/maplib/
An Introduction to Geographic Information Systems (GIS) using ArcGIS 9.2 by Marcel Fortin, GIS and Map Librarian, University of Toronto Libraries, 2009 gis.maps@utoronto.ca http://www.library.utoronto.ca/maplib/
Undo Button Clicking this tool will undo the last action. Clicking on this tool multiple times will undo all subsequent changes that were made.
 SMS Featured Icons: Editor Window This document includes a brief description of the tools in the SMS Desktop Software Editor windows, as well as showing you the toolbar shortcuts to easily access these
In order to follow this set of directions you will need the following
 How to Create Maps & Figures in ArcView 9x In order to follow this set of directions you will need the following 1) the Jenny s Louisiana GIS Instructional CD 2) a computer with ArcGIS on it (version 9.0
Making a Sackville Coastal Flood Map
 Making a Sackville Coastal Flood Map Demo covers: Accessing and previewing map templates Modifying map elements such as titles, data frames, legends & scale bars Drawing a graphic on a map Adding text
_Tutorials. Arcmap. Linking additional files outside from Geodata
 _Tutorials Arcmap Linking additional files outside from Geodata 2017 Sourcing the Data (Option 1): Extracting Data from Auckland Council GIS P1 First you want to get onto the Auckland Council GIS website
Lab 6: Transforming Spatial Data
 Lab 6: Transforming Spatial Data Objectives: The primary objectives of this lab are to georeference a raster dataset and to create GIS data by digitizing features from an image as a backdrop. Specifics:
Terrain Analysis. Using QGIS and SAGA
 Terrain Analysis Using QGIS and SAGA Tutorial ID: IGET_RS_010 This tutorial has been developed by BVIEER as part of the IGET web portal intended to provide easy access to geospatial education. This tutorial
RAPIDMAP Geocortex HTML5 Viewer Manual
 RAPIDMAP Geocortex HTML5 Viewer Manual This site was developed using the evolving HTML5 web standard and should work in most modern browsers including IE, Safari, Chrome and Firefox. Even though it was
v Working with Rasters SMS 12.1 Tutorial Requirements Raster Module Map Module Mesh Module Time minutes Prerequisites Overview Tutorial
 v. 12.1 SMS 12.1 Tutorial Objectives This tutorial teaches how to import a Raster, view elevations at individual points, change display options for multiple views of the data, show the 2D profile plots,
v SMS Tutorials Working with Rasters Prerequisites Requirements Time Objectives
 v. 12.2 SMS 12.2 Tutorial Objectives Learn how to import a Raster, view elevations at individual points, change display options for multiple views of the data, show the 2D profile plots, and interpolate
To the GeoView System Overview Online Training Course
 Welcome! To the GeoView System Overview Online Training Course The Alberta Department of Energy provides GeoView as a mapping system to enable users to find geographic information in Alberta. GeoView retrieves
Basic Tasks in ArcGIS 10.3.x
 Basic Tasks in ArcGIS 10.3.x This guide provides instructions for performing a few basic tasks in ArcGIS 10.3.1, such as adding data to a map document, viewing and changing coordinate system information,
Measuring Area/Length of Organisms with GIS
 Measuring Area/Length of Organisms with GIS These instructions enable you to measure the length and area of microscopic organisms in ArcGIS from digital photographs. The four-step process involves: georeferencing
THE HONG KONG POLYTECHNIC UNIVERSITY DEPARTMENT OF LAND SURVEYING & GEO-INFORMATICS LSGI521 PRINCIPLES OF GIS
 THE HONG KONG POLYTECHNIC UNIVERSITY DEPARTMENT OF LAND SURVEYING & GEO-INFORMATICS LSGI521 PRINCIPLES OF GIS Student name: Student ID: Table of Content Working with files, folders, various software and
Hands-on: Using ArcGIS and QGIS. GIS Mapping for Linguistic Research Jennifer Cramer University of Kentucky
 Hands-on: Using ArcGIS and QGIS GIS Mapping for Linguistic Research Jennifer Cramer University of Kentucky Hands on! I think last week went well! Like last week, I ll do a quick run through of the assignment,
v SMS 12.1 Tutorial GIS Requirements GIS Module Map Module ArcGis (Optional) Time minutes Prerequisites None Objectives
 Time minutes Prerequisites None Objectives") v. 12.1 SMS 12.1 Tutorial Objectives This tutorial demonstrates how to read in data, visualize it, and convert it into SMS coverage data that could be used to build a numeric model. This tutorial will
v. 12.1 SMS 12.1 Tutorial Objectives This tutorial demonstrates how to read in data, visualize it, and convert it into SMS coverage data that could be used to build a numeric model. This tutorial will
v SMS 12.2 Tutorial GIS Requirements GIS Module Map Module ArcGis (Optional) Time minutes Prerequisites None Objectives
 Time minutes Prerequisites None Objectives") v. 12.2 SMS 12.2 Tutorial Objectives This tutorial demonstrates how to read in data, visualize it, and convert it into SMS coverage data that could be used to build a numeric model. This tutorial will
v. 12.2 SMS 12.2 Tutorial Objectives This tutorial demonstrates how to read in data, visualize it, and convert it into SMS coverage data that could be used to build a numeric model. This tutorial will
Objective: To be come more familiar with some more advanced applications in ArcGIS.
 Advanced Procedures in ArcGIS 2005 SPACE Workshop OSU Author: Jason VanHorn Purpose: Having gone through Getting to know ArcGIS, you are now ready to do some more advanced applications. In this lab you
Biodiversity Interactive Map
 Powered by MapShare Biodiversity Interactive Map (BIM) User Tips The Biodiversity Interactive Map (BIM) is accessible via the Department of Environment and Primary Industries (DEPI) website at www.depi.vic.gov.au.
MAP ASPEN Training Manual. Navigate back to City of Aspen Home, GIS Home, Map Aspen Home or the Data Catalog from any page in the site.
 Home Page Features: Top Navigation Bar MAP ASPEN Training Manual Navigate back to City of Aspen Home, GIS Home, Map Aspen Home or the Data Catalog from any page in the site. Search Bar Search for all content
Objectives Learn how to work with projections in GMS, and how to combine data from different coordinate systems into the same GMS project.
 v. 10.2 GMS 10.2 Tutorial Working with map projections in GMS Objectives Learn how to work with projections in GMS, and how to combine data from different coordinate systems into the same GMS project.
Making Yield Contour Maps Using John Deere Data
 Making Yield Contour Maps Using John Deere Data Exporting the Yield Data Using JDOffice 1. Data Format On Hard Drive 2. Start program JD Office. a. From the PC Card menu on the left of the screen choose
Exercise 4: Import Tabular GPS Data and Digitizing
 Exercise 4: Import Tabular GPS Data and Digitizing You can create NEW GIS data layers by digitizing on screen with an aerial photograph or other image as a back-drop. You can also digitize using imported
GIS DATA SUBMISSION USER GUIDE. Innovation and Networks Executive Agency
 Innovation and Networks Executive Agency GIS DATA SUBMISSION USER GUIDE Innovation and Networks Executive Agency (INEA) W910 Chaussée de Wavre 910 B-1049 Brussels, Belgium Tel: +32 (0)2 29 95252 Fax: +32
GPS TO GIS EXERCISE (30 PTS)
") GPS TO GIS EXERCISE (30 PTS) This exercise will allow you to demonstrate your cumulative knowledge of using a GPS receiver to collect data with locational information, downloading this data to a desktop
GPS TO GIS EXERCISE (30 PTS) This exercise will allow you to demonstrate your cumulative knowledge of using a GPS receiver to collect data with locational information, downloading this data to a desktop
Geology & Geophysics REU GPS/GIS 1-day workshop handout #3: Working with data in ArcGIS
 Geology & Geophysics REU GPS/GIS 1-day workshop handout #3: Working with data in ArcGIS In this lab you ll start to use some basic ArcGIS routines to display your data. These include overlaying data on
Combine Yield Data From Combine to Contour Map Ag Leader
 Combine Yield Data From Combine to Contour Map Ag Leader Exporting the Yield Data Using SMS Program 1. Data format On Hard Drive. 2. Start program SMS Basic. a. In the File menu choose Open. b. Click on
Download elevation model page 2 Re-Project DEM coordinates page 5 Cut region of interest page 10
 1 Download elevation model page 2 Re-Project DEM coordinates page 5 Cut region of interest page 10 Version June 2017, Dr. Jonas von Rütte, Dr. Peter Lehmann 2 Download elevation model for region of interest:
Geology & Geophysics REU GPS/GIS 1-day workshop handout #2: Importing Field Data to ArcGIS
 Geology & Geophysics REU GPS/GIS 1-day workshop handout #2: Importing Field Data to ArcGIS In this lab you ll start to use some basic ArcGIS routines. These include importing GPS field data and creating
The ArcMap Interface and Using Basic ArcMap Analysis Tools to Create a Map
 The ArcMap Interface and Using Basic ArcMap Analysis Tools to Create a Map *You will need a computer with ESRI ArcGIS Desktop version 9.3 or higher installed* Data Download 1. Save the zipped folder with
Tutorial 1: Downloading elevation data
 Tutorial 1: Downloading elevation data Objectives In this exercise you will learn how to acquire elevation data from the website OpenTopography.org, project the dataset into a UTM coordinate system, and
Lesson 2 Installing and Using Quantum GIS (QGIS)
") Lesson 2 Installing and Using Quantum GIS (QGIS) Use file Explorer to open County QGIS portable hard drive provided. The program execute (.exe) will be at the bottom of the list. Double click on the file.
Lesson 2 Installing and Using Quantum GIS (QGIS) Use file Explorer to open County QGIS portable hard drive provided. The program execute (.exe) will be at the bottom of the list. Double click on the file.
Introduction to GIS software
 Introduction to GIS software There are a wide variety of GIS software packages available. Some of these software packages are freely available for you to download and could be used in your classroom. ArcGIS
Strater 5. Superior well log, borehole & cross section plotting. Quick Start Guide
 Strater 5 Superior well log, borehole & cross section plotting Quick Start Guide Strater Registration Information Your Strater serial number is located on the CD cover or in the email download instructions,
Exercise 5: Import Tabular GPS Data and Digitizing
 Exercise 5: Import Tabular GPS Data and Digitizing You can create NEW GIS data layers by digitizing on screen with an aerial photograph or other image as a back-drop. You can also digitize using imported
Heads-up Digitizing from Scanned Hard-Copy Maps Part I Georeferencing Scanned Images 1
 Data conversion/entry (GIS, databases) November 21-25, 2006 Freetown, Sierra Leone Heads-up Digitizing from Scanned Hard-Copy Maps Part I Georeferencing Scanned Images 1 Objectives: Explore digital archives
Display Layers in Geosoft 3D View
 Use the New 2D/3D Workflow features in Target for ArcGIS In Target for ArcGIS version 3.5, there are three new interconnected features that make integrating 2D and 3D data in plan and section maps easier.
Introducing ArcScan for ArcGIS
 Introducing ArcScan for ArcGIS An ESRI White Paper August 2003 ESRI 380 New York St., Redlands, CA 92373-8100, USA TEL 909-793-2853 FAX 909-793-5953 E-MAIL info@esri.com WEB www.esri.com Copyright 2003
v SMS 11.1 Tutorial GIS Requirements GIS Module Map Module ArcGis (Optional) Time minutes Prerequisites None Objectives
 Time minutes Prerequisites None Objectives") v. 11.1 SMS 11.1 Tutorial GIS Objectives This tutorial demonstrates how you can read in GIS data, visualize it, and convert it into SMS coverage data that could be used to build a numeric model. We will
v. 11.1 SMS 11.1 Tutorial GIS Objectives This tutorial demonstrates how you can read in GIS data, visualize it, and convert it into SMS coverage data that could be used to build a numeric model. We will
Highways by Exor MapCapture Configuration Guide v4.5
 Highways by Exor MapCapture Configuration Guide v4.5 The world s leading highways asset management system This page is intentionally blank Quality Assurance Statement Quality Assurance Statement File:
Working with demographic grids in QGIS
 Working with demographic grids in QGIS Anna Dmowska dmowska@amu.edu.pl April 2017 1. Introduction SocScape (Social Landscape) is a research project which provides open access to high resolution (30 m)
Lab 12: Sampling and Interpolation
 Lab 12: Sampling and Interpolation What You ll Learn: -Systematic and random sampling -Majority filtering -Stratified sampling -A few basic interpolation methods Data for the exercise are in the L12 subdirectory.
The Functions of MapperWrapper
 The Functions of MapperWrapper Exercise 3 Step 1: Review the The MapPlace MapperWrapper Page Click Main Maps from the MapPlace home page. Select map MapperWrapper which is the fourth map from the top.
GIS IN ECOLOGY: CREATING RESEARCH MAPS
 GIS IN ECOLOGY: CREATING RESEARCH MAPS Contents Introduction... 2 Elements of Cartography... 2 Course Data Sources... 3 Tasks... 3 Establishing the Map Document... 3 Laying Out the Map... 5 Exporting Your
Chapter 5. Presenting Data
 Chapter 5. Presenting Data Copyright McGraw-Hill Education. Permission required for reproduction or display. 5-1 Map Design Process 5-2 1 About ArcGIS Chapter 5. Presenting Data 5-3 Page layouts and map