To the GeoView System Overview Online Training Course
|
|
|
- Howard Weaver
- 6 years ago
- Views:
Transcription
1 Welcome! To the GeoView System Overview Online Training Course The Alberta Department of Energy provides GeoView as a mapping system to enable users to find geographic information in Alberta. GeoView retrieves the mineral specific profile to display the appropriate configuration of the map. Page 1 of 57
2 Revision Date Revisions Type Page Number May 3, 2016 Initial Creation All May 11, 2016 Updates All Page 2 of 57
3 INTRODUCTION In this module you will learn about Geoview s: Screen layout Information panel and map layers Toolbar Home Queries Tools Analysis Go to Location Download Data How to navigate the map How to use queries How to use identify How to use annotations How to create a printable map How to export a map Note: As this course demonstrates the use of the GeoView tool, the data in some instances may not portray the actual Crown or Freehold ownership and is not specific to a particular mineral type map. Page 3 of 57

4 SCREEN LAYOUT The GeoView screen display has three mains sections: TOOLBAR AREA INFORMATION PANEL MAP VIEW Contains numerous tools that are used to move around the map, find or search information on the map, print the map etc. These tools are categorized into high-level groups: Home, Queries, Analysis, Go to Location and Download Data Shows different kinds of information/results when you interact with the map. For example, this panel displays the Map Layers where you can select different layers to hide or show on the map. Shows the map window where you can interact with the map by zooming, panning, annotating. Page 4 of 57

5 INFORMATION PANEL AND MAP LAYERS Map layers control the display of the map layers list. You can check or uncheck the map layers according to your requirement. You can also control the visibility and transparency of the map using the sliders. Page 5 of 57

6 INFORMATION PANEL AND MAP LAYERS LAYER GROUP AND LAYER NAME The Information Panel display consists of a Layer Group and Layer Names. When the Layer Group is expanded, the Layer Names will be visible. Y ou can check/uncheck the Layer Group and Layer Names to control visibility in the map. The display of the Layer Group will override the display of the Layer Names. Page 6 of 57

7 INFORMATION PANEL MAP LEGEND The Map legend shows the corresponding legend for the layers used in map. You can toggle between Show Legend and Show Layer. Page 7 of 57

 the map in any direction. To pan the map, click on it and drag in any direction.")
8 TOOLBAR The toolbar contains many of the tools you use to pan (move around), zoom in and out, as well as to find and manipulate the information that is stored in the map. The toolbar is divided into Tabs that group tools into high-level functions for example; Home, Queries, Tools, Analysis, Go to Location and Download Data. Each tab is divided into Sections by function for example, for the Home Tab; there are Navigation Tools and Find Data sections. TOOLBAR TAB - HOME Use these tools: To: Pan (move) the map in any direction. To pan the map, click on it and drag in any direction. Use the Pan tool to return to panning when you have used other tools. Zoom in click and drag an area on the map or use your roller on your mouse. Zoom out click and drag an area on the map or use your roller on your mouse. Return to the extent (scale) that the map was at when it opened. Return to the extent (scale) that the map was at when it opened. Page 8 of 57
9 The map is zoomed backward to the previous extent (previous view of the map). If you have zoomed forward and back the map will zoom forward to the next extent. Identify information at the point on the map that is clicked is available at the section level scale. Create and navigate to a previously created bookmark. To add a bookmark for the current extent, click the plus +, enter a name, and then click OK. Opens page that lists the Geoview Training Manuals related to the specific mineral map accessed. How to navigate the map Pan Page 9 of 57

10 How to navigate the map Zoom In / Zoom Out Zoom In and Zoom out allows user to view selected areas at different viewing scales. Page 10 of 57


11 Selecting the zoom out function works opposite of the zoom in function. Note: Once you are in the zoom mode you can also use the wheel on your mouse to zoom in and out. How to navigate the map Initial View / Full Extent Initial View and Full Extent returns the map to the extent (scale) that the map was at when it opened. Page 11 of 57

12 How to navigate the map Previous Extent/Next Extent This allows user to navigate to go back to a previous extent the user has viewed and then the next extent will go forward. Page 12 of 57


13 How to use Identify Note: When using the identify function you need to have the section scale visible. Page 13 of 57


14 How to use Bookmarks Open map Find area of interest Page 14 of 57


15 Open Metallic and Industrial map Find area of interest Repeat bookmark process. Page 15 of 57


16 Note: Bookmarks are based on the user not on the different mineral type maps. If you are in the Coal map and click on bookmarks and select the Metallic & Industrial bookmark it will display the Met & Ind bookmark area on the Coal map. Page 16 of 57


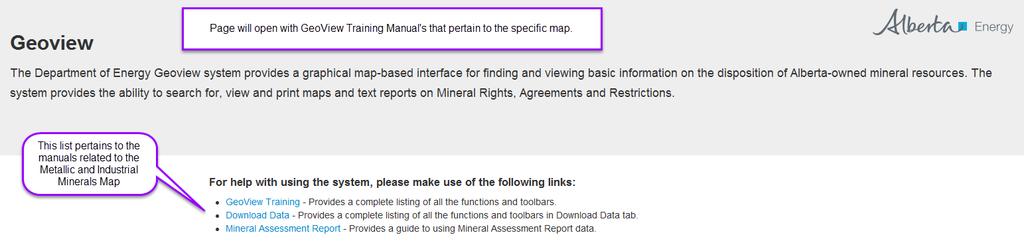
17 How to access manual - Help Page 17 of 57
18 TOOLBAR TAB QUERIES Use these tools: To: Show the layer list in the Map Layers panel. Open the Query in the Information Pane. The Query makes it possible to specify a search by layer, field, and values. It is also possible to add multiple conditions to a search. Results will be returned. Open Filter in the Information Pane. The Filter Builder enables end users to filter the features that show on the map. The Filter makes it possible to specify a definition expression to apply for a certain layer using its fields and specific values. The layer will be filtered to show only the results of the definition expression. Multiple conditions can be used to filter a certain layer. Page 18 of 57


19 Note: The different mineral maps display different layer information. How to use Queries Steps 1. Select a query layer, layers available will display in a drop down 2. Enter data e.g. land key 3. Add another condition as required 4. Add spatial filters 5. Click search When search is executed you may end up with more than one result, select the one that you require. Page 19 of 57
20 Page 20 of 57


21 The result of the query is displayed. This is sample from prod I think issue has been raised with geocortex, waiting for this required function. Page 21 of 57

22 How to use - Filter Page 22 of 57


23 How to use Queries - Results - View Detailed Report The first one displays data in the information panel and only limited data. Page 23 of 57
24 The second one, view detailed report, provides all public data in a report format. Page 24 of 57
25 Page 25 of 57

26 How to use Filter Page 26 of 57
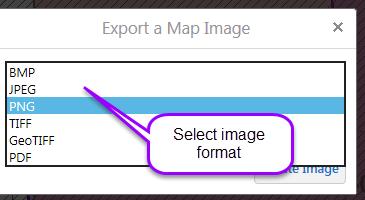
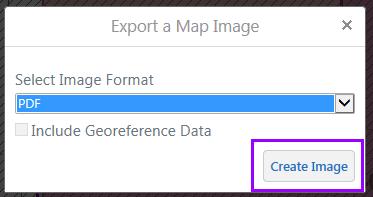
27 TOOLBAR TAB TOOLS Use these tools: To: Open the Create a Printable Map dialog box where you can select the Layout, Output Format, Resolution, and Scale to print the map. Open the Export a Map Image dialog box and select the image format that you want to export the map into. You can export to BMP, JPEG, PNG, TIFF, GeoTiff and PDF Image formats. Draw a point on the map. The shape, size, colour and transparency of the point can be set using tools that appear on the toolbar when you select one of the drawing tools. Draw freely on the map in any direction. The style, thickness, colour, and transparency of the line can be set. Page 27 of 57
28 Draw a straight line or click to change the line and draw in a new direction. The style, thickness, colour, and transparency of the line can be set. Draw a polygon on the map, clicking to change direction. Double-click to stop drawing. You can set the thickness, colour, and transparency of the border and the colour and transparency of the fill. Drawing freely on the map for irregular shapes for such as portions of land. The style, thickness, colour, and transparency of the line can be set. Draw a rectangle on the map. Click and drag across the map. You can set the thickness, colour, and transparency of the border and the colour and transparency of the fill. Draw a circle on the map. Drag into the center or outwards to change the size of the circle. You can set the thickness, colour, and transparency of the border and the colour and transparency of the fill. Draw an ellipse on the map. Drag in different directions to change the shape and size of the ellipse. You can set the thickness, colour, and transparency of the border and the colour and transparency of the fill. Add text to the map. When text is selected the snapping and style buttons will display. Click on the map and type the text. You can change the font, size, colour, transparency and angle of the text. You can add multiple lines of text and select layer and field information to add to the label. Snapping tools are enabled when text button is selected. The user may enable or disable snapping by clicking the Enable Snapping button. The user may choose which layers are affected by snapping by clicking the Select Snapping Layers button. When enabled, snapping allows the user to precisely draw shapes on the map by snapping to the nearest point, vertex or edge of an existing shape within a configurable radius around the mouse pointer You can change the font, size, transparency. You can add multiple lines of text and select layer and field information to add to the label. Edit the points of a drawing on the map. When you click on the drawing you want to edit, the points activate and you can then drag any of the points in any direction to change the shape of your drawing. You can also rotate the drawing by clicking and dragging the square above the marquee in the middle of the graphic. Remove drawings from the map one at a time by clicking on each one. Page 28 of 57

29 Clear all the drawings on the map at the same time. How to create a printable map map in formatted style You can change the title and add notes on the map. All the changes to the map can be printed to PDF. The visible area of the map is the area which will appear in the created PDF map. Your map will run in the background and notify you in the information panel that it is ready for viewing, then open file for viewing and select print option (file on the toolbar). Page 29 of 57


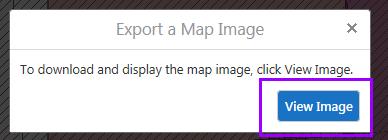
30 How to export a map map in non-formatted style Export a map image pop up will display. Page 30 of 57

31 Page 31 of 57

32 You can then print or save image. How to use draw tools drawing and Text Different shapes and text can be added to the map but these are temporary. Leaving or refreshing the session will clear. These tools are used on the map for the purpose of printing. Based on the draw tool selected you can also select a style. Enable Snapping Snapping is useful when you are drawing a polygon and want it to follow the lines in another graphic, displays a point indicator. Page 32 of 57

33 Select Snapping Layers Styles User must select the type of drawing tool for the style options to display. Example if draw tool selected is freehand the style options are. Example if draw tool selected is rectangle the style options are. Page 33 of 57


34 Using the line Using the circle Page 34 of 57

35 If text is selected you can select a font style. Note: There is no option currently that will allow the user to select font style size or colour. Page 35 of 57

36 Page 36 of 57


37 Text will display. User can also enlarge the text or move. To edit/remove any drawing or text data put on the map you can use the edit, erase or clear functions. Page 37 of 57

38 TOOLBAR TAB ANALYSIS Use these tools: To: Identify data at a particular point anywhere on the map. All the features beneath the point you click are listed in the Results List. Identify features by drawing a line in any direction on the map. All the features that intersect with the line you draw are listed in the Results List. Identify features by dragging a line in any direction on the map. All the features that intersect with the line you draw are listed in the Results List. Identify features by drawing a segmented shape over an area on the map. All the features beneath the shape you draw are listed in the Results List. Identify features by drawing a rectangle over an area on the map. All the features beneath the shape you draw are listed in the Results List. Measure distances on the map by drawing a segmented line. Measure an area of the map by drawing a shape. When distance/area is selected the units and snapping buttons will display. Change the unit of measurement on a drawing to other options like Kilometers, Hectares, Acres, etc. The user may enable or disable snapping by clicking the Enable Snapping button. The user may choose which layers are affected by snapping by clicking the Select Snapping Layers button. When enabled, snapping allows the user to precisely draw shapes on the map by snapping to the nearest point, vertex or edge of an existing shape within a configurable radius around the mouse pointer. Page 38 of 57

39 Add the distance or area measurement to the map as a drawing. Erase a drawing by clicking it. Clear all the drawings on the current map. Note: In order to enable the Drawing tools, a drawing must first be created. How to use identify tools Drawing Note: When specific draw/identify button selected, addition options will display. Page 39 of 57


40 Using the point Using the rectangle Page 40 of 57


41 Using the enable buffering and identifiable layers How to use Distance and Area Page 41 of 57


42 Change the unit of measurement on a drawing to other options like Kilometers, Hectares, Acres, etc. Options of measure Page 42 of 57


43 To edit/remove any drawing or text data put on the map you can use the edit, erase or clear functions. Page 43 of 57

44 How to use Buffering TOOLBAR TAB GO TO LOCATION Page 44 of 57
 How to use Go to Location Go to ATS User can do an Alberta Township Survey (ATS) search based on m/twp/rge, m/twp/rge/sec or m/twp/rge/sec/qtr sec only.")
45 Use these tools: To: The Go to ATS (Alberta Township Survey) makes it possible to search by a specific land location (M/R/T: Sec, Qtr Sec) The Go to NTS (National Topographic System) makes it possible to search by a map sheet (e.g. 84F10) How to use Go to Location Go to ATS User can do an Alberta Township Survey (ATS) search based on m/twp/rge, m/twp/rge/sec or m/twp/rge/sec/qtr sec only. Page 45 of 57


46 Clear does not just clear the fields returns user to the layers info???? Page 46 of 57
 search based on the")

47 How to use Go to Location Go to NTS User can do a National Topographic System (NTS) search based on the NTS system used by Natural Resources Canada for providing general purpose topographic maps of the country. Page 47 of 57

48 Page 48 of 57


49 TOOLBAR TAB DOWNLOAD DATA Note: Download Data currently only applies to Coal and Metallic and Industrial Minerals Maps. Use these tools: To: Download the zip file containing the Coal or Metallic and Industrial Minerals Agreement data in SHAPE file format. Download the zip file containing the Coal or Metallic and Industrial Minerals Agreement data in DXF file format. How to download shape file data Page 49 of 57

50 Page 50 of 57

51 Page 51 of 57


52 How to download DXF file data Page 52 of 57


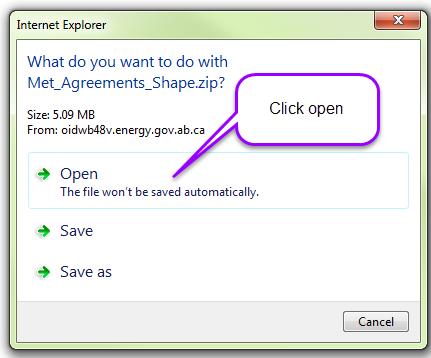
53 Note: The dated link is 24 hours behind live data. Upon clicking on the dated link, a zip file is provided to open or save. Page 53 of 57


54 How to use info Page 54 of 57
 or South (1 mile) of a section as per valid land descriptions for Road Allowance.")
55 Note: Road Allowance info sample is missing. Road Allowance Land Key Table for Metes and Bounds and Land Description Samples o Lands must be only North (2 miles) or South (1 mile) of a section as per valid land descriptions for Road Allowance. o This information describes the related metes and bounds based on the road allowance orientation as shown on the Township overlay. Landkey Road Appendix Description Allowance Orientation :11 RS :11RS Road Allowance lying to the South :11 RW :11RW Road Allowance lying to the West :11 RI :11RI Road Allowance being the South West intersection. Page 55 of 57
56 Page 56 of 57

57 Congratulations! You have completed the GeoView System Overview online Training Course. If you have any comments or questions on this training course, please forward them to the following address: GIS SOLUTIONS SUPPORT: Page 57 of 57
Press the Plus + key to zoom in. Press the Minus - key to zoom out. Scroll the mouse wheel away from you to zoom in; towards you to zoom out.
 Navigate Around the Map Interactive maps provide many choices for displaying information, searching for more details, and moving around the map. Most navigation uses the mouse, but at times you may also
Guide to Mapping Website (Public) December 2016 GC_236594
 December 2016 GC_236594") Guide to Mapping Website (Public) December 2016 GC_236594 Table of Contents Guide to Mapping Website (Public)... 1 December 2016... 1 Quick Start... 3 Map Layers... 4 How do I?... 5 Draw on the Map...
Guide to Mapping Website (Public) December 2016 GC_236594 Table of Contents Guide to Mapping Website (Public)... 1 December 2016... 1 Quick Start... 3 Map Layers... 4 How do I?... 5 Draw on the Map...
Getting Started with VicMap
 Getting Started with VicMap This is a brief overview of some of the tools and features available on VicMap. At any time you can right click on the map and click Identify What s Here to find more information
Biodiversity GIS (BGIS) Internet Mapping User Guide
 Internet Mapping User Guide") Biodiversity GIS (BGIS) Internet Mapping User Guide http://bgis.sanbi.org Contents 1 Basic Introduction to BGIS Website (http://bgis.sanbi.org)... 6 1.1 LUDS... 6 1.2 Projects... 6 1.3 Services... 6 1.4
Biodiversity GIS (BGIS) Internet Mapping User Guide http://bgis.sanbi.org Contents 1 Basic Introduction to BGIS Website (http://bgis.sanbi.org)... 6 1.1 LUDS... 6 1.2 Projects... 6 1.3 Services... 6 1.4
RAPIDMAP Geocortex HTML5 Viewer Manual
 RAPIDMAP Geocortex HTML5 Viewer Manual This site was developed using the evolving HTML5 web standard and should work in most modern browsers including IE, Safari, Chrome and Firefox. Even though it was
COGCC GIS Online Map Instructions - Internet Site April 10, 2018
 COGCC GIS Online Map Instructions - Internet Site April 10, 2018 Table of Contents Page Section Page Section 1 Introduction 8 Clear Selection 2 Double Click 8 Buffer 3 Arrow Tip Information 9 Select within
Climate-Smart New Orleans
 Climate-Smart New Orleans Table of Contents GETTING THERE... 2 Accessing the site... 2 Logging into the site... 2 Navigating the Map... 2 Zoom & Pan... 2 Change the map background... 3 Interacting in the
Mn/DOT MnCMAT Crash Analysis Application Help
 Mn/DOT MnCMAT Crash Analysis Application Contents Login... 5 User Login Dialog... 5 Login... 5 Request Access Dialog... 5 Forgotten Password Dialog... 6 Create/Open Project... 7 Create/Open Project Dialog...
Full Search Map Tab. This map is the result of selecting the Map tab within Full Search.
 Full Search Map Tab This map is the result of selecting the Map tab within Full Search. This map can be used when defining your parameters starting from a Full Search. Once you have entered your desired
Greater Bridgeport Regional Council Municipal GIS Viewer Training April 2015
 Greater Bridgeport Regional Council Municipal GIS Viewer Training April 2015 GBRC GIS Web Training Table of Contents Introduction........................................................... 3 Viewer Components.......................................................
City of La Crosse Online Mapping Website Help Document
 City of La Crosse Online Mapping Website Help Document This document was created to assist in using the new City of La Crosse online mapping sites. When the website is first opened, a map showing the City
Welcome to the Surface Water Data Viewer!
 1 Welcome to the Surface Water Data Viewer! The Surface Water Data Viewer is a mapping tool for the State of Wisconsin. It provides interactive web mapping tools for a variety of datasets, including chemistry,
U N I V E R S I T Y O F K E N T U C K Y. efacts 2-click Interactive Building Information Map ~ Help Guide ~ Revised January 20, 2016
 U N I V E R S I T Y O F K E N T U C K Y efacts 2-click Interactive Building Information Map ~ Help Guide ~ Revised January 20, 2016 Contents BUILDING SEARCH... 3 A. FIND A CAMPUS LOCATION... 3 GRAPHICAL
Overview of ArcGIS Online Applications. Champaign County
 Overview of ArcGIS Online Applications Champaign County Champaign County GIS Consortium Updated: April 2017 Table of Contents ArcGIS Online Application Overview... 3 Map Interface Symbology and Terminology...
COGCC GIS Online Map Tools-Intranet Site July 12, 2011
 COGCC GIS Online Map Tools-Intranet Site July 12, 2011 Table of Contents Page Section Page Section 1 Introduction 7 Clear Selection 2 Double Click 7 Buffer 2 Arrow Tip Information 8 Select within 3 Busy
User Manual Mobile client User Interface Version 5.0. Powered by
 User Manual Mobile client User Interface Version 5.0 Powered by Cartographic browser Gomap 4 1 Access control 5 1.1 Public access 5 1.2 Secured access 5 1.3 Multiple applications 5 2 Organisation 6 3 Parameters
IntraMaps End User Manual
 IntraMaps End User Manual For IntraMaps Version 8 Date: 6 th July 2014 Contents Introduction... 4 What is IntraMaps?... 4 Application... 5 Main Toolbar... 6 View... 7 Original View:... 7 Pan:... 7 Zoom
Version 1.0 August Users Guide
 Version 1.0 August 2016 Users Guide HABISask Users Guide First Edition 2016 Published by: Fish and Wildlife Branch Ministry of Environment 3211 Albert Street Regina, Saskatchewan S4S 5W6 SUGGESTED CITATION
Greenville County Internet Mapping System User s Guide
 Greenville County Internet Mapping System User s Guide Version 2.0 Greenville County Geographic Information Systems May 30, 2006 Table of Contents NAVIGATING TO THE ONLINE MAPPING APPLICATIONS...- 3 -
ArcView QuickStart Guide. Contents. The ArcView Screen. Elements of an ArcView Project. Creating an ArcView Project. Adding Themes to Views
 ArcView QuickStart Guide Page 1 ArcView QuickStart Guide Contents The ArcView Screen Elements of an ArcView Project Creating an ArcView Project Adding Themes to Views Zoom and Pan Tools Querying Themes
FlexMLS Maps Quick Reference Guide
 FlexMLS Maps Quick Reference Guide Full Search Map Tab Features Define Search Areas box Map tab in Full Search Radius Search tool from an address Show/Hide Property List, Locate Address, and Define Search
Tutorial for Lane County Mapping Applications
 Tutorial for Lane County Mapping Applications Contents Overview... 2 Tools... 2 Navigation Tools... 3 Display Tools... 5 Information Tools... 6 Sharing Tools... 7 Common Tasks... 9 Identify or Show Data
NEW LOOK OF RAPIDMAP! Below is how the RapidMap interface will look when it is initially opened.
 NEW LOOK OF RAPIDMAP! Below is how the RapidMap interface will look when it is initially opened. MAP LAYERS When the arrow to the left of the Search For button is clicked, a Map Layers panel will slide
Development Authority of the North Country (DANC) Internet Mapping Application Instructions Public Viewer 1. Purpose. 2. Logging-in. 3.
 Internet Mapping Application Instructions Public Viewer 1. Purpose. 2. Logging-in. 3.") Development Authority of the North Country (DANC) Internet Mapping Application Instructions Public Viewer 1. Purpose The purpose of this document is to outline basic functionality of the DANC Internet
Development Authority of the North Country (DANC) Internet Mapping Application Instructions Public Viewer 1. Purpose The purpose of this document is to outline basic functionality of the DANC Internet
Step by Step How to Manual
 www.quintewestmaps.com Step by Step How to Manual Click on to accept the disclaimer and go to the web GIS Step by Step Web Based GIS Interface Layout of Web Based GIS Save your Favorite Map Views Link
Estuary Data Viewer User Guide
 1. Introduction 2. Page Layout 3. Navigation Tools 4. Table of Contents Tabs 5. Action Tools 6. System Requirements Estuary Data Viewer User Guide 1. Introduction Welcome to the Estuary Planner Data Viewer.
Juniata County, Pennsylvania
 GIS Parcel Viewer Web Mapping Application Functional Documentation June 21, 2017 Juniata County, Pennsylvania Presented by www.worldviewsolutions.com (804) 767-1870 (phone) (804) 545-0792 (fax) 115 South
Chapter 1 : Getting Started with Integrity... Chapter 2 : Interface Layout... Chapter 3 : Navigation... Chapter 4 : Printing...
 .0 User s Manual Table of Contents Chapter : Getting Started with Integrity... Chapter : Interface Layout... Chapter : Navigation... Chapter : Printing... Chapter : Quick Search and Results Pane... Results
Pre-release User Guide. Version 2.0 August 2015
 Pre-release User Guide Version 2.0 August 2015 Copyright 2015 EagleView Technologies. Copyright 2015 Pictometry International Corp. All rights reserved. No part of this publication may be reproduced, stored
Full Search Map Tab Overview
 FlexMLS Map Server Full Search Map Tab Overview The Full Search Map tab is a need to know module. It is accessible when you use Full Search under Search in the Main Menu tree of FlexMLS. This map can
HBS Training - IT Solutions. PlanWeb. Introduction
 HBS Training - IT Solutions PlanWeb Introduction CONTENTS Logging on to the system...3 The PlanWeb Window...5 The Tool Bar...6 The Status Bar...6 The Map Window...6 The Information Window...7 Changing
1. NJDEP Landscape 3.3 Viewer Interface
 Using the Landscape Project through NJDEP Landscape 3.3 Viewer Google Chrome or Mozilla Firefox are recommended for the use of this app. Navigate to the NJDEP-DFW s Landscape Project web page at www.njfishandwildlife.com/ensp/landscape/
OnCOR Silverlight Viewer Guide
 Getting Around There are many ways to move around the map! The simplest option is to use your mouse in the map area. If you hold the left button down, then click and drag, you can pan the map to a new
St. Joseph County. GIS Department FetchGIS Web Map Tutorial
 St. Joseph County GIS Department FetchGIS Web Map Tutorial 2 Table of Contents Contents Slide #(s) Where to Find the Web Map 3 Disclaimer 4 Turning On and Off Map Layers 5 Searching for Parcels 6 More
Map Viewer User Guide. January 2018
 January 2018 Revision History Map Viewer 3.0.1 Revision Date Author / Reviewer Description of Changes 1 April 6, 2017 RWE Addition of Known Issues, format changes. 2 April 11, 2017 RWE Revision for PROD
4. If you are prompted to enable hardware acceleration to improve performance, click
 Exercise 1a: Creating new points ArcGIS 10 Complexity: Beginner Data Requirement: ArcGIS Tutorial Data Setup About creating new points In this exercise, you will use an aerial photograph to create a new
Page 1 of 16 CONTENTS:
 Page 1 of 16 CONTENTS: HOME-BOX -- (PG.2) o PROPERTY OWNERSHIP o ADDRESS SEARCH o I WANT TO AERIAL IMAGERY AND BASE MAPS -- (PG.2) o IMAGERY WITH LABELS ON/OFF o TOPOGRAPHY ON/OFF o TRANSPARENCY ZOOM IN
Using Syracuse Community Geography s MapSyracuse
 Using Syracuse Community Geography s MapSyracuse MapSyracuse allows the user to create custom maps with the data provided by Syracuse Community Geography. Starting with the basic template provided, you
SAFMC Habitat and Ecosystem Viewer
 SOUTH ATLANTIC FISHERY MANAGEMENT COUNCIL SAFMC Habitat and Ecosystem Viewer Integrating Management Resources This document provides an overview of the SAFMC Habitat and Ecosystem Viewer data sources and
How to...create a Video VBOX Gauge in Inkscape. So you want to create your own gauge? How about a transparent background for those text elements?
 BASIC GAUGE CREATION The Video VBox setup software is capable of using many different image formats for gauge backgrounds, static images, or logos, including Bitmaps, JPEGs, or PNG s. When the software
in the help area and if you click on MapViewer.
 ARCTIC VIEWER INSTRUCTIONS The Arctic Viewer is an Internet mapping application built using ArcIMS by Environmental Systems Research institute (ESRI). The first time you use call up the viewer on your
StickFont Editor v1.01 User Manual. Copyright 2012 NCPlot Software LLC
 StickFont Editor v1.01 User Manual Copyright 2012 NCPlot Software LLC StickFont Editor Manual Table of Contents Welcome... 1 Registering StickFont Editor... 3 Getting Started... 5 Getting Started...
To show toolbars, double-click in the banner at the top or click the tools icon
 8/15/2013 Welcome to Culver City s GIS Property Information Search 2.0. This instructional document provides an overview of most commonly used functionality in this streamlined, enhanced web map application.
for ArcSketch Version 1.1 ArcSketch is a sample extension to ArcGIS. It works with ArcGIS 9.1
 ArcSketch User Guide for ArcSketch Version 1.1 ArcSketch is a sample extension to ArcGIS. It works with ArcGIS 9.1 ArcSketch allows the user to quickly create, or sketch, features in ArcMap using easy-to-use
Fusion. CBR Fusion MLS Level 1 Core Functions. Class Handout
 Fusion 1 CBR Fusion MLS Level 1 Core Functions Class Handout GETTING STARTED IN FUSION Logging On and Off To log on to Fusion MLS: 1. Type your user name in the User ID box. 2. Type your password in the
HBS Training - IT Solutions. PlanWeb. Intermediate
 HBS Training - IT Solutions PlanWeb Intermediate CONTENTS Logging on to the system...3 The PlanWeb Window...5 The Tool Bar...6 The Status Bar...6 The Map Window...6 The Information Window...7 Changing
SMART Meeting Pro PE 4.1 software
 Help us make this document better smarttech.com/feedback/170973 SMART Meeting Pro PE 4.1 software USER S GUIDE Product registration If you register your SMART product, we ll notify you of new features
Location Intelligence Component
 Location Intelligence Component Version 1.0 for Business Objects XI 3.0 USER GUIDE Information in this document is subject to change without notice and does not represent a commitment on the part of the
User Manual. For Geographical Information System. Last Updated: 1-July-2013 Document No. : - 1 Document version: - 1
 User Manual For Geographical Information System Client: Department of Mines and GIS Government of Karnataka Last Updated: 1-July-2013 Document No. : - 1 Document version: - 1 (Geographical Information
SMART Meeting Pro 4.2 personal license USER S GUIDE
 smarttech.com/docfeedback/170973 SMART Meeting Pro 4.2 personal license USER S GUIDE Product registration If you register your SMART product, we ll notify you of new features and software upgrades. Register
SPATIAL DESIGN NETWORK ANALYSIS sdna in QGIS
 SPATIAL DESIGN NETWORK ANALYSIS sdna in QGIS 1 Installing sdna+ as plugin for QGIS... 2 1.1 Download & Install sdna... 2 1.2 Setting up sdna in QGIS... 3 1.3 Open the sdna toolbox... 5 2 sdna in QGIS Processing
Adobe Photoshop Sh S.K. Sublania and Sh. Naresh Chand
 Adobe Photoshop Sh S.K. Sublania and Sh. Naresh Chand Photoshop is the software for image processing. With this you can manipulate your pictures, either scanned or otherwise inserted to a great extant.
MANITOBA LAND USE AND DEVELOPMENT WEB APPLICATION: How-to guide and help document
 MANITOBA LAND USE AND DEVELOPMENT WEB APPLICATION: How-to guide and help document 2 Index Index... 2 Layout & View... 3 Overview... 3 Layers... 4 Municipal Relations Data Layers... 4 Application Toolbar...
Numbers Basics Website:
 Website: http://etc.usf.edu/te/ Numbers is Apple's new spreadsheet application. It is installed as part of the iwork suite, which also includes the word processing program Pages and the presentation program
Insight: Measurement Tool. User Guide
 OMERO Beta v2.2: Measurement Tool User Guide - 1 - October 2007 Insight: Measurement Tool User Guide Open Microscopy Environment: http://www.openmicroscopy.org OMERO Beta v2.2: Measurement Tool User Guide
Explore some of the new functionality in ArcMap 10
 Explore some of the new functionality in ArcMap 10 Scenario In this exercise, imagine you are a GIS analyst working for Old Dominion University. Construction will begin shortly on renovation of the new
Quick Guide to MapWindow GIS Desktop Application
 Quick Guide to MapWindow 1 Quick Guide to MapWindow GIS Desktop Application Version 2 January 2007 Adapted by Tom Croft. This is a summary user guide for commonly used tools and capabilities and does not
Getting Started with the NH Coastal Viewer March, 2015, v0
 Getting Started with the NH Coastal Viewer March, 2015, v0 The NH Coastal Viewer contains a comprehensive user interface with many tools and functions. This document summarizes some of the basic site functionality,
Pictometry for ArcGIS Desktop Local Guide For ArcGIS Desktop Version 10.3
 for ArcGIS Desktop Local Guide For ArcGIS Desktop Version 10.3 June 2015 Copyright 2010-2015 International Corp. All rights reserved. No part of this publication may be reproduced, stored in a retrieval
Reset Cursor Tool Clicking on the Reset Cursor tool will clear all map and tool selections and allow tooltips to be displayed.
 SMS Featured Icons: Mapping Toolbar This document includes a brief description of some of the most commonly used tools in the SMS Desktop Software map window toolbar as well as shows you the toolbar shortcuts
Creating Your Own Map Hawaiian Volcanoes
 Professional Development Workshop on Integrating Geospatial Technology into the HS Classroom Activity 1: Creating Your Own Map Hawaiian Volcanoes In this activity, you'll start a new map and then add the
Google LayOut 2 Help. Contents
 Contents Contents... 1 Welcome to LayOut... 9 What's New in this Release?... 10 Learning LayOut... 12 Technical Support... 14 Welcome to the LayOut Getting Started Guide... 15 Introduction to the LayOut
BASICS OF MOTIONSTUDIO
 EXPERIMENT NO: 1 BASICS OF MOTIONSTUDIO User Interface MotionStudio combines draw, paint and animation in one easy easy-to-use program gram to save time and make work easy. Main Window Main Window is the
MRMLS SmartMap CityGIS5 (More training available at
 MRMLS SmartMap CityGIS5 (More training available at http://www.imrmls.com/centsite/training.html) 3201 W. Temple Ave., Suite 250 Pomona, Ca 91768 800-925-1525 or http://www.imrmls.com/support Last Edited
MapXpress Help Guide. 282 Main Street Ext. - C2 Middletown, CT
 MapXpress Help Guide 282 Main Street Ext. - C2 Middletown, CT 06457 203 404-7129 Table of Contents 1... Navigation Tools 2... Map Layers: Turning On and Off Data Layers 3... Searching By Name, Address,
GIS-BASED SUPPORT FOR IMPLEMENTING POLICIES AND PLANS TO INCREASE ACCESS TO ENERGY SERVICES IN GHANA
 GIS-BASED SUPPORT FOR IMPLEMENTING POLICIES AND PLANS TO INCREASE ACCESS TO ENERGY SERVICES IN GHANA Appendix 3: GEAR Toolkit User Guide and Training Manual March 2012 Francis Kemausuor; Abeeku Brew-Hammond;
Exercise Enumeration Areas
 Exercise Enumeration Areas 2007 In this exercise you will work with an existing file geodatabase and create new enumeration areas within the established larger census area maintaining geographic integrity
Parkland County s Public Interactive Mapping Application USER MANUAL
 Parkland County s Public Interactive Mapping Application USER MANUAL Geographic Information Systems Discover Parkland v3.0 Updated: January 2017 Table of Contents I. Welcome to v3.0... 3 II. Discover Parkland
Geocortex HTML 5 Viewer Manual
 Geocortex HTML 5 Viewer Manual Searching for a feature Use the Search Feature box in the top right hand corner of the viewer window. You can use this to search numerous data types such as property number,
Viewing the Data 3 Turning Layers On / Off 4 Navigation Toolbar 5 Layout Toolbar 7 Identify Tool 8 Find Tool 10 Measure Tool 12 Go To XY Tool 14
 1 Viewing the Data 3 Turning Layers On / Off 4 Navigation Toolbar 5 Layout Toolbar 7 Identify Tool 8 Find Tool 10 Measure Tool 12 Go To XY Tool 14 Transparency Tool 16 Markup Tools 19 ArcMap Markup Tools
WAIPA DISTRICT COUNCIL. Maps Online 9. Updated January This document contains an overview of IntraMaps/Maps Online version 9.
 WAIPA DISTRICT COUNCIL Maps Online 9 Updated January 2018 This document contains an overview of IntraMaps/Maps Online version 9.0 Contents Starting Maps Online... 3 Menu Bar... 4 Tools... 5 View Tab...
COMMISSION OF TEXAS MAY
 GIS Viewer RAILROAD COMMISSION OF TEXAS MAY 2017 Table of Contents GIS Viewer Basics... 1 Basics... 1 Screen Overview... 2 Tools... 5 Visibility... 5 Measure Tool... 7 Identify Tool... 10 Coordinates Tool...
OS OpenData masterclass 2013 Cartographic Design workshop
 OS OpenData masterclass 2013 Cartographic Design workshop 1 Quantum GIS Quantum GIS (QGIS) is a user-friendly Open Source Geographic Information System (GIS,) licensed under the GNU General Public License.
Landscape Analysis Tool User Guide
 April 2013 Revision History Version Date Author Description August 25, 2010 Vendor First version August 27, 2010 Vendor Updates to screenshots November 23, 2010 Vendor Appendix A - Introduction o Shapefile
MapInfo Location Intelligence Component
 MapInfo Location Intelligence Component version 1.1 for MicroStrategy USER GUIDE Information in this document is subject to change without notice and does not represent a commitment on the part of the
ENVI Tutorial: Map Composition
 ENVI Tutorial: Map Composition Table of Contents OVERVIEW OF THIS TUTORIAL...3 MAP COMPOSITION IN ENVI...4 Open and Display Landsat TM Data...4 Build the QuickMap Template...4 MAP ELEMENTS...6 Adding Virtual
Guide to Bruce County Maps (Public) January 2018
 January 2018") Guide to Bruce County Maps (Public) January 2018 For any unanswered questions about Bruce County Maps not covered by this document, please contact Justin Kraemer at gis@brucecounty.on.ca or phone 519-534-2092
Guide to Bruce County Maps (Public) January 2018 For any unanswered questions about Bruce County Maps not covered by this document, please contact Justin Kraemer at gis@brucecounty.on.ca or phone 519-534-2092
Add notes to a document
 Add notes to a document WX and AX Add notes to a document ApplicationXtender Web Access (WX) and ApplicationXtender Document Manager (AX) In ApplicationXtender, you can mark up a document using the annotation
Using Mapmaker s Toolkit. In this tutorial, you will learn the following basic elements of Mapmaker s Toolkit:
 Using Mapmaker s Toolkit Mapmaker s Toolkit is a useful piece of software that allows you and your students to create customized physical, cultural and historical maps of hundreds of countries, states
REDI 5.0 User Manual
 REDI 5.0 User Manual OBJECTIVE: REDI (Regional Economic Development Information System) provides a quick, convenient and easy way of accessing the City of San Diego Business Incentive Zones (BIZ) information.
Creating and editing vector maps
 Software PHOTOMOD Module PHOTOMOD VectOr Creating and editing vector maps Racurs, Moscow, 2009 PHOTOMOD CONTENTS 1. GENERAL PURPOSE OF VECTOR MAP EDITOR... 3 2. VECTOR MAP EDITOR MANAGING.... 3 3. ADDING
OnBase - EDM Services (Electronic Document Management Services)
") OnBase - EDM Services (Electronic Document Management Services) Overview EDM Services contains the following features: EDM Briefcase Prerequisites The EDM Briefcase allows you to: Document Templates Image
OnBase - EDM Services (Electronic Document Management Services) Overview EDM Services contains the following features: EDM Briefcase Prerequisites The EDM Briefcase allows you to: Document Templates Image
Tutorial Introduction to the Display Interface I N T R D I S P L A Y. TNTmips TNTedit. page 1. TNTview
 I N T R 0 D I S P L A Y Tutorial Introduction to the Display Interface Introduction to the Display Interface in TNTmips TNTedit page 1 TNTview Before Getting Started The geospatial Display process is common
USING DATA DRIVEN PAGES
 USING DATA DRIVEN PAGES Mid-West ESRI Utility User s Group Conference March 26, 2014 Presented by: Hillary Bjorstrom, GIS Analyst STAR Energy Services LLC Alexandria, Minnesota EXERCISE 1 CREATING A GRID
VIMED JWEB Manual. Victorian Stroke Telemedicine. Version: 1.0. Created by: Grant Stephens. Page 1 of 17
 VIMED JWEB Manual Victorian Stroke Telemedicine Version: 1.0 Created by: Grant Stephens Page 1 of 17 1 Table of Contents 1 Table of Contents... 2 2 What is JWEB?... 4 3 Accessing JWEB... 4 3.1 For Mac
Map Viewer User Guide
 Map Viewer User Guide Sea Level Scenario Sketch Planning Tool Version 2, 2017 University of Florida GeoPlan Center Introduction The purpose of this document is to guide users on how to use the Sea Level
How to use the DuPage County Parcel Viewer Interactive Web Mapping Application.
 How to use the DuPage County Parcel Viewer Interactive Web Mapping Application. Parcel Viewer URL: URL: http://gis.dupageco.org/parcelviewer/ Initial View (And frequently asked questions) Parcel Search
ENERGY WEB ATLAS WEB APPLICATION USER GUIDE. ENERGY WEB ATLAS All materials subject to strictly enforced copyright laws Gulf Publishing Company 1
 ENERGY WEB ATLAS WEB APPLICATION USER GUIDE ENERGY WEB ATLAS All materials subject to strictly enforced copyright laws Gulf Publishing Company 1 WELCOME Welcome to the Energy Web Atlas User Guide. Choose
Using the Markup Commands
 Using SoftPlan review 1 Using the Markup Commands The Markup menu supplies various commands that allow you to add changes, comments, and suggestions to a drawing or to specific areas of a drawing. To open
Pictometry for ArcGIS Desktop Local Guide For ArcGIS Desktop Version 10
 Pictometry for ArcGIS Desktop Local Guide For ArcGIS Desktop Version 10 September 2013 Copyright 2010-2013 Pictometry International Corp. All rights reserved. No part of this publication may be reproduced,
Table of Contents Website Layout Website Tools
 Help Dialogue Welcome to the Vanderburgh County Assessor s Web Map! This website is a very useful resource for searching and research on properties within Vanderburgh County, Indiana. This help dialogue
v Introduction to WMS WMS 11.0 Tutorial Become familiar with the WMS interface Prerequisite Tutorials None Required Components Data Map
 s v. 11.0 WMS 11.0 Tutorial Become familiar with the WMS interface Objectives Import files into WMS and change modules and display options to become familiar with the WMS interface. Prerequisite Tutorials
GETTING STARTED TABLE OF CONTENTS
 Sketchup Tutorial GETTING STARTED Sketchup is a 3D modeling program that can be used to create 3D objects in a 2D environment. Whether you plan to model for 3D printing or for other purposes, Sketchup
v Overview SMS Tutorials Prerequisites Requirements Time Objectives
 v. 12.2 SMS 12.2 Tutorial Overview Objectives This tutorial describes the major components of the SMS interface and gives a brief introduction to the different SMS modules. Ideally, this tutorial should
Geographical Information Systems Institute. Center for Geographic Analysis, Harvard University. LAB EXERCISE 1: Basic Mapping in ArcMap
 Harvard University Introduction to ArcMap Geographical Information Systems Institute Center for Geographic Analysis, Harvard University LAB EXERCISE 1: Basic Mapping in ArcMap Individual files (lab instructions,
Add notes to a document
 Add notes to a document WX and AX Add notes to a document Web Access (WX) and Document Manager (AX) In, you can mark up a document using the annotation toolbar. With these tools, you are able to add typewritten
Newaygo County Web Map
 Newaygo County Web Map Address/Parcel/Parcel Owner Search Map Overview Zoom Back to default extent Use your current location if allowable Widget Panel At the top of the map is a search function used for
MapInfo Stratus. Version 41. MapInfo Stratus Administration Guide
 MapInfo Stratus Version 41 MapInfo Stratus Administration Guide Contents Chapter 1: Getting Started...7 Signing In and Out...8 Home...8 Version Number and Build Number...9 Using MapInfo Stratus Administration
EUROSTAT STATISTICAL ATLAS GUIDE
 EUROSTAT STATISTICAL ATLAS GUIDE (LAST UPDATED 07/10/2015) DESCRIPTION The Eurostat Statistical Atlas has been designed to visualise statistical data. It currently contains the statistical data covered
Name: Date: June 27th, 2011 GIS Boot Camps For Educators Lecture_3
 Name: Date: June 27th, 2011 GIS Boot Camps For Educators Lecture_3 Practical: Creating and Editing Shapefiles Using Straight, AutoComplete and Cut Polygon Tools Use ArcCatalog to copy data files from: