Launch QGIS. Launch QGIS from. Open window Quantum GIS (Figure 1.1 below) Start All Programs Quantum GIS. QGISIcon on the desk top
|
|
|
- Julianna Miller
- 6 years ago
- Views:
Transcription
1 QGIS
2 Launch QGIS Launch QGIS from Start All Programs Quantum GIS OR QGISIcon on the desk top Open window Quantum GIS (Figure 1.1 below) 2
3 Figure 1.1 3
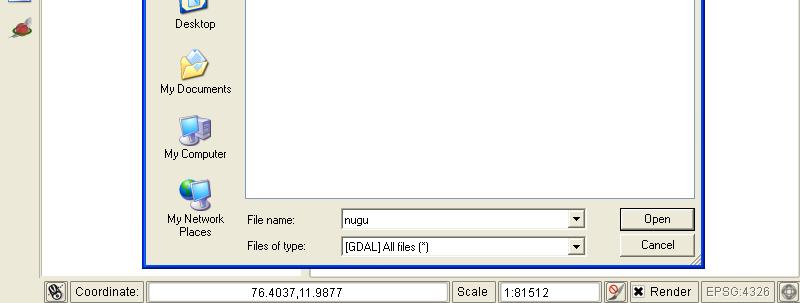
4 Opening Raster For this exercise we demonstrate three types of GIS data point line polygon. These require geo-referenced base data. Such base data could be in the form of Topo sheets Cadastral maps (village maps) Remote sensed images eg., Google earth images, IRS data, LANDSAT data. The accompanying CD provides a registered image named nugu.tif. Open this file by selecting Add Raster Layer icon (Figure 1.2) 4

5 Figure 1.2 5
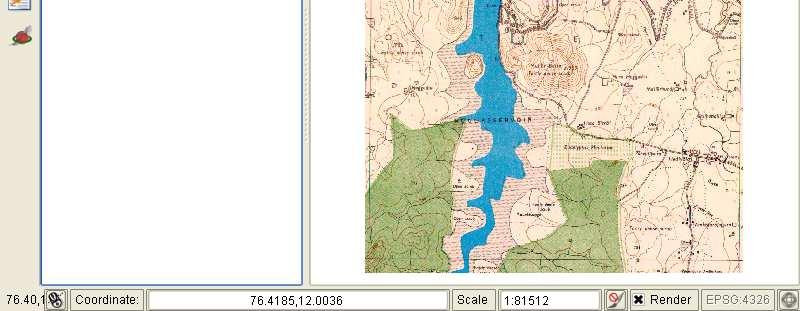
6 Opening Raster Open a GDAL Supported Raster Data Source window opens (Figure 1.3) Select nugu.tif and select Open (Figure 1.3) Observe the nugu.tif opened in the window (Figure 1.4 ) 6

7 Figure 1.3 7
8 Figure 1.4 8
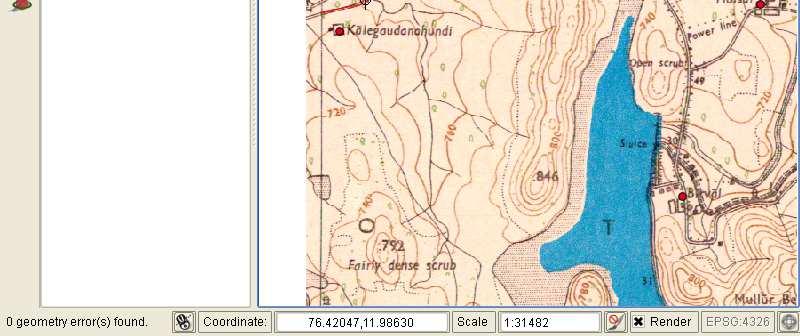
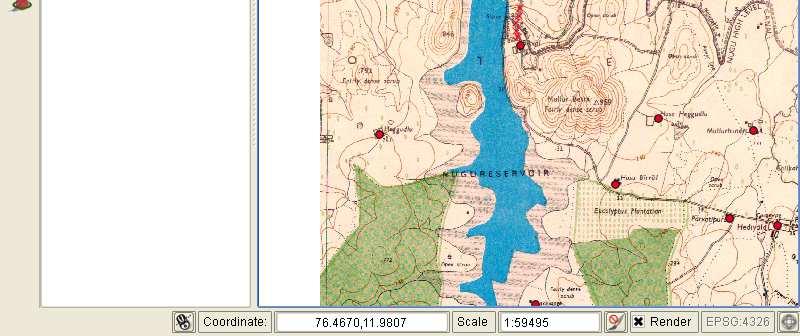
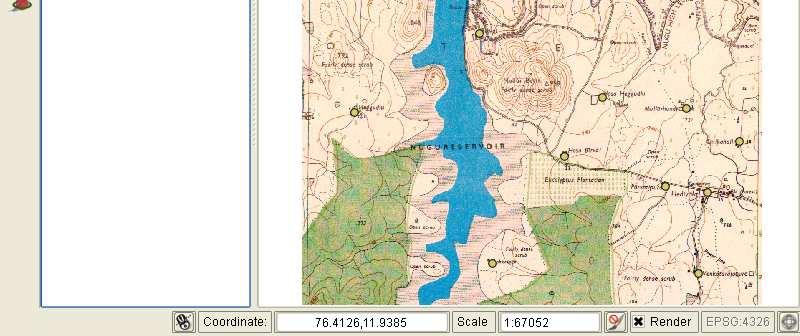
9 Verifying geo-referencing The opened raster file is geo-referenced To confirm the geo-referencing move the cursor on the opened map; coordinates change in the coordinate window at the bottom of the screen (Figure 1.5) 9
10 Figure
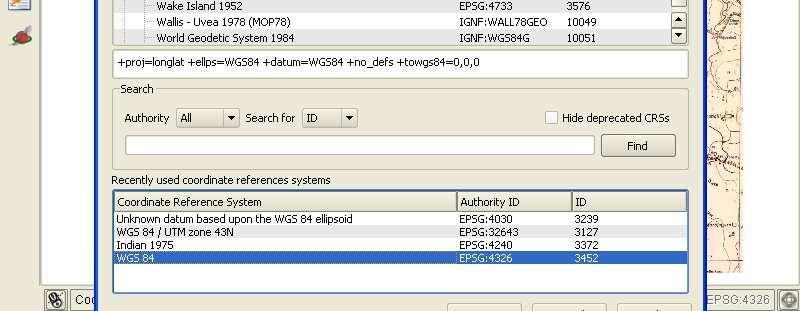
11 Creation of Vector Point Data To create a new point layer select the icon New Shapefile Layer (Figure 1.6) Step 1 A window pops up titled Coordinate Reference System Selector (Figure 1.7) Select as the coordinate reference system WGS 84 (Figure 1.7) SelectOK A window titled New Vector Layer is displayed (Figure 1.8) 11

12 Figure

13 Figure

14 Figure
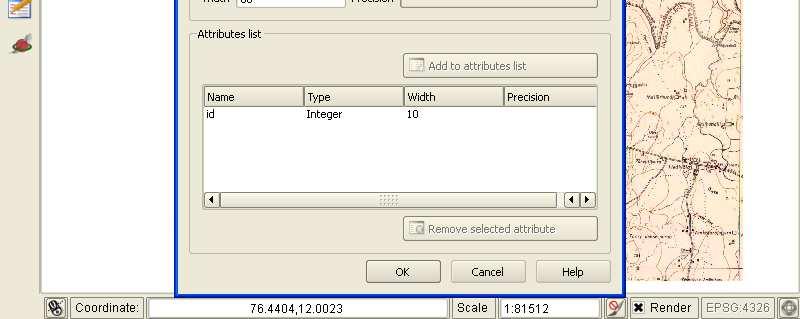
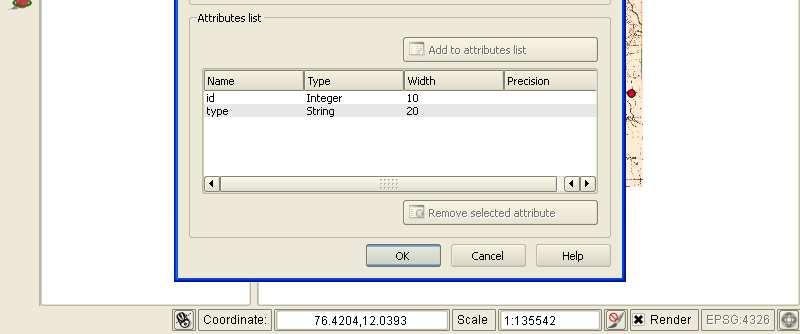
15 Creation of Vector Point Data In Figure 1.8 select option Type and then arro Point We need to add attributes next. This step requires planning in detail For eg., an anti- poaching camp can have the attributes: 1. Number of staff 2. Number of GPS etc Next create layer of villages with attributes such as: 1. Name 2. Taluk 3. District 4. Population 15
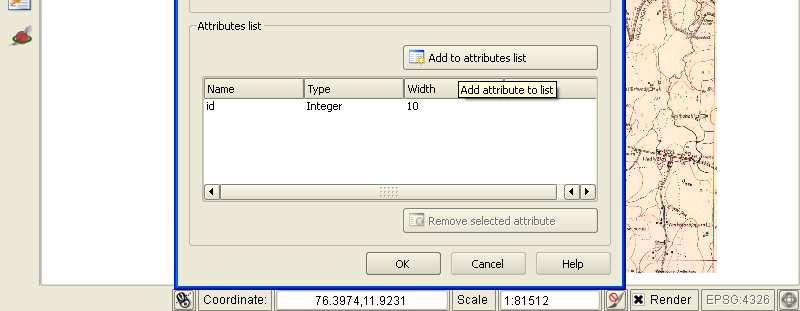
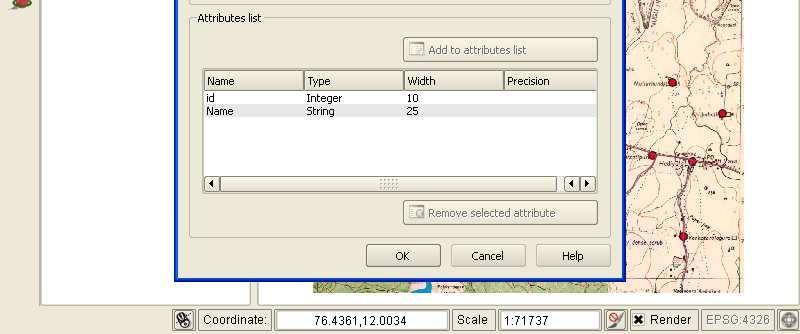
16 Creation of Vector Point Data In the same window note thenewattribute box: it has attributes of Name, Type, Width and Precision Step 2 Add new attributes (Figure 1.9) Name: village Type: text Width: 40 (this is subjective decision as place names are generally within 40 characters) Come to Attribute List box (Figure 1.9) Select Add to attribute list 16

17 Figure
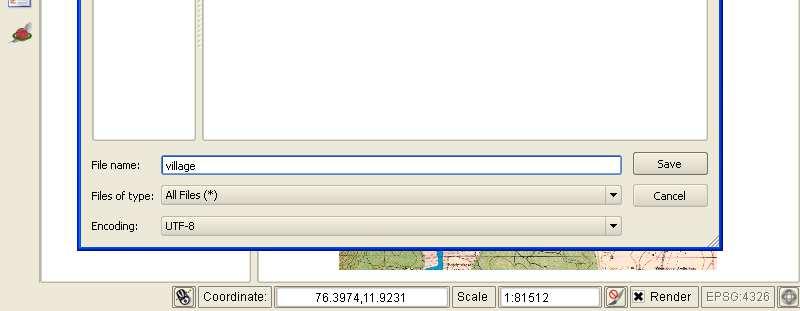
18 Creation of Vector Point Data Add taluk and district data in village attributes by repeatingstep 2 Add population data: to do this, we need to set Type of data in whole number (Figure 1.10) repeatstep2(figure 1.11) After this select OK (Figure 1.11) You will be guided to thesaveas window. Select the directory in which you would like to save the data. For this example name it as Village (Figure 1.12) Select Save. 18

19 Figure

20 Figure

21 Figure
22 Creation of Vector Point Data On saving, layer is stored in specified folder This layer is automatically added to the QGIS window. (Figure 1.13) 22

23 Figure
24 Creation of Vector Point Data Next, add villages (features) to the village layer To do this the layer has to be made editable Step 3 Select the layer and then select Toggle editing icon (Figure 1.14) On enabling, in the layer window, the toggle active icon is enabled (Figure 1.15) On its enabling, other icons related next to Toggle editing icon are also activated (Figure 1.15) 24

25 Figure

26 Figure
27 Creation of vector point data 27
28 Creation of Vector Point Data Select the icon of Zoom In. Now zoom to the area of interest by (Figure 1.16) Place the (Figure 1.17) on the interested area and click We have zoomed to the area (Figure 1.18) Select the icon Capture point (Figure 1.18) 28

29 Figure
30 Figure

31 Figure
32 Figure
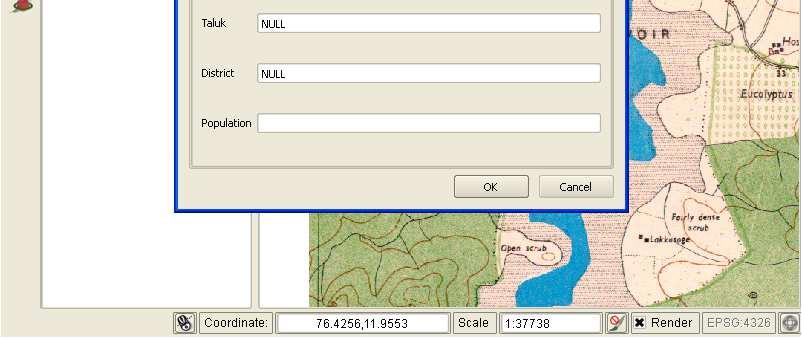
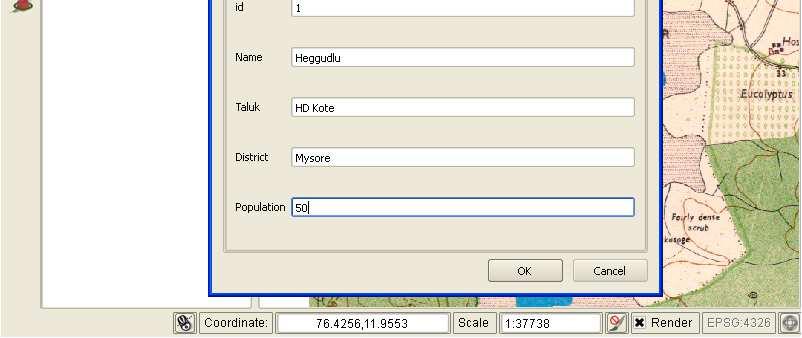
33 Step 4 Creation of Vector Point Data Place the on the village selected and right click (Figure 1.19) A window with title Attributes is opened (Figure 1.20) Enter the values for different attributes (Figure 1.21) Id(default): 1 Name(as in the topo-sheet): Heggudlu Taluk: HD Kote District: Mysore Population(from census): 50 Select OK (Figure 1.21) 33

34 Figure

35 Figure
36 Creation of Vector Point Data Notice marked village can be seen on the map (Figure 1.22) RepeatStep4(see page 34) Finally a map with villages in the Nugu is displayed (Figure 1.23) 36

37 Figure
38 Figure
39 Creation of vector line data 39
40 Creation of vector line data - road To create new line layer select the icon New shape layer (Figure 1.6, page 11) CompleteStep1(page 10) As in Figure 1.8 where under Type, point was selected, select Line (Figure 1.24) Next we need to add attributes (Figure 1.24) Attributes associated Typeoftheroad After this step, selectok (Figure 1.24) 40

41 Figure
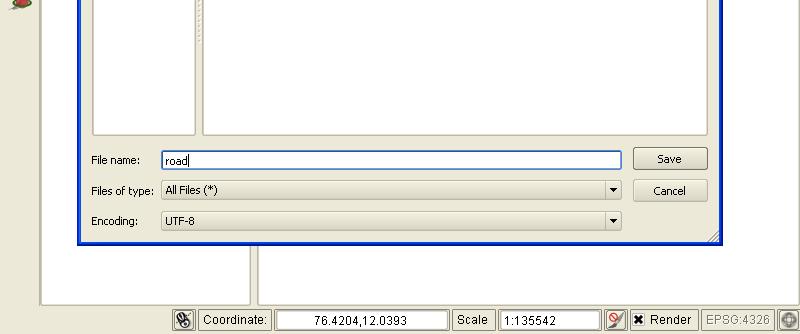
42 Creation of vector line data You will be guided to Save as window as previously done in Figure 1.12 (page 20) Select the directory in which you would like to save the data. In this example name it as road (Figure 1.25) Select Save; on saving, layer is stored in specified folder (Figure 1.25 ) This layer is automatically added to the QGIS window (Figure 1.26) 42

43 Figure
44 Figure
45 Creation of vector line data Next we need to add roads (features) to the road layer. To do this we have to make this layer editable. Select the layer and then select Toggle editing icon (Figure 1.27) On enabling, in the layer window, the Toggle active icon is enabled 45
46 Figure
47 Creation of vector line data Zoom to the area of interest by selecting the icon ofzoomin (as in Figure 1.16, page 27) Then place the on the interested area and click (as in Figure 1.17, page 28) Step 5 We have zoomed to the area (Figure 1.28) Select the icon Capture Line (Figure 1.28) Place marker on road that we have to digitize and left click (Figure 1.29) 47
48 Figure
49 Figure
50 Creation of vector line data Place the marker to next position and left click (Figure 1.30) Repeat the same process till the next junction (for e.g., change in direction is required) Similarly, continue till where you would like to end the process, right click. A window with title Attributes is opened (Figure 1.31) Enter the information for different attributes (Figure 1.31) Id(default): 1 Type:Mud road Select OK (Figure 1.31) 50

51 Figure

52 Figure
53 Creation of vector line data We can notice digitized road can be seen on the map (see Figure 1.32) (end ofstep5) Before starting the next segment, to avoid the problems of a) undershoot and b) dangles, we need to enable snapping option. To enable snapping: Setting (see Figure 1.33) Snapping option a) undershoot b) dangles 53

54 Figure

55 Figure
56 Creation of vector line data A window of Snapping options appears (Figure 1.34) Select the layer roads, (Figure 1.34) Mode to vertex Tolerance (this is a subjective decision) Units map units Select OK (Figure 1.34) Repeat Step 5 till all roads are digitized (Figure 1.35) and remove the Toggle editing Save the layer (Figure 1.36) 56

57 Figure

58 Figure
59 Figure
60 Creation of vector line data Finally we need to disable snapping option Select Setting Snapping options unselect road layer (See Figure 1. 37) 60

61 Figure

62 Creation of vector line data 62
63 Creation of vector polygon data 63
64 Creation of vector polygon data - Waterbody To create new polygon layer select the icon New shape layer (Figure 1.6, page 11) and complete Step1 As in Figure 1.8, (page 13) and Figure 1.24 (page 39) where point and line was selected respectively, select Type as Polygon (Figure 1.38) Next we need to add attributes (see Figure 1.38) Name After this step, selectok (Figure 1.38) 64

65 Figure
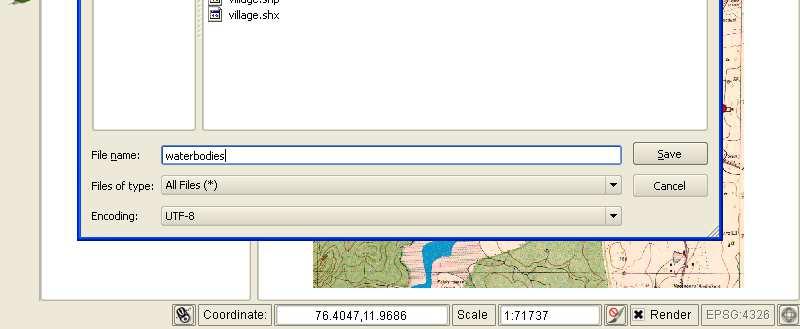
66 Creation of vector polygon data You will be guided to Save as window as previously done in Figure 1.12 (page 20) Select the directory in which you would like to save the data. In this example name it as waterbody (Figure 1.39) SelectSave ( Figure 1.39 ) On saving, layer is stored in specified folder This layer is automatically added to the QGIS window ( Figure 1.40) 66

67 Figure

68 Figure
69 Creation of vector polygon data Next we need to add water bodies (features) to the waterbodies layer. To do this we have to make this layer editable. Select the layer and then select Toggle editing icon (Figure 1.41) On enabling, in the layer window, the Toggle active icon is enabled 69

70 Figure
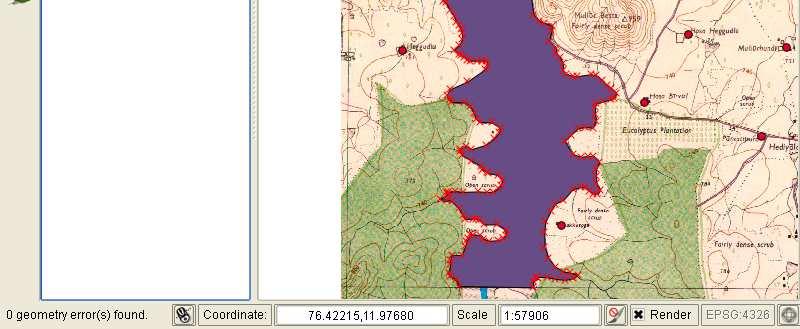
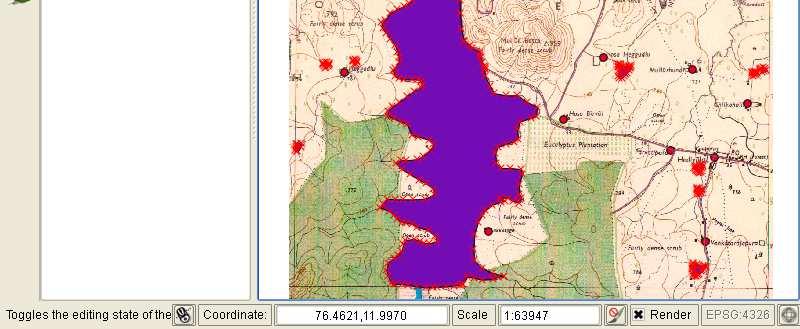
71 Creation of vector polygon data Select the area of interest and zoom if required by selecting the icon ofzoomin (as in Figure 1.16 to 1.18 pages 27 to 29) Then place the on the interested area and leftclick (as in Figure 1.17 page 28) Step 6 We have zoomed to the area (Figure 1.42) Select the icon Capture Polygon (Figure 1.42) Place marker on boundary of water body that we have to digitize andleftclick (Figure 1.43) 71

72 Figure

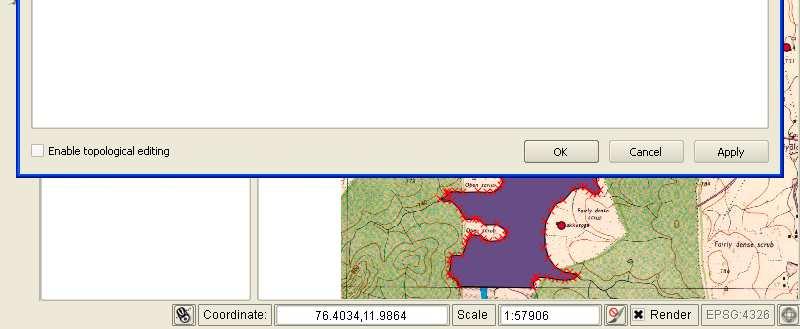
73 Figure
74 Creation of vector polygon data Place the marker to next position and left click (Figure 1.44) Repeat the same process till we complete the polygon and right click Note: if the viewing window covers only some portion of the area, then use up arrow key for scrolling up or down-arrow key or side way arrow keys ( / ) for required scrolling 74
75 Figure
76 Creation of vector polygon data A window with title Attributes is opened (Figure 1.45) Enter the values for different attributes (Figure 1.45) Id(default): 1 name: Nugu Select OK (Figure 1.45) 76

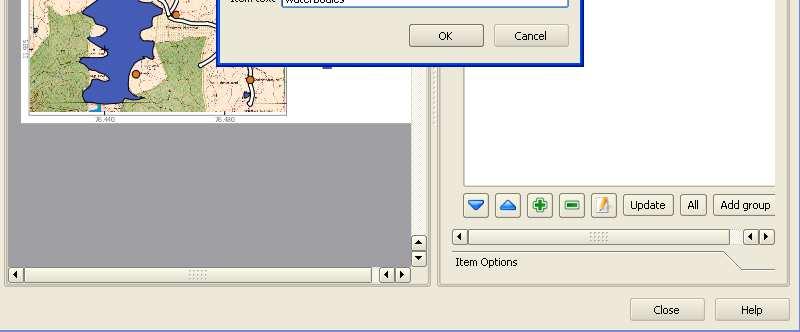
77 Figure
78 Creation of vector polygon data We can see digitized waterbody on the map (Figure 1.46) (end of Step 6) Note: If another polygon is adjacent to the digitized polygon, we need to enable snapping option to avoid the problems of a) overlapping area and b) slivers To enable snapping: Setting Snapping option (as in Figure 1.33, page 53) a) overlapping b) slivers 78

79 Figure
80 Creation of vector polygon data A window of Snapping options appears (Figure 1.47) Select the layer waterbodies, (Figure 1.47) Mode to vertex and segment Tolerance (this is a subjective decision) Units map units Select OK (Figure 1.47) Repeat Step 6 till all water bodies are digitized (Figure 1.48) Remove the Toggle editing and Save the layer (Figure 1.49) 80

81 Figure
82 Figure

83 Figure
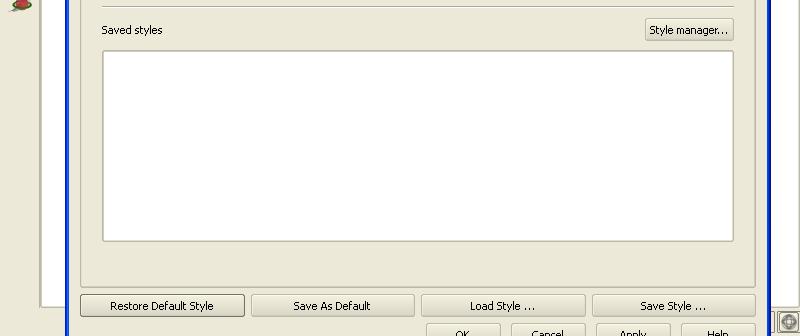
84 Creation of vector polygon data Finally we need to disable snapping option Select: Setting Snapping options whitunselect waterbodies (Figure 1.50) The final output is ready (Figure 1.51) 84
85 Figure
86 Figure
87 Coloring themes 87
88 Coloring themes Steps to be followed Appropriate Colors to depict the theme For example, Forests: Use green shades Roads: Use brown shades Waterbodies: Use blue shades Fence: Use black shades 88
89 Organizing layers in hierarchy Before Coloring layers organize the layers in the order of point, line and polygon features (Figure 1.52) Select concerned layer and drag it up or down 89

90 Figure
91 Point Style Step 7 To change the color of point data,doubleclick on the point data (village layer). Layer properties window opens (Figure 1.53) EndStep7 Layer properties has various tabs: Style, Labels, Fields, General, Metadata, Actions, Joins and Diagram (Figure 1.53) 91
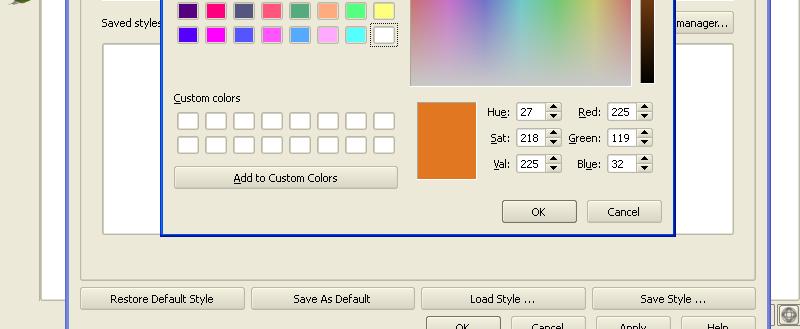
92 Step 8 Point Style Select Style (Figure 1.53) In style we can changecolor,size,unit, etc. Let us change the color Select Change (Figure 1.54) Select Color window opens (Figure 1.55) Select Color by placing + on the selected Color, the selectok (Figure 1.56 ) EndStep8 92

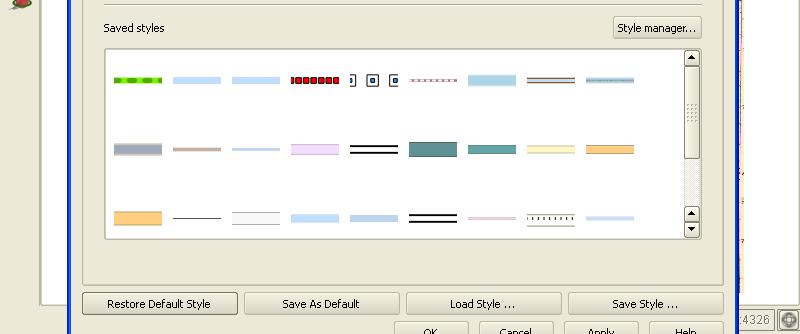
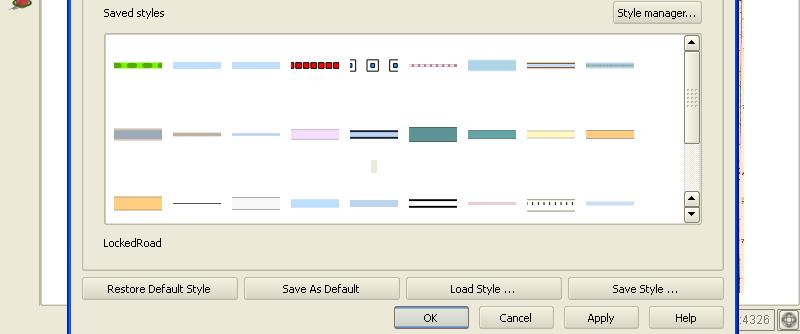
93 Figure
94 Figure
95 Figure

96 Figure
97 Point Style In the layer properties we can notice color has changed (Figure 1.57) Select OK (Figure 1.57) Color change can be noticed in the village layer (Figure 1.58) 97

98 Figure

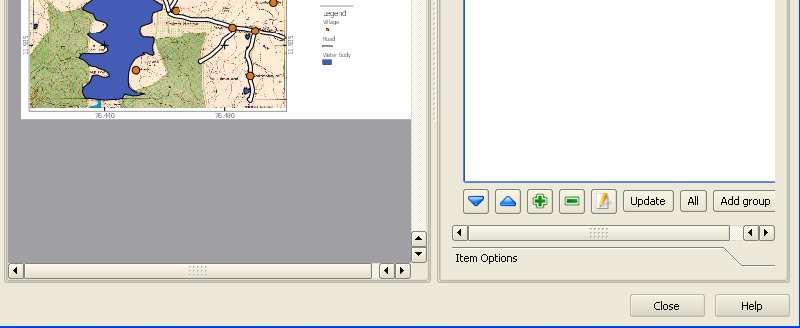
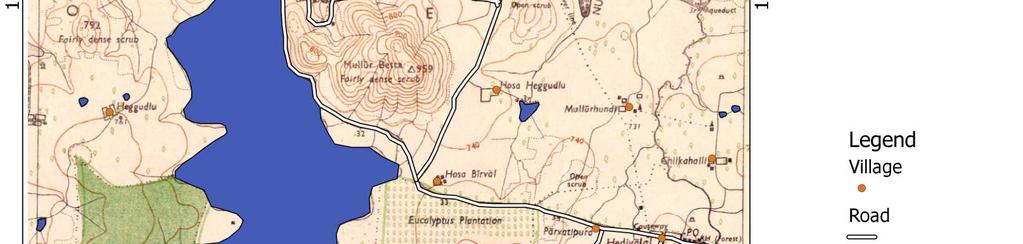
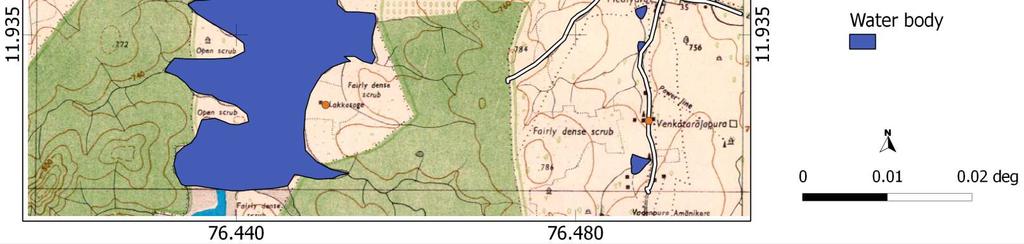
99 Figure
100 Line Style To change the color of road follow Step 7 (page 89) Layer Properties window opens (Figure 1.59) Select from saved styles an symbol appropriated for roads, and even set width appropriately (Figure 1.60) Select OK (Figure 1.60) 100

101 Figure

102 Figure
103 Polygon Style To change the color of polygon follow Step 7 (page 89) Follow Step 8, (page 90) and we get an output as in Figure
104 Figure

105 Map composer 105
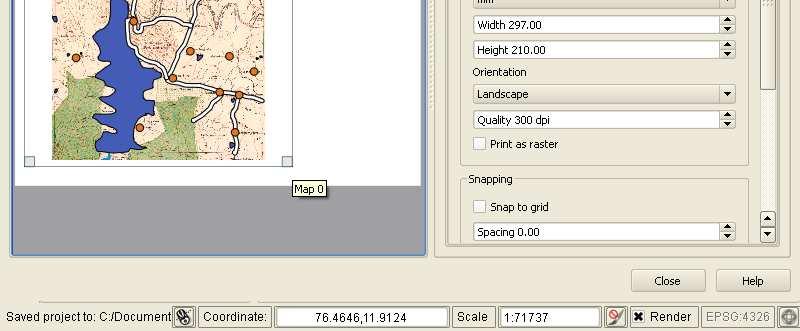
106 Composition of Map A output map should have Scale Legend North Arrow Grid (with coordinates) To create map select New Print Composer (Figure 2.1) The Composer opens (Figure 2.2) Composer has the buttons, General, Item and Command history (Figure 2.2) 106
107 Figure

108 Figure
109 Adding a new map SelectAddnewmap (Figure 2.3) After selection, drag on the canvas byleftclick of arrow. (Figure 2.4) On releasing the finger from left button of mouse, a map with various layers appears in the QGIS display window. (Figure 2.5) 109

110 Figure 2.3 Canvas 110


111 Figure

112 Figure
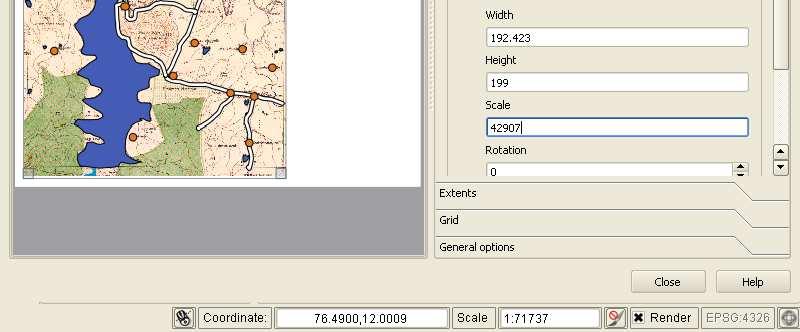
113 Adjusting the map In Figure 2.5 the complete display area is not used by the map; to change this select Item (Figure 2.6) By selecting either Width, Height or Scale the map can use the complete display area For now, let us select Scale (Figure 2.6) Change Scale value to appropriate values (Figure 2.7) Then select Grid(Figure 2.7) 113

114 Figure

115 Figure
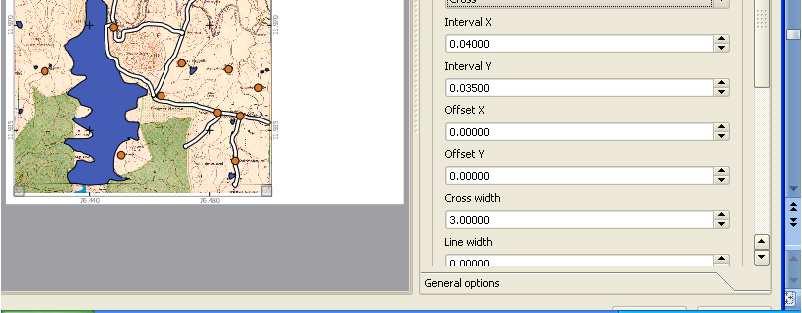
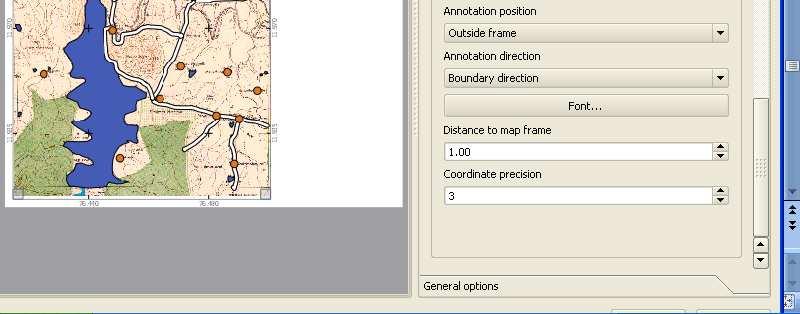
116 Grid creation Select Show Grid (Figure 2.8) Enter appropriate values (Figure 2.8) IntervalX:0.04 Interval Y: Scroll down (Figure 2.9) Select Draw annotation (Figure 2.9) Change Annotation Position and Annotation direction appropriately (Figure 2.9) * * These are subjective decisions and dependent on the projection system used. 116

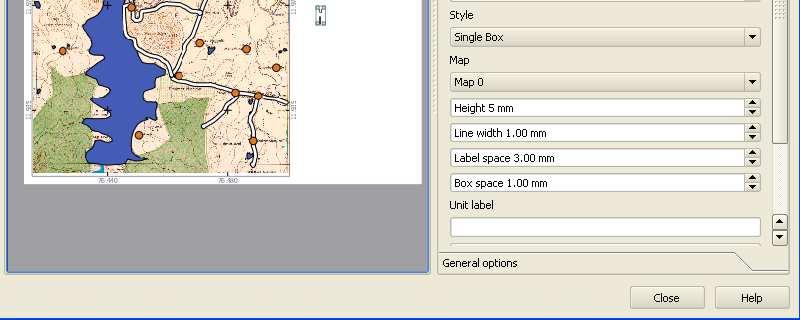
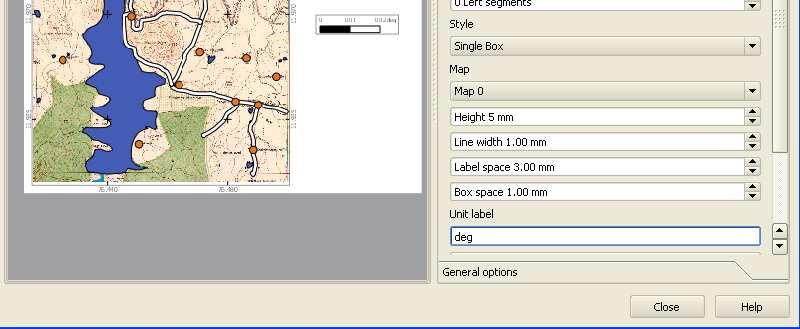
117 Figure

118 Figure
119 Adding North Arrow Next add a north arrow. Select (Figure 2.10) Add Image Left click on the canvas, a window appears, and in the Item window various images are displayed (Figure 2.11) Scroll down till we get the appropriate North arrow image (Figure 2.12) In the Item General options de-select Show frames (Figure 2.12 and Figure 2.13) 119

120 Figure

121 Figure

122 Figure

123 Figure
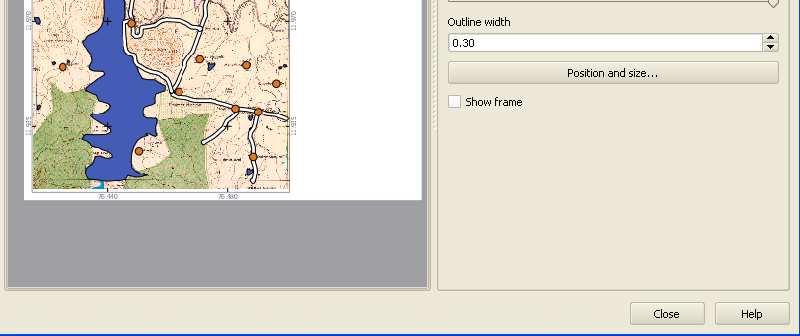
124 Adding Scale bar Next add scale to the map (Figure 2.14) Add new scale bar Leftclick on canvas, a window appears. In theitem window Scale bar tab is displayed (Figure 2.15) Enter appropriate values* (Figure 2.16) Segment size: 0.01 Mapunitsperbar: 1 Unit label: deg In the Item General options de-select Show frames (as in Figure 2.12 and Figure 2.13) * These are subjective decisions and dependent on the projection system used. 124

125 Figure

126 Figure

127 Figure
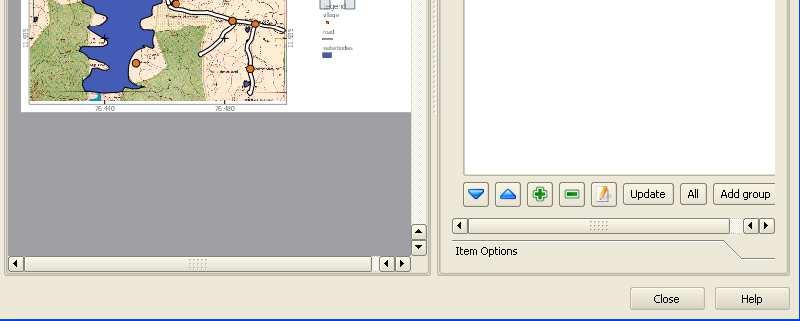
128 Adding Legend The final step is to add a legend, select new vect legend Add Left click on the canvas, a window appears, and in the Item window General tab is displayed (Figure 2.18) Select Legend items (Figure 2.18) Legend items tab opens (Figure 2.19) 128

129 Figure

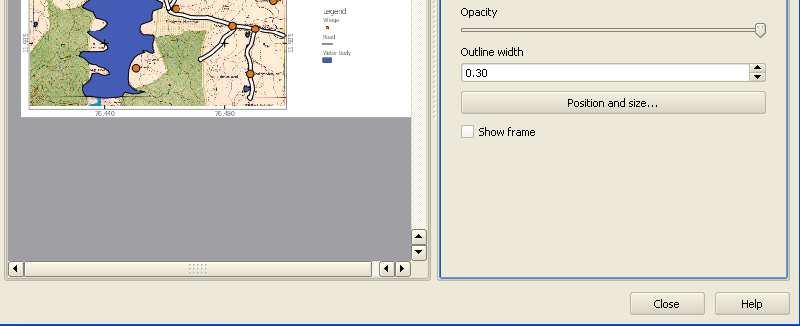
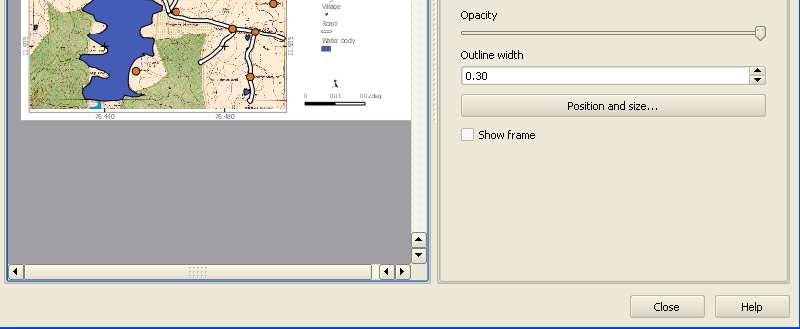
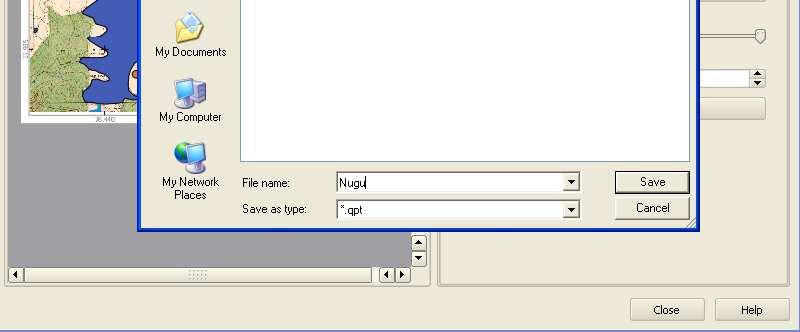
130 Figure
131 Customising Legend To remove unnecessary items from legend Select nugu and select (Figure 2.19) To modify legend items Select Items and select Legend items (Figure 2.20) In Legend items window select the Layer and select the icon resembling editing ( Figure 2.20 ) A Legend item properties window opens (Figure 2.21) In Item text rename if required; then select OK (Figure 2.22) For rest of the layers, repeat the process described in Figures 20, 21 and 22, if required (Figure 2.23) 131
132 Figure

133 Figure

134 Figure

135 Figure

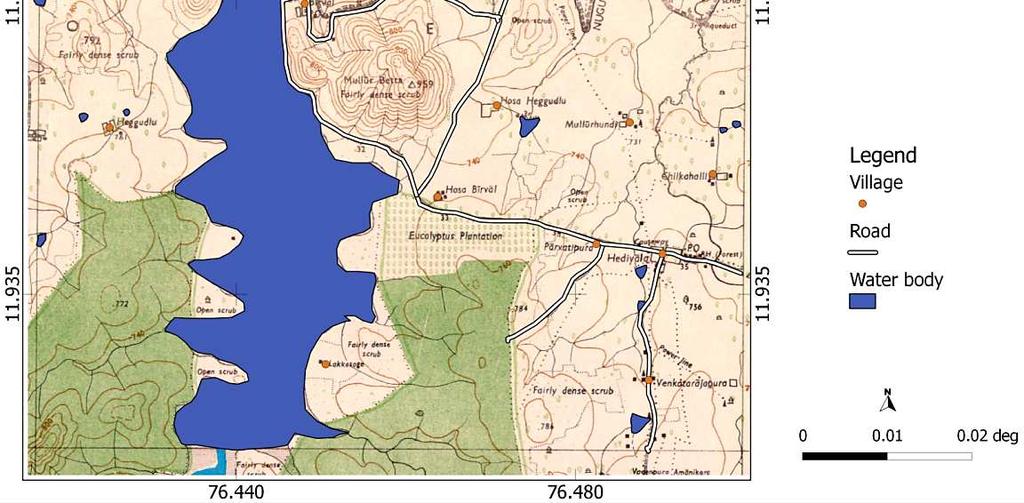
136 Figure
137 Customising Map window In the Item Item options de-select Showframes as in Figure 2.12, page 17 (Figure 2.24) Finally, all the required elements are placed on the canvas; rearrange the same to convey the message in a elegant way (Figure 2.25) Save the composer window by selecting Save as template (Figure 2.26) The Save template window opens, enter the file name Nugu and selectsave ( Figure 2.27 ) 137

138 Figure

139 Figure

140 Figure

141 Figure
142 Output options To take output we have: Export as Image Export as PDF Export as SVG Give a Print 142

143 The final map 143


144 Data from Field to GPS to QGIS
145 Importing GPS data to GPS TrackMarker To import the data from GPS to QGIS, the following steps are involved: Running GPS TrackMarker Connecting the GPS to the system Importing the data to GPS TrackMarker Saving it as GPX format. 145
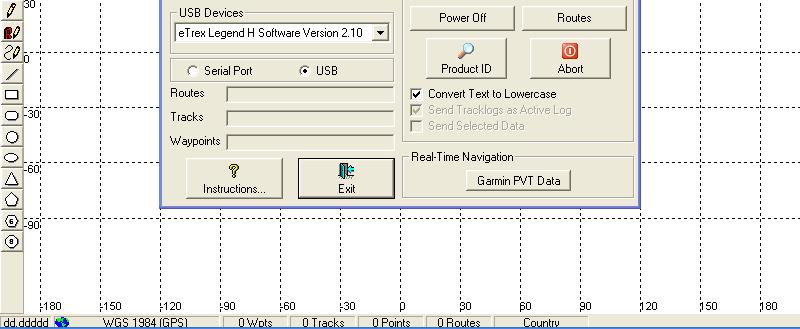
146 Importing GPS data to GPS TrackMarker Run GPS TrackMarker from Program file Connect and turn on the GPS GPS TrackMarker window opens (Figure 3.1) Select: GPS option (Figure 3.1) A dropdown window having various makes of GPS appears (Figure 3.2) Select the Garmin interface (Figure 3.3) 146

147 Figure
148 Figure
149 Figure
150 Importing GPS data to GPS TrackMarker Garmin Interface window opens (Figure 3.4) Note: Window gives information on the device connected (e.g., etrex Legend), and the mode of connection as USB (Figure 3.4) Select Capture ALL* (Figure 3.5) Fields get flooded with the values Select EXIT (Figure 3.6) * During the field work if only Waypoints or Tracks were collected please select Waypoints or Tracks respectively rather than ALL 150

151 Figure
152 Figure

153 Figure
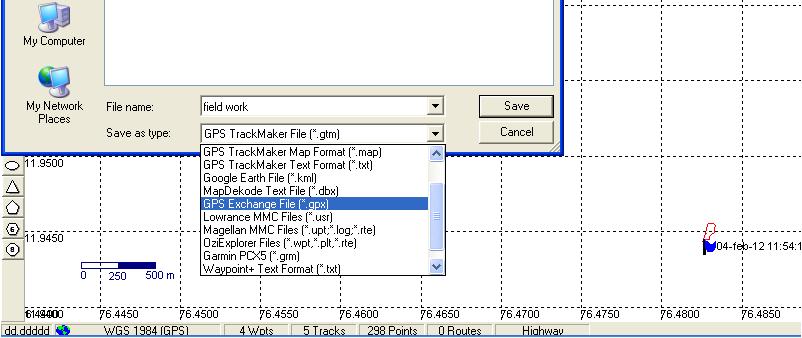
154 Importing GPS data to GPS The output is displayed in the window (Figure 3.7) Next save the data. TrackMarker Select File Save File as (Figure 3.8) Select Save as type: GPS exchange file (.gpx) format (Figure 3.9) Name appropriately and save (Figure 3.10) 154

155 Figure

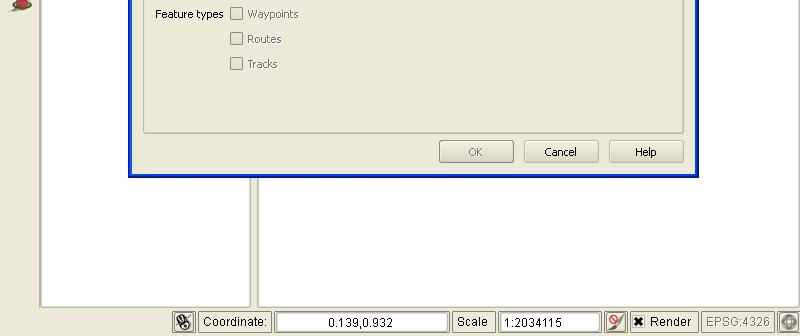
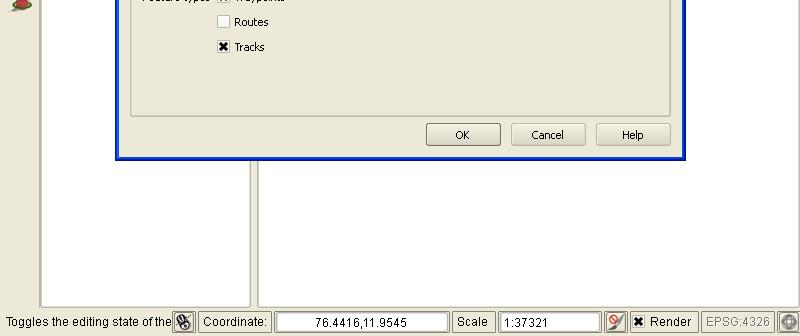
156 Figure

157 Figure

158 Figure
159 Importing the data to QGIS Close the GPS TrackMarker application Open QGIS To view this data in QGIS Select Gps tools icon (Figure 3.11) Gps Tools window appears arro Browse (Figure 3.12) Load GPX file Directs to the saved file. Select the gpx file created (Figure 3.13) 159

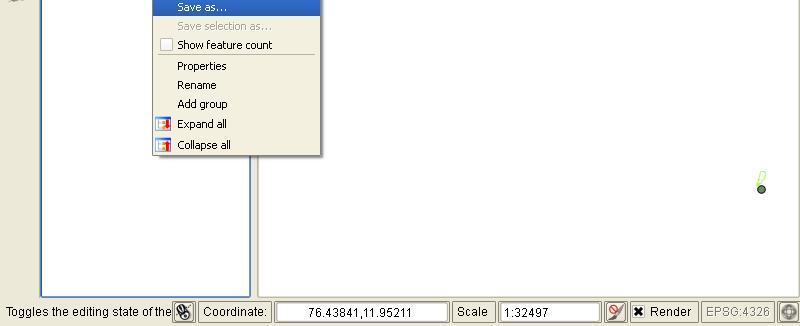
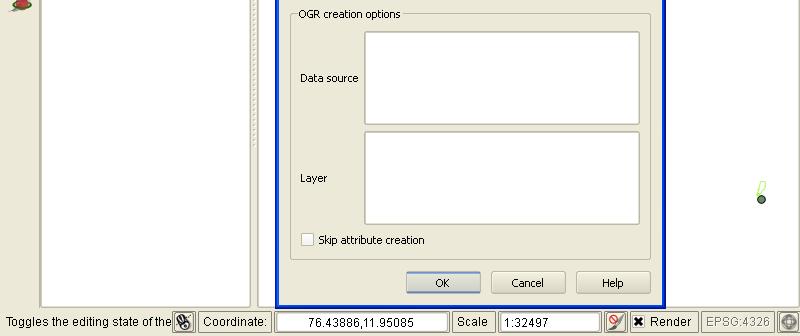
160 Figure

161 Figure

162 Figure
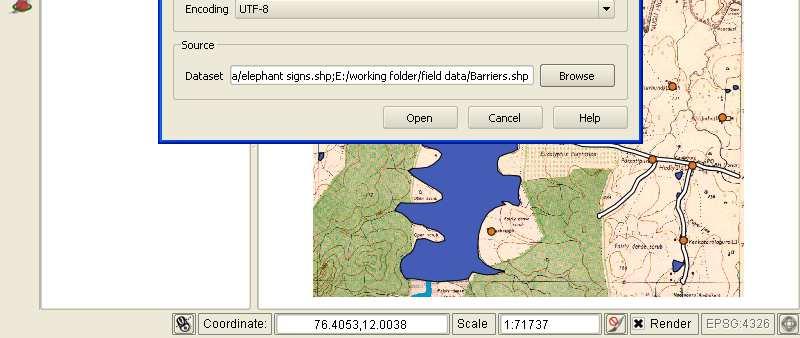
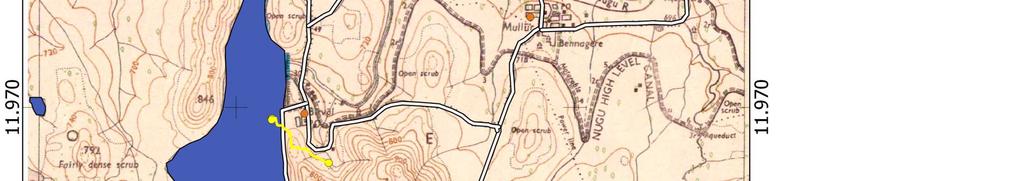
163 Importing the data to QGIS GPS tools window appears which is loaded with features and highlights various data (Waypoints, Routes and Tracks) (Figure 3.14) De-select routes (Figure 3.15) so that only Tracks and Waypoints are downloaded Select OK (Figure 3.15) In Figure 3.16 we can see that collected data is only of Tracks and Waypoints 163

164 Figure

165 Figure
166 Figure
167 Saving the Imported Data Save the files one after the other by right clicking Save as (Figure 3.17) Save vector layer as (Figure 3.18) Format: ESRI shapefiles Save as: save in desired folder CRS : WGS 84 Select OK (Figure 3.18) 167

168 Figure

169 Figure
170 Representation on Map Remove both the layers. Load all the digitised layers from Nugu area, and also the Nugu map (as described in QGIS tutorial) Now add the filed data saved from GPS (only shape files) Select Add vector layer Browse select layers Open Once again, select Open (Figure 3.19) The output (Figure 3.20) would have both the features (follow Map composer tutorial) 170

171 Figure
172 Figure

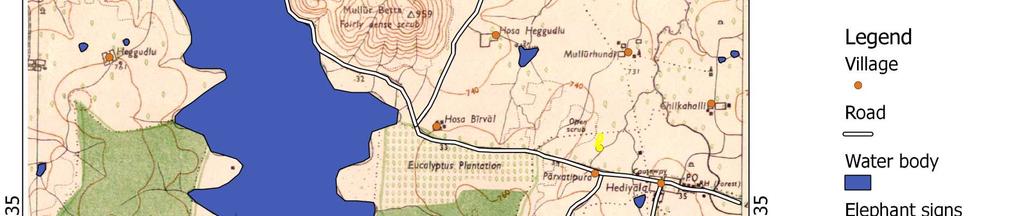
173 Final output 173

174 End of QGIS Workshop Tutorial for Forest Managers
CHAPTER 2 GEOREFERENCING AND SHAPEFILE CREATION
 CHAPTER 2 GEOREFERENCING AND SHAPEFILE CREATION Georeferencing is the process of assigning real-world coordinates to each pixel of the raster. These coordinates are obtained by doing field surveys - collecting
Map Preparation. Using QGIS
 Map Preparation Using QGIS Tutorial ID: IGET_GIS_006 This tutorial has been developed by BVIEER as part of the IGET web portal intended to provide easy access to geospatial education. This tutorial is
A Practical Guide to Using QGIS
 A Practical Guide to Using QGIS 1.1 INTRODUCTION Quantum GIS (QGIS) is a useful mapping software that enables the compilation and displaying of spatial data in the form of a map. Gaining experience in
Introduction to QGIS: Student Workbook
 2016 Introduction to QGIS: Student Workbook Created by: MARK DE BLOIS, CEO / FOUNDER, UPANDE LIMITED WITH SUPPORT FROM THE WORLD BANK AND THE UK DEPARTMENT FOR INTERNATIONAL DEVELOPMENT (DFID) Module 3:
GGR 375 QGIS Tutorial
 GGR 375 QGIS Tutorial With text taken from: Sherman, Gary E. Shuffling Quantum GIS into the Open Source GIS Stack. Free and Open Source Software for Geospatial (FOSS4G) Conference. 2007. Available online
Introduction to QGIS: Instructor s Notes
 2016 Introduction to QGIS: Instructor s Notes Created by: MARK DE BLOIS, CEO / FOUNDER, UPANDE LIMITED WITH SUPPORT FROM THE WORLD BANK AND THE UK DEPARTMENT FOR INTERNATIONAL DEVELOPMENT (DFID) Module
Introduction to using QGIS for Archaeology and History Workshop by the Empirical Reasoning Center
 Introduction to using QGIS for Archaeology and History Workshop by the Empirical Reasoning Center In this workshop, we will cover the basics of working with spatial data, as well as its main uses for archaeology.
Lesson 2 Installing and Using Quantum GIS (QGIS)
") Lesson 2 Installing and Using Quantum GIS (QGIS) Use file Explorer to open County QGIS portable hard drive provided. The program execute (.exe) will be at the bottom of the list. Double click on the file.
Lesson 2 Installing and Using Quantum GIS (QGIS) Use file Explorer to open County QGIS portable hard drive provided. The program execute (.exe) will be at the bottom of the list. Double click on the file.
Exercise 1-1: Using GPS track data to create a field boundary
 Exercise 1-1: Using GPS track data to create a field boundary Learning objectives: Add QGIS plugins Create a point vector file from a text file Convert GPS tracking points to a field boundary Data folder:
Name: Date: June 27th, 2011 GIS Boot Camps For Educators Lecture_3
 Name: Date: June 27th, 2011 GIS Boot Camps For Educators Lecture_3 Practical: Creating and Editing Shapefiles Using Straight, AutoComplete and Cut Polygon Tools Use ArcCatalog to copy data files from:
Mapping 2001 Census Data Using ArcView 3.3
 Mapping 2001 Census Data Using ArcView 3.3 These procedures outline: 1. Mapping a theme (making a map) 2. Preparing the layout for printing and exporting the map into various file formats. In order to
Step by Step GIS. Section 1
 Step by Step GIS Section 1 Contact the web page given below for the data required to do the exercises (http://www.pasda.psu.edu/default.asp) Before beginning the tutorials please visit the Preparation
Exercise 1: An Overview of ArcMap and ArcCatalog
 Exercise 1: An Overview of ArcMap and ArcCatalog Introduction: ArcGIS is an integrated collection of GIS software products for building a complete GIS. ArcGIS enables users to deploy GIS functionality
I. An Intro to ArcMap Version 9.3 and 10. 1) Arc Map is basically a build your own Google map
 Arc Map is basically a build your own Google map") I. An Intro to ArcMap Version 9.3 and 10 What is Arc Map? 1) Arc Map is basically a build your own Google map a. Display and manage geo-spatial data (maps, images, points that have a geographic location)
I. An Intro to ArcMap Version 9.3 and 10 What is Arc Map? 1) Arc Map is basically a build your own Google map a. Display and manage geo-spatial data (maps, images, points that have a geographic location)
Geographical Information Systems Institute. Center for Geographic Analysis, Harvard University. LAB EXERCISE 1: Basic Mapping in ArcMap
 Harvard University Introduction to ArcMap Geographical Information Systems Institute Center for Geographic Analysis, Harvard University LAB EXERCISE 1: Basic Mapping in ArcMap Individual files (lab instructions,
Georeferencing Topo Sheets and Scanned Maps
 Georeferencing Topo Sheets and Scanned Maps QGIS Tutorials and Tips Author Ujaval Gandhi http://www.spatialthoughts.com This work is licensed under a Creative Commons Attribution 4.0 International License.
Explore some of the new functionality in ArcMap 10
 Explore some of the new functionality in ArcMap 10 Scenario In this exercise, imagine you are a GIS analyst working for Old Dominion University. Construction will begin shortly on renovation of the new
GIS Basics for Urban Studies
 GIS Basics for Urban Studies Date: March 21, 2018 Contacts: Mehdi Aminipouri, Graduate Peer GIS Faciliator, SFU Library (maminipo@sfu.ca) Keshav Mukunda, GIS & Map Librarian Librarian for Geography (kmukunda@sfu.ca)
WILD 2400 ASSIGNMENT #1: GPS TUTORIAL*
 WILD 2400 ASSIGNMENT #1: GPS TUTORIAL* Overview: In this tutorial you will learn how to collect, download, and display data using a Garmin GPSMAP 64 unit, the DNRGPS Application, and Google Earth. For
Geomorphology Lab 6: GPS Surveying
 Introduction In this lab you will use hand-held GPS receiver units to map a running trail on campus. In addition, you will take waypoints for the benchmarks used for the Total Station project. You will
Heads-up Digitizing from Scanned Hard-Copy Maps Part II - Vector Point, Segment and Polygon Editing 1
 Data conversion/entry (GIS, databases) February 18-25, 2007 Freetown, Sierra Leone Heads-up Digitizing from Scanned Hard-Copy Maps Part II - Vector Point, Segment and Polygon Editing 1 Objectives: Create
OS OpenData masterclass 2013 Cartographic Design workshop
 OS OpenData masterclass 2013 Cartographic Design workshop 1 Quantum GIS Quantum GIS (QGIS) is a user-friendly Open Source Geographic Information System (GIS,) licensed under the GNU General Public License.
City of La Crosse Online Mapping Website Help Document
 City of La Crosse Online Mapping Website Help Document This document was created to assist in using the new City of La Crosse online mapping sites. When the website is first opened, a map showing the City
Equipping Municipalities with GIS Software
 Equipping Municipalities with GIS Software Tutorial for QGIS 2.2 Prepared by Aylo Engineering s.a.r.l. 25/05/2014 www.ayloengineering.com Overview Welcome to the wonderful world of Geographical Information
Intro to GIS (requirements: basic Windows computer skills and a flash drive)
") Introduction to GIS Intro to GIS (requirements: basic Windows computer skills and a flash drive) Part 1. What is GIS. 1. System: hardware (computers, devices), software (proprietary or free), people. 2.
Introduction to GIS Intro to GIS (requirements: basic Windows computer skills and a flash drive) Part 1. What is GIS. 1. System: hardware (computers, devices), software (proprietary or free), people. 2.
Norwegian Polar Institute, February 2018 Project website: quantarctica.npolar.no
 Get started with Quantarctica 3 Norwegian Polar Institute, February 2018 Project website: quantarctica.npolar.no Quantarctica is the result of an initiative by the Norwegian Polar Institute (NPI) to develop
Digitizing and Editing Polygons in the STS Gypsy Moth Project. M. Dodd 2/10/04
 Digitizing and Editing Polygons in the STS Gypsy Moth Project M. Dodd 2/10/04 Digitizing and Editing Polygons in the STS Gypsy Moth Project OVERVIEW OF DIGITIZING IN STS 3 THE DIGITIZING WINDOW 4 DIGITIZING
Lab 3: Digitizing in ArcGIS Pro
 Lab 3: Digitizing in ArcGIS Pro What You ll Learn: In this Lab you ll be introduced to basic digitizing techniques using ArcGIS Pro. You should read Chapter 4 in the GIS Fundamentals textbook before starting
QGIS Workshop Su Zhang and Laura Gleasner 11/15/2018. QGIS Workshop
 1. Introduction to QGIS QGIS Workshop QGIS is a free and open source Geographic Information System (GIS). QGIS can help users create, edit, visualize, analyze, and publish geospatial information on various
FOR 240 Lab 8 Assignment Using GPS to Collect Spatial Data of Forest Management Introduction to Computing in Natural Resources
 FOR 240 Lab 8 Assignment Using GPS to Collect Spatial Data of Forest Management Introduction to Computing in Natural Resources In this lab, we are going to use the GPS to collect timber cruising data.
Welcome to the Surface Water Data Viewer!
 1 Welcome to the Surface Water Data Viewer! The Surface Water Data Viewer is a mapping tool for the State of Wisconsin. It provides interactive web mapping tools for a variety of datasets, including chemistry,
Tutorial 7: Adding Features and Editing Line and Polygon Layers
 Tutorial 7: Adding Features and Editing Line and Polygon Layers Tutorial Content 7.1. When should I use a line layer to represent data? 7.2. How do I add line features? 7.3. How to use the snapping tool?
Exercise Producing Thematic Maps for Dissemination
 Exercise Producing Thematic Maps for Dissemination 2007 In this exercise you will work with an existing file geodatabase which contains administrative boundaries (named wards) feature class and population
All data is in Universal Transverse Mercator (UTM) Zone 6 projection, and WGS 84 datum.
 Zone 6 projection, and WGS 84 datum.") 111 Mulford Hall, College of Natural Resources, UC Berkeley (510) 643-4539 EXPLORING MOOREA DATA WITH QUANTUM GIS In this exercise, you will be using an open-source FREE GIS software, called Quantum GIS,
111 Mulford Hall, College of Natural Resources, UC Berkeley (510) 643-4539 EXPLORING MOOREA DATA WITH QUANTUM GIS In this exercise, you will be using an open-source FREE GIS software, called Quantum GIS,
INTRODUCTION TO GIS WORKSHOP EXERCISE
 111 Mulford Hall, College of Natural Resources, UC Berkeley (510) 643-4539 INTRODUCTION TO GIS WORKSHOP EXERCISE This exercise is a survey of some GIS and spatial analysis tools for ecological and natural
Bharath Setturu Research scholar, EWRG, Center for Ecological Sciences, IISc, Bangalore & EWRG-CES IIIT-HYDERABAD
 Bharath Setturu Research scholar, EWRG, Center for Ecological Sciences, IISc, Bangalore settur@ces.iisc.ernet.in & IIIT-HYDERABAD Introduction to QGIS oquantum GIS (QGIS) is a GIS tool for managing geographical
Exercise 1: Getting to know ArcGIS
 The Scenario You are working for the California Visitor s Commission. You have been asked to prepare a map of California for several dignitaries from out of the country. Your map will need to include enough
Bharath Setturu Research scholar, EWRG, Center for Ecological Sciences, IISc, Bangalore & IIIT-HYDERABAD
 Bharath Setturu Research scholar, EWRG, Center for Ecological Sciences, IISc, Bangalore settur@ces.iisc.ernet.in & IIIT-HYDERABAD Introduction to QGIS oquantum GIS (QGIS) is a GIS tool for managing geographical
Geological mapping using open
 Geological mapping using open source QGIS MOHSEN ALSHAGHDARI -2017- Abstract Geological mapping is very important to display your field work in a map for geologist and others, many geologists face problems
Quick Guide to MapWindow GIS Desktop Application
 Quick Guide to MapWindow 1 Quick Guide to MapWindow GIS Desktop Application Version 2 January 2007 Adapted by Tom Croft. This is a summary user guide for commonly used tools and capabilities and does not
QUANTUM GIS GUIDE FOR WASH FACILITY DATA COLLECTORS AND -MANAGERS
 COWASH Training Quantum GIS 1 QUANTUM GIS GUIDE FOR WASH FACILITY DATA COLLECTORS AND -MANAGERS Quantum GIS (QGIS) is widely used open source GIS software which usage is very similar to GIS-software market
Development Authority of the North Country (DANC) Internet Mapping Application Instructions Public Viewer 1. Purpose. 2. Logging-in. 3.
 Internet Mapping Application Instructions Public Viewer 1. Purpose. 2. Logging-in. 3.") Development Authority of the North Country (DANC) Internet Mapping Application Instructions Public Viewer 1. Purpose The purpose of this document is to outline basic functionality of the DANC Internet
Development Authority of the North Country (DANC) Internet Mapping Application Instructions Public Viewer 1. Purpose The purpose of this document is to outline basic functionality of the DANC Internet
From data source to data view: A practical guide to uploading spatial data sets into MapX
 From data source to data view: A practical guide to uploading spatial data sets into MapX Thomas Piller UNEP/GRID Geneva I Table of contents 1. Adding a new data source to MapX... 1 1.1 Method 1: upload
Lab 3: Digitizing in ArcMap
 Lab 3: Digitizing in ArcMap What You ll Learn: In this Lab you ll be introduced to basic digitizing techniques using ArcMap. You should read Chapter 4 in the GIS Fundamentals textbook before starting this
Low Cost and Free Public Health Mapping Tools
 Low Cost and Free Public Health Mapping Tools Quantum GIS - QGIS 1) Download and Install a) QGIS can be quickly and easily installed on Windows, Macs and Linux from installers found here: http://hub.qgis.org/projects/quantum-gis/wiki/download
QGIS for Geoscientists
 QGIS for Geoscientists Robin Armit, Tom Carmichael, Lachlan Grose Monash Structural Geophysics group 22 nd 26th February 2016 GIS A geographic information system (GIS) is a system designed to capture,
Exercise 04 Topological Shapefle Editing plus Importing and editing GPS data Assigned Feb. 9, 2018 Due Feb. 16, 2018
 Exercise 04 Topological Shapefle Editing plus Importing and editing GPS data Assigned Feb. 9, 2018 Due Feb. 16, 2018 This week we will use the same laramie_quad_usgs_1963.tiff as last week as well as the
MAPLOGIC CORPORATION. GIS Software Solutions. Getting Started. With MapLogic Layout Manager
 MAPLOGIC CORPORATION GIS Software Solutions Getting Started With MapLogic Layout Manager Getting Started with MapLogic Layout Manager 2011 MapLogic Corporation All Rights Reserved 330 West Canton Ave.,
Exercise 3-1: Soil property mapping
 Exercise 3-1: Soil property mapping Mapping objectives: Create a soil analysis point layer from tabular data in QGIS Create a continuous surface soil property map using Kriging Interpolation in SAGA GIS
Basic Mapping: Livelihood Zones In Haiti
 Basic Mapping: Livelihood Zones In Haiti - 2009 Barbara Parmenter, revised by Carolyn Talmadge 9/10/2016 DATA SOURCES... 1 MAPPING NETWORK DRIVES OUTSIDE THE DATA LAB... 2 SETTING UP YOUR ARCMAP SESSION...
Geography 281 Map Making with GIS Project Two: Map Design Issues in ArcMap
 Geography 281 Map Making with GIS Project Two: Map Design Issues in ArcMap This activity provides an introduction to the map design process. It takes you through a typical sequence from the initial decision
Introduction to SAGA GIS
 GIS Tutorial ID: IGET_RS_001 This tutorial has been developed by BVIEER as part of the IGET web portal intended to provide easy access to geospatial education. This tutorial is released under the Creative
Spatial data and QGIS
 Spatial data and QGIS Xue Jingbo IT Center 2017.08.07 A GIS consists of: Spatial Data. Computer Hardware. Computer Software. Longitude Latitude Disease Date 26.870436-31.909519 Mumps 13/12/2008 26.868682-31.909259
v Annotation Tools GMS 10.4 Tutorial Use scale bars, North arrows, floating images, text boxes, lines, arrows, circles/ovals, and rectangles.
 v. 10.4 GMS 10.4 Tutorial Use scale bars, North arrows, floating images, text boxes, lines, arrows, circles/ovals, and rectangles. Objectives GMS includes a number of annotation tools that can be used
for ArcSketch Version 1.1 ArcSketch is a sample extension to ArcGIS. It works with ArcGIS 9.1
 ArcSketch User Guide for ArcSketch Version 1.1 ArcSketch is a sample extension to ArcGIS. It works with ArcGIS 9.1 ArcSketch allows the user to quickly create, or sketch, features in ArcMap using easy-to-use
Using Spatial Data in a Desktop GIS; QGIS 2.8 Practical 2
 Using Spatial Data in a Desktop GIS; QGIS 2.8 Practical 2 Practical 2 Learning objectives: To work with a vector base map within a GIS and overlay point data. To practise using Ordnance Survey mapping
Getting Started with VicMap
 Getting Started with VicMap This is a brief overview of some of the tools and features available on VicMap. At any time you can right click on the map and click Identify What s Here to find more information
WAITOMO DISTRICT COUNCIL ONLINE MAPS. Updated June This document contains an overview of Waitomo District Council Online Maps
 WAITOMO DISTRICT COUNCIL ONLINE MAPS V8 Updated June2017 - This document contains an overview of Waitomo District Council Online Maps Table of Contents Starting Online Maps... 3 Main Screen... 4 Menu Bar...
Select Objects for Use
 System In TNTgis you select geospatial data for viewing and analysis using the Select objects window (which may have varying names depending on the context). The upper part of the window has several tabbed
IntraMaps End User Manual
 IntraMaps End User Manual For IntraMaps Version 8 Date: 6 th July 2014 Contents Introduction... 4 What is IntraMaps?... 4 Application... 5 Main Toolbar... 6 View... 7 Original View:... 7 Pan:... 7 Zoom
QGIS Workshop Su Zhang and Laura Gleasner 11/10/2016. QGIS Workshop
 1. Introduction to Quantum GIS (QGIS) QGIS Workshop QGIS is a free and open source Geographic Information System (GIS). QGIS can help you create, edit, visualize, and publish geospatial information on
EDINA Workshop: Creating a Campus Map and Displaying it in OpenLayers
 Contents Introduction... 2 What steps are involved?... 3 Before you start... 4 Create your campus map... 5 1. Load the basemap data into ArcMap... 5 2. Set up Symbology and Labels of Layers... 6 Improve
4. If you are prompted to enable hardware acceleration to improve performance, click
 Exercise 1a: Creating new points ArcGIS 10 Complexity: Beginner Data Requirement: ArcGIS Tutorial Data Setup About creating new points In this exercise, you will use an aerial photograph to create a new
STUDENT PAGES GIS Tutorial Treasure in the Treasure State
 STUDENT PAGES GIS Tutorial Treasure in the Treasure State Copyright 2015 Bear Trust International GIS Tutorial 1 Exercise 1: Make a Hand Drawn Map of the School Yard and Playground Your teacher will provide
Out of the Office and Into the Field: Introduction to ArcPad and ArcPad Application Builder
 Out of the Office and Into the Field: Introduction to ArcPad and ArcPad Application Builder A Yale Map Collection GIS Workshop Preparing For the Tutorial 1. Navigate to the C:\Temp folder on your harddrive.
Producing Project Deliverables: Creating a Plan Set
 Practice Workbook This workbook is designed for use in Live instructor-led training and for OnDemand selfstudy. The explanations and demonstrations are provided by the instructor in the classroom, or in
Exercise 4.1. Create New Variables in a Shapefile. GIS Techniques for Monitoring and Evaluation of HIV/AIDS and Related Programs
 GIS Techniques for Monitoring and Evaluation of HIV/AIDS and Related Programs Exercise 4.1 Create New Variables in a Shapefile *This training was developed as part of a joint effort between MEASURE Evaluation
Basic Mapping: Livelihood Zones In Haiti
 Basic Mapping: Livelihood Zones In Haiti - 2009 Barbara Parmenter, revised by Carolyn Talmadge 9/10/2017 for ArcMap 10.5.1 DATA SOURCES... 1 MAPPING NETWORK DRIVES OUTSIDE THE DATA LAB... 2 SETTING UP
WAIPA DISTRICT COUNCIL. Maps Online 9. Updated January This document contains an overview of IntraMaps/Maps Online version 9.
 WAIPA DISTRICT COUNCIL Maps Online 9 Updated January 2018 This document contains an overview of IntraMaps/Maps Online version 9.0 Contents Starting Maps Online... 3 Menu Bar... 4 Tools... 5 View Tab...
Second Summer School on Digital Tools for Humanists. Instructions for the hands-on tutorial on GIS
 Second Summer School on Digital Tools for Humanists Instructions for the hands-on tutorial on GIS Augusto Ciuffoletti Dipartimento di Informatica - Università di Pisa Pisa - June 2018 Abstract This document
The Preparing for Success Online Mapping Tool
 The Preparing for Success Online Mapping Tool Baker Polito Administration The Executive Office of Housing and Economic Development and MassGIS Questions & Comments? Please contact MassWorks@state.ma.us
Census Small Area Population Statistics (SAPS) A Guide to using the SAPMAP web application
 A Guide to using the SAPMAP web application") Census Small Area Population Statistics (SAPS) A Guide to using the SAPMAP web application 1 When you open the application you will see this page. This screen gives a brief description of the application.
Census Small Area Population Statistics (SAPS) A Guide to using the SAPMAP web application 1 When you open the application you will see this page. This screen gives a brief description of the application.
HCA ArcGIS. Online Tool - How To Guide V1.0 2/15/2016 HAWAII CONSERVATION ALLIANCE AGOL
 HCA ArcGIS 2/15/2016 Online Tool - How To Guide V1.0 HAWAII CONSERVATION ALLIANCE AGOL Table of Contents What is ArcGIS Online?... 1 Getting Started... 1 Getting a Login... 1 Logging In... 2 Searching
Using ArcGIS 10.x Introductory Guide University of Toronto Mississauga Library Hazel McCallion Academic Learning Centre
 Using ArcGIS 10.x Introductory Guide University of Toronto Mississauga Library Hazel McCallion Academic Learning Centre FURTHER ASSISTANCE If you have questions or need assistance, please contact: Andrew
Modern Tools for NTDs Control Programmes
 Modern Tools for NTDs Control Programmes www.thiswormyworld.org Practical 1 Becoming familiar with QGIS interface and GIS features www.thiswormyworld.org 2 Aim of practical This first practical aims to
QUICK START GUIDE. SOLO Forest
 QUICK START GUIDE SOLO Forest Software Installation 1. For PC installation, run the.msi file. 2. For Mobile device installation, copy the.cab file onto the device 3. Run the.cab file Starting the Program
IDERA ER/Studio Software Architect Evaluation Guide. Version 16.5/2016+ Published February 2017
 IDERA ER/Studio Software Architect Evaluation Guide Version 16.5/2016+ Published February 2017 2017 IDERA, Inc. All rights reserved. IDERA and the IDERA logo are trademarks or registered trademarks of
NMCRIS Map Service Application Feature Editing
 NMCRIS Map Service Application Feature Editing Exercise goal: Users will edit the polygonal boundaries for activities and resources in the NMCRIS Map Service. Important: This exercise is a sample presentation
THE HONG KONG POLYTECHNIC UNIVERSITY DEPARTMENT OF LAND SURVEYING & GEO-INFORMATICS LSGI521 PRINCIPLES OF GIS
 THE HONG KONG POLYTECHNIC UNIVERSITY DEPARTMENT OF LAND SURVEYING & GEO-INFORMATICS LSGI521 PRINCIPLES OF GIS Student name: Student ID: Table of Content Working with files, folders, various software and
Guide to Mapping Website (Public) December 2016 GC_236594
 December 2016 GC_236594") Guide to Mapping Website (Public) December 2016 GC_236594 Table of Contents Guide to Mapping Website (Public)... 1 December 2016... 1 Quick Start... 3 Map Layers... 4 How do I?... 5 Draw on the Map...
Guide to Mapping Website (Public) December 2016 GC_236594 Table of Contents Guide to Mapping Website (Public)... 1 December 2016... 1 Quick Start... 3 Map Layers... 4 How do I?... 5 Draw on the Map...
OnCOR Silverlight Viewer Guide
 Getting Around There are many ways to move around the map! The simplest option is to use your mouse in the map area. If you hold the left button down, then click and drag, you can pan the map to a new
Press the Plus + key to zoom in. Press the Minus - key to zoom out. Scroll the mouse wheel away from you to zoom in; towards you to zoom out.
 Navigate Around the Map Interactive maps provide many choices for displaying information, searching for more details, and moving around the map. Most navigation uses the mouse, but at times you may also
Introduction to basic GIS. International Federation of Red Cross and Red Crescent Societies Information Management Team. September 2017 Version 1.
 Introduction to basic GIS International Federation of Red Cross and Red Crescent Societies Information Management Team September 2017 Version 1.0 Introduction This is a basic GIS guidance document created
Add to the ArcMap layout the Census dataset which are located in your Census folder.
 Building Your Map To begin building your map, open ArcMap. Add to the ArcMap layout the Census dataset which are located in your Census folder. Right Click on the Labour_Occupation_Education shapefile
Mapping Census data in QGIS
 Mapping Census data in QGIS Contents Contents 1. Introduction...3 1.1. Census data...3 1.2. Boundary data...3 1.3. Mapping software...3 2. Obtain your census data...4 Step 1: Geography...4 Step 2: Topics...5
_Tutorials. Arcmap. Linking additional files outside from Geodata
 _Tutorials Arcmap Linking additional files outside from Geodata 2017 Sourcing the Data (Option 1): Extracting Data from Auckland Council GIS P1 First you want to get onto the Auckland Council GIS website
Coordinate Systems/Units
 GIS and Mapping Procedures in fgis Beginning a fgis Project Adding Basemap Data Adding GPS Data Editing Layer Properties Checking Feature Attributes Adding Acres to Area Features Adding Acres Labels to
Community Health Maps Lab Series
 Community Health Maps Lab Series Lab 5 Cartography with QGIS Objective Understand how to style data and compose a map with QGIS Desktop Document Version: 2017-08-28(Final) This course is a collaborative
button in the lower-left corner of the panel if you have further questions throughout this tutorial.
 Mosaic Tutorial: Simple Workflow This tutorial demonstrates how to use the Seamless Mosaic tool to mosaic six overlapping digital aerial scenes. You will learn about displaying footprints and image data
-In windows explorer navigate to your Exercise_4 folder and right-click the DEC_10_SF1_P1.csv file and choose Open With > Notepad.
 BIOL 4460/5460 and GEOL 4460 Introduction to GIS LAB 4 MAKING A THEMATIC MAP This exercise is to show you how to create a map for printing. As you have seen in the lecture, maps can have different purposes
Practical 3 Creating your map layouts using the print composer in QGIS
 Practical 3 Creating your map layouts using the print composer in QGIS www.thiswormyworld.org Aim of practical This third and final practical aims to familiarize the trainees with the Print Composer, the
Getting Started with the new GIS Map Service Overview:
 Getting Started with the new GIS Map Service Overview: 1. Layer List Widget Shows all available layers. This widget will be open by default. 2. Legend Widget Gives symbology information for all visible
Tutorial for Lane County Mapping Applications
 Tutorial for Lane County Mapping Applications Contents Overview... 2 Tools... 2 Navigation Tools... 3 Display Tools... 5 Information Tools... 6 Sharing Tools... 7 Common Tasks... 9 Identify or Show Data
How to perform a quality check of a new dataset. QGIS Tutorials and Tips
 How to perform a quality check of a new dataset QGIS Tutorials and Tips ZanSea zansea@suza.ac.tz 1 Objective GIS datasets can come from many different sources: From a Website. From a USB key given by a
Exercise 03 Creating and Editing Shapefiles Assigned Feb. 2, 2018 Due Feb. 9, 2018
 Exercise 03 Creating and Editing Shapefiles Assigned Feb. 2, 2018 Due Feb. 9, 2018 On the class website I've posted an exercise_03_data.zip file which contains a USGS 7.5' quad map of Laramie (as laramie_quad_usgs_1963.tiff)
Tutorial 01 Quick Start Tutorial
 Tutorial 01 Quick Start Tutorial Homogeneous single material slope No water pressure (dry) Circular slip surface search (Grid Search) Intro to multi scenario modeling Introduction Model This quick start
SPATIAL DESIGN NETWORK ANALYSIS sdna in QGIS
 SPATIAL DESIGN NETWORK ANALYSIS sdna in QGIS 1 Installing sdna+ as plugin for QGIS... 2 1.1 Download & Install sdna... 2 1.2 Setting up sdna in QGIS... 3 1.3 Open the sdna toolbox... 5 2 sdna in QGIS Processing
User s Guide: BIOS Online Mapping Tool to access the California Freshwater Species Database
 User s Guide: BIOS Online Mapping Tool to access the California Freshwater Species Database Last updated: December 2017 Tutorial created by: The Nature Conservancy Topics covered Part 1: Exporting a tabular
NorWeST ArcGIS Online Map Help Document
 Overview of the Online Map NorWeST ArcGIS Online Map Help Document Sharon (Parkes) Payne November 1, 2017 There are tabs available along the left under the map name and tools in the upper left-hand corner
Lab 12: Sampling and Interpolation
 Lab 12: Sampling and Interpolation What You ll Learn: -Systematic and random sampling -Majority filtering -Stratified sampling -A few basic interpolation methods Data for the exercise are in the L12 subdirectory.