Using Crystal Reports with Lucity
|
|
|
- Magnus Rose
- 6 years ago
- Views:
Transcription
1 Using Crystal Reports with Lucity Beginner 1 The first of a seven-part series, this workbook is designed for new Crystal Reports users. You ll learn how to make small modifications to an existing report under a new report name, and link your customized report into Lucity. Table of Contents Getting Started... 3 Crystal Reference... 3 Standard Toolbar... 3 Insert Tools Toolbar... 3 Formatting Toolbar... 4 Expert Tools Toolbar... 4 Navigation Tools Toolbar... 4 Menu Bar... 5 Custom Reports from a Standard Report... 8 Finding the Report Location and Name... 8 Renaming Reports... 9 Exporting a Report Desktop Web Setup Options Options Report Options Document Properties Report Sections Modifying a Report Saving and Viewing your Report Field Types Changing Text in Text Objects Field Sizing Resize a Text Box: Resize a Field: Deleting a Field Delete a Field:... 28
2 Field Movement Add a Text Object Adding Fields Special Fields Copying Fields Formatting Fields General Formatting Number Formatting Copying Formatting Alignment of Fields Using Formulas Date and Time Fields Date Fields Time Fields Documentation Comments Inserting Lines and Boxes Lines Boxes Growing Fields Report Manipulation Removing Parameters Inserting an Agency Logo Adding a Report to the Module Accessing Reports in Lucity Datasource Set Datasource Location Converting Desktop Reports to use in the Web Beginning Crystal 1 2
3 Getting Started The Crystal Report software is what is currently used to create the standard reports provided with the Lucity software. To create or revise reports the user must own the Crystal Reports software. The user also needs to have permission to make changes to the reports and add them to the system. The desktop version of Lucity can only support the functions provided in Crystal XI. The Lucity software can run reports created in later versions of Crystal, however; it cannot use any new functionality. The Web version of Lucity was developed using a newer version of Crystal, Crystal There is at least one added bit of functionality in this version that is very helpful to have. If you are purchasing the Crystal Report software you should buy at least Crystal Crystal Versions 9, 10, XI, 2008, 2011, Crystal Reference The tool bar icons sometimes change with the version of Crystal. Screen shots throughout the Help Guides are capturing what was provided with Crystal XI. Standard Toolbar Crystal XI New Report, Open, Save, Print, Print Preview, HTML Preview, Cut, Copy, Paste, Format Painter, Undo, Redo, Toggle Group Tree, Field Explorer, Report Explorer, Repository Explorer, Dependency Checker, Workbench, Find, Zoom Control, Help Crystal 2008 New Report, Open, Save, Print, Print Preview, HTML Preview, Export, Cut, Copy, Paste, Format Painter, Undo, Redo, Toggle Preview Panel, Field Explorer, Report Explorer, Repository Explorer, Dependency Checker, Workbench, Find Insert Tools Toolbar Crystal XI Insert Text Object, Insert Group, Insert Summary, Insert Cross-Tab, Insert OLAP grid, Insert Subreport, Insert Line, Insert Box, Insert Picture, Insert Chart, Insert Map Crystal 2008 Insert Text Object, Insert Group, Insert Summary, Insert Cross-Tab, Insert OLAP grid, Insert Subreport, Insert Line, Insert Box, Insert Picture, Insert Chart, Insert Map, Insert Flash Object Beginning Crystal 1 3
4 Formatting Toolbar Crystal XI Font Face, Font Size, Increase Font Size, Decrease font Size, Bold, Italics, Underline, Align Left, Align Center, Align Right, Justify, Font Color, Outside Borders, Suppress, Lock Format, Lock Size/Position, Currency, Thousands, Percent, Increase Decimals, Decrease Decimals. Crystal 2008 Font Face, Font Size, Increase Font Size, Decrease font Size, Bold, Italics, Underline, Align Left, Align Center, Align Right, Justify, Font Color, Outside Borders, Suppress, Lock Format, Lock Size/Position, Currency, Thousands, Percent, Increase Decimals, Decrease Decimals. Expert Tools Toolbar Crystal XI Database Expert, Group Expert, Group Sort Expert, Record Sort Expert, Select Expert, Section Expert, Formula Workshop, OLAP Design Wizard, Template Expert, Format, Insert Hyperlink, Highlighting Crystal 2008 Database Expert, Group Expert, Group Sort Expert, Record Sort Expert, Select Expert, Section Expert, Formula Workshop, OLAP Design Wizard, Template Expert, Format, Insert Hyperlink, Highlighting Navigation Tools Toolbar Crystal XI Refresh, Stop, Show First Page, Show Previous Page, Show Next Page, Show Last Page, Back, Forward Crystal 2008 Refresh, Stop, Show First Page, Show Previous Page, Show Next Page, Show Last Page Beginning Crystal 1 4


5 Menu Bar The functions of the toolbar icons are also available in the drop down Menu Bar at the top. Beginning Crystal 1 5

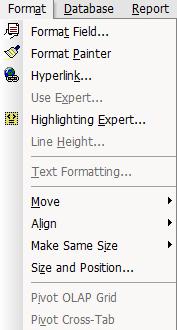

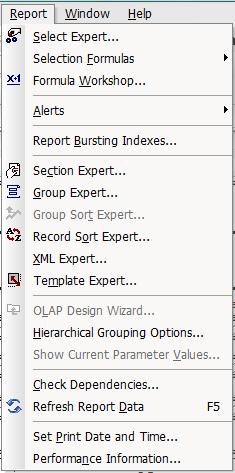

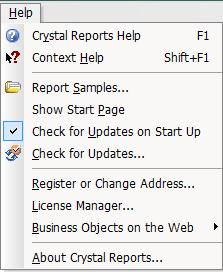
6 Beginning Crystal 1 6
7 Lucity provides a Request Summary Report (ReqSum.rpt) that looks like this: Preview We would like to modify the report to look like this: Preview Some of the changes include adding a company logo, changing column headers, adding text objects, adding data fields, creating formulas and formatting. Beginning Crystal 1 7

8 Custom Reports from a Standard Report Finding the Report Location and Name The first step in modifying a standard Lucity report is to identify the report name and location so a copy of the report can be created to modify as a new custom report. 1. Open the Lucity module where the Request Summary Report is located. o Select Work>>Request from the Lucity main menu. 2. Open the Reports dialog. Click the report icon on the module toolbar. 3. Locate the report to be modified and highlight it. Summary of Requests 4. You ll see the Report File Path at the bottom of the dialog box. This path tells you important information about the report. o The first part of the path tells you where the report file is located. In our example below, the report is located at C:\Lucity76\Reports\Work\. Note: Lucity report files are stored in the shared files location designated during your initial installation. This is typically on a file server, but could be on your local machine. In the path shown below, C is a mapped drive. This could also be a UNC path using the full server name. o The report name appears after the last backslash. As you can see below, this report is named ReqSum.rpt. Beginning Crystal 1 8
9 In the report location, the Reports Directory can be sorted by Name or Date Modified by clicking on the title in the upper bar. Renaming Reports If you modify a report and save it under the original name, the changes you made will be overridden the next time Lucity is upgraded. Thus, reports that are modified must be saved under a new name in order to be used. Note: You must have adequate permissions to save the modified reports. If you are not sure whether you have these permissions, check with your system administrator. 1. You ll want to make a copy of the report before you begin working on it. You can do this by simply exporting the report from the Lucity module s Report List to the Report Directory under a different name. 2. It s a good practice to establish a naming convention for your custom reports that makes them easy to distinguish from the Lucity standard report names. For example, you might want to add a two or three letter abbreviation for your company or organization or perhaps your initials to the original report name as a prefix or suffix. Some sample custom report names are LC_ReqSum.rpt or ReqSum_LC.rpt. Adding the abbreviation to the end of the report name (before the.rpt extension) will allow the custom report to be sorted with the original. Adding the abbreviation as a prefix will sort all of your custom reports together. 3. Lucity reports store database connection information. When the report is run in Lucity, the program replaces this connection information with connection strings specific to the customer s database configuration during run-time. When you export a report, the database connection information used at run-time is saved. This is the preferred method for handling Lucity reports and will ensure that the report stays pointed to the correct data set so that the report can be run out in Crystal. Beginning Crystal 1 9

 3. An Export dialog will appear. a. Select Crystal Reports from the Format drop down box.")
10 Exporting a Report As we mentioned above, the preferred way of handling Lucity reports is to export them. This allows you to rename the report and make modifications as well as maintain your database connection information. Follow the steps below to export a report: Desktop 1. Within the Reports dialog click All Records. 2. Highlight the report you d like to copy and select Export Report. (Wait) 3. An Export dialog will appear. a. Select Crystal Reports from the Format drop down box. b. Then, select Disk file in the Destination drop down box. c. Click OK. Beginning Crystal 1 10
. 7. Click Save. 8.")

11 4. The following dialog will appear: 5. Find the location where the report is to be stored. It is recommended that you use the default report location discussed in the previous pages. 6. Type in a new File Name (LC_ReqSum.rpt). 7. Click Save. 8. At this point the report needs to run, the subtitle query is optional but almost any other query such as dates must be entered, then click OK. Note: If the Export takes more than a few seconds then cancel and change the Report filter to This Record Only. This may be necessary for complex reports, especially ones with subreports. Then Export (follow above steps 2 8). Beginning Crystal 1 11


12 9. Close the Report dialog. 10. Minimize the Lucity module. 11. In the Reports Directory, open the new report that was just exported. o On the report title either Right click and select Open or double click. 12. From the menu bar at the top of the screen, select File. 13. Uncheck the Save Data with Report option. 14. Click Save. 15. If the report is Exported with This Record Only then the Select Expert needs to be opened and the ID selection formula deleted. a. Click Select Expert. b. Click Show Formula>>>. c. Click and drag over the formula. d. Press Delete key to remove. Beginning Crystal 1 12

13 e. Click OK. f. Click Save. You are now ready to begin making modifications to the report. Web Note: Reports with secure fields may show as Hidden but this is temporary and can be changed when refreshing the report and choosing the Prompt for new parameter values. If date fields were required to run the report these too would be temporarily placed in the report until the report is refreshed and new parameters are given. 1. In the Report Dialog click on the report to be Exported. 2. Run the report with Selected Records and the Advanced View (HTML) options. 3. Once the report has run, select the Export this report option in the top tool bar. 4. This opens the following Dialog. Click Export. Example 1 and Example 2 5. The referenced report name in this example is lucitymscrv.rpt and is not the actual file name, ignore this. Under the Save options select Save as then browse to the location and give the file a new name. 6. Select the Open option. 7. In the tool bar select File, UNCHECK the Save Data with Report option. 8. Open the Select Expert and remove the formula for the ID field that was placed in here because the report was run with Selected Records. 9. Click Save. You now have a copy of the report with a new name and pointed to your data. The User ID and Password for your database are required to run the report away from the Lucity. Beginning Crystal 1 13

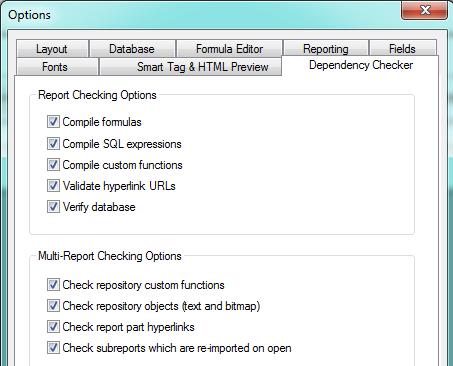
14 Setup Options Whether a report is modified or created new, it is helpful for certain report options to be set before working on the report. Within the Crystal Reports Options and Report Options there are a number of settings that can be preset for generalizations. These can be changed for individual reports or individual fields within a report. Options To view the Options section, we will look at the previously exported report, LC_ReqSum.rpt. o In the Menu Bar click File >> Options The following screen captures show what options can be changed behind the scenes. These options will be reflected in all of the reports created. Beginning Crystal 1 14

15 Once the database has been unified it is important to confirm the Stored Procedures option is unchecked. This is necessary to show all of the Lucity tables to add to a report or when repointing tables. Crystal Reports limits the number of objects available to be used in a report and Stored Procedures are counted as objects but are typically not used in reporting. Notes: Beginning Crystal 1 15

16 Notes: Beginning Crystal 1 16

17 Beginning Crystal 1 17

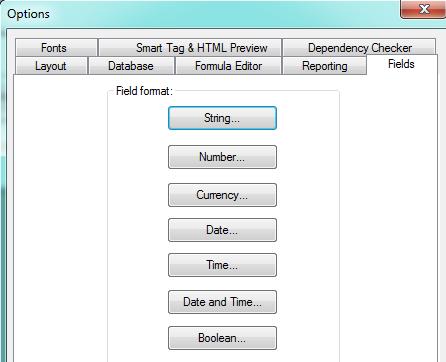
18 For each field type there are format options specific to that type. There is a sample box at the bottom of the Format Editor for each field type that shows the current field formatting. String Number Beginning Crystal 1 18
19 Currency Date Beginning Crystal 1 19
20 Time Boolean Beginning Crystal 1 20


21 Each Field or Object type opens the Font options. Beginning Crystal 1 21

22 Beginning Crystal 1 22

23 Report Options Report Options are specific to an individual report. o In the Menu Bar click File >> Report Options. These Report Options are also available within Subreports (discussed later). Beginning Crystal 1 23


24 Document Properties Another useful Crystal option is Document Properties. This information could help in report documentation. Some of the fields are available to be used in the report. They are found in the Special Fields section listed in Field Explorer (Discussed later). o In the Menu Bar click File >> Summary Info Beginning Crystal 1 24


25 Report Sections Every report has a minimum of five sections. These sections show on the left side of the report. To conserve space this section can be reduced in size by right clicking in the section and selecting Show Short Section Names Beginning Crystal 1 25

26 Modifying a Report Beneath the toolbars the open report will have a tab with either the report file name or the Title set up in Document Properties. Beneath this, the exported report already has two tabs available, Design and Preview. If the report is opened from the report folder then the Design tab will be present but the Preview will only show after the report is run. The Design page is where most of the report modifications will take place but can be done in Preview as well. Note: The undo and redo buttons are very helpful when revising reports. Saving and Viewing your Report Save any changes by clicking on Save. It is a good idea to Save while you are working and not just when you are finished with the report. (You never know when you will encounter one of those mysterious error statements that shuts down your system, losing all of your work). To preview the report, click Print Preview. To refresh the report, click Refresh. To limit the number of records previewed: o o o In the Menu Bar click View. Select Preview Sample Select First and type in the number of records you would like the report to run with. This is particularly helpful when you have large numbers of records to deal with. Beginning Crystal 1 26

27 Note: If you are looking for a specific record in Preview mode, you can use the Find Tool button and enter the data you wish to find. Field Types Field types include Text Objects, Database Fields, Formula Fields, Field Titles, Parameter Fields, Running Total Fields, Group Name Fields and Special Fields. When the cursor is placed over the field boxes, field type information appears if Tooltips is turned on. If you place the cursor over the Request # box, Text Object appears. This means that Request # is a group of characters that can be modified. This is a column header that was manually typed in. If the cursor is placed over RQ_Number, it shows the table (WKREQ), field name (RQ_NUMBER) and data type (string). Depending on the age of the report the default field caption may also show. This Database Field is bringing in data from a table. In Field Explorer (discussed later) the previous tooltip information may show as well as the size of the string mask for the field. Changing Text in Text Objects In the example report, LC_ReqSum.rpt, we will change the text object field Request # to Request Number. To change the text within a Text Object: 1. Double click on the box with Request #. 2. Click and drag over the portion you want to change (#). 3. Type the new text (Number) and click out of the box. change to Beginning Crystal 1 27
28 Field Sizing Sometimes it is necessary to resize or delete existing fields to accommodate additional text or make room for a new field. Resize a Text Box: 1. Click on the text object (Problem) which will highlight the borders of the box. This will activate the sizing handles, the small dark dots on each side of the box. 2. Place the cursor over the right border s mark which will turn the curser into a two sided arrow. Click and drag the box to the left to reduce the empty space. Resize a Field: 1. Click on the field (RQ_PROB_TY). 2. Click on the right sizing handle and drag to the left (to about 7.5 in the top ruler). Deleting a Field Delete a Field: 1. Click on the field (RQ_PRTY_TY) to highlight it. 2. Press the Delete key OR Field Movement Right click in the field and select Delete 1. The simplest form of moving fields is by clicking on the field and dragging it to the new location. a. Click on the Priority text object (resize to reduce the empty space). b. Drag to the right until the left edge is aligned with the 5 mark. 2. Multiple fields can be moved by holding the shift key down while clicking on the fields. This will highlight the fields which can then be moved or sized or formatted all at the same time. The click and drag feature, as well as the adjustment of the box size, are done to the highlighted box with the four dark marks on the edges (anchor box). Multiple fields may be copied or cut as a unit as well. 3. Multiple aligned fields can be moved as a unit by attaching Guidelines to the fields. This can be done both horizontally and vertically using the rulers at the top and left side of the report (if this option is turned on). a. In the top ruler, click near the 6 mark and hold, moving slightly if necessary, until the dotted line meets the left side of the Problem text box. Release The left side of the text box will appear red and there is a pointed box in the ruler section. Beginning Crystal 1 28
 This will move any fields attached to the guideline. Note: Caution should be used with guidelines if there are a number of fields in the report.")
29 b. The left edge of the RQ_PROB_TY field will likely be red as well but if not, click on the field and drag to attach the left side to the guideline. c. To move the fields attached to the guideline, click on the ruler marker and drag it to the new location. (about 6 5/8 ) This will move any fields attached to the guideline. Note: Caution should be used with guidelines if there are a number of fields in the report. You may attach fields you had no intention of moving. This is a problem that can affect Lucity Detail reports. d. To remove a marker, click on it and drag it up and away from the ruler. Then, release your mouse. e. All markers can be removed with a right click in the ruler or body of the report and then selecting either Remove All Vertical Guidelines and/or Remove All Horizontal Guidelines. Add a Text Object Make sure there is room to add the text object. In the example we will create space between the Status Date and Priority: 1. Reduce the size of the Status text object to close up the empty space. 2. Reduce the RQ_STAT_TY field (right edge to 3 1/4 ). 3. Move the Status Date text object field to the left (right edge 4 1/8 ). This has opened up space to add a new text object. 4. Click (release don t drag) on Insert Text Object. The cursor turns into a plus sign. Example 3 5. Click on the location where the box is to be inserted. Just to the right of the Status Date text object. 6. Type in the desired text (Follow-Up). 7. Click out of the box when you are finished. Beginning Crystal 1 29

30 8. Resize to close up the empty space. In the example it is overlapping the Priority text object. It doesn t hurt anything but may hinder your design efforts later. Adding Fields To add a field, you may need to make room by moving or removing existing fields. 1. In our example, we ll change the Priority column to Category. o First, you ll edit the Priority column header to read Category. The RQ_PRTY_TY field has already been deleted. 2. Now, you ll add the new Category field. 3. You ll need to find out the name of the Category text field. a. Go back to the Requests module and locate the field that is to be shown in the report. b. With your cursor in the field, press Ctrl and then right click. c. Select Field Definition. Some fields, including the Code field, have an additional option, Field Properties. This option offers additional information such as the field Mask and Editing options. In the example, you can see that the table name is WKREQ and the Category field name is RQ_CAT_TY. Note: Sometimes fields that have a code box and a text box will only show the field definition of the code portion. The only difference with the text portion is that the field name would end in TY rather than CD. Sometimes if the box is pulling information from a different module, the field definition will not show up or the given field name may not be accurate. It may be a connecting field to pull the correct data from another table. 4. Return to the report. Then, complete the following steps to add the new field. a. Open Field Explorer. (Also under View in the top menu bar.) This may already be open on the right of the report. b. Open Database Fields (click on the + sign). Beginning Crystal 1 30


31 c. Open the WKREQ table (click on the + sign). d. Click and drag the RQ_CAT_TY field and place it in the Detail section under the Category column heading. When a field is used in the report, a check shows up next to it in the Field Explorer. 5. We will now add the X and Y Coordinate fields: a. Change the Address text object to X Coord. b. Reduce the box width to close up the space. c. Add another text object called Y Coord to the right of the X Coord. d. Right align both the X and Y Coord text objects. e. Delete field. f. Add the appropriate fields below the X and Y column headers. Beginning Crystal 1 31
 had been filled out for the report then several of these fields would have been available to bring into the report (File Author, Report Comments and")
32 Special Fields There are a number of Special Fields that Crystal Reports provides. In Field Explorer expand Special Fields. The report is currently using Page Number, Print Date and Print Time. If the Summary Info (from File in the toolbar) had been filled out for the report then several of these fields would have been available to bring into the report (File Author, Report Comments and Report Title). The File Path and Name could be a helpful field to place in the Report Footer. This would tell you exactly where the report is located and the exact report name (LC_ReqSum.rpt). Beginning Crystal 1 32
33 Copying Fields A field that is used in a report can be copied and used elsewhere in the report. There are various methods for doing this. o Click on the field(s) and: Right click Copy and then right click Paste to the new location. Or - Ctrl C to copy then Ctrl V to paste in the new location. Or for a single field - hold Ctrl, click and drag to new location and release. Formatting Fields General Formatting If you want a field to stand out, there are various tools you can use. You can change the lettering size, font or color of the text as well as change it to boldface, italics, or underline. The options are located in the Formatting Toolbar (pictured below). Formatting can also be accessed by right clicking on the box and selecting Format Text (For a text object) or Format Field (For a field with data). o o Click on the box containing the text you wish to change. Then, select the options to be used. If partial text is to be changed, double click on the box and then click and drag over the part that is to be changed. Note: For Web reports avoid the use of the Calibri font. There are issues with viewing the report as PDF. In the example report change the column header text objects to be Bold. 1. Hold the shift key down and click on all boxes that need changing. 2. Click on the B (for bold) in the toolbar. 3. Resize any boxes to accommodate the bold text. Preview the report. The X and Y coordinates are showing with two digits to the right of the decimal and the actual values in the record require 8 digits. Number Formatting Number fields may require formatting for many reasons such as decimals, rounding, negatives, field size where the value is showing ##### or the numbers are cut off. The field size can either be increased, or the field can be reformatted to remove the decimals. Beginning Crystal 1 33


34 To change the format of the RQ_X_COORD field: 1. Right click on the field and select Format Field. 2. Click on Customize Beginning Crystal 1 34

35 3. Click on the down arrow next to Decimals: and select the correct option for the number of digits. 4. Repeat for Rounding. 5. Select OK to close the Custom Style dialog. 6. Select OK to close the Format Editor dialog. In the preview tab the X Coordinate value is now showing: 7. Increase the field size with the sizing handles on the field. Another issue that sometimes occurs is the clipping of numbers. This is where you see incomplete numbers instead of the ###.##. This is not recommended. This option is located in the Custom Style dialog box. Make sure the Allow Field Clipping box is NOT checked. Beginning Crystal 1 35
36 Copying Formatting The Y Coordinate will need similar formatting. The Format Painter can be used to copy the X Coordinate formatting onto the Y Coordinate field as follows: 1. Click on the RQ_X_COORD field. 2. Select the Format Painter in the Standard Toolbar. 3. Click on the RQ_Y_COORD field. 4. Increase the field size to accommodate the additional digits. Note: Many cost fields within Work reports are fields that will be Hidden if the person running the report does not have the proper security. The way this is achieved turns the number field into a Text type field thus normal number formatting does not work on these fields. Alignment of Fields 1. Shift click on all fields to be aligned. Example 4 2. Right click on the field you want to size and align with, the darker markers will show up on the field you select. 3. To size, click Size > Same Height. 4. To align, repeat steps 2 and 3, clicking Align > Tops (or Bottoms, see what looks better). 5. Do this for both the Column Headers and fields in the Detail section. Note: If a section has only a single line of fields, then all fields can be selected by right clicking in the left margin of the section and selecting Select All Section Objects. This option wasn t available in our example due to the line in the Detail section. Using Formulas Example 5 Crystal provides a way to create formulas that can be used in record selection, conditional formatting, conditional suppression and calculations to name a few. Date and Time Fields In Lucity the date and time fields are a DateTime type field. If the Date field is brought in directly with the Options (File > Options > Fields > Date and Time > Date and Time) set as System Default Short Format, the date field when brought directly into the report will look like this: The time portion is not a good value. In the same way the Time field will look like this: The date portion is not a good value. Beginning Crystal 1 36


37 In File > Options > Fields > Field format the Date and Time type field could be set up to always show a date (without time) but then the time field would also show as a date. Each field s format can be set case by case to either show the date or time portion but the best practice is to handle the DateTime fields with a formula. The formula will take out the required portion of the field. Note: Formula fields begin with symbol like the Status Date. Date Fields In our example, we will add the Follow-Up Date. 1. Within Field Explorer, right click on Formula Fields. 2. Select New. 3. Type in the name. For our example, we ve entered FollowUpDt. 4. OK This will open the Formula Workshop. It would be helpful to have the Hide/Show workshop tree highlighted as well as the Field Tree, Function Tree and Operator Tree. Beginning Crystal 1 37
 10. In the Field Tree expand the ODBC database. In this case it is Work. 11. Expand the WKREQ table. 12.")

38 5. Expand the Function Tree, Click the plus sign (+) in front of Functions. 6. Expand Date and Time. 7. Expand Date. 8. Double click the Date(dateTime) option. 9. The following formula will show up in the lower box work space of the Formula Workshop: Date() 10. In the Field Tree expand the ODBC database. In this case it is Work. 11. Expand the WKREQ table. 12. Make sure the cursor is flashing between the Date parentheses in the formula box, then in the Field Tree double click RQ_FLLW_DT. The final formula will look like this: 13. Click Save and close. The new formula will now show under the Formula Fields in Field Explorer. 14. Drag the new formula field into the Detail section, under the Follow-Up column header. Time Fields A Time field which is also a DateTime type of field should also be set up in a formula. It would be created like the date formula except in the Formula Workshop in the Functions Tree the Time option would be used to create the formula. Beginning Crystal 1 38
39 Note: Once the date has been pulled from the DateTime field in the Date formula it will follow the formatting in Options for Date. In a like way the Time formula will now format as a Time field. This can be changed in a general way out in Options or specificly with the right click Format Field option. Note: Formulas created in the Formula Workshop can be typed in without using any of the Tools. The Tool Fields, Functions and Operators may also be dragged in as opposed to double clicking. Documentation Comments Comments can be made within the Formula Workshop to help with documentation. The comments can be in a separate formula documenting all of the changes for the report or they can be specific comments to a formula. Each line of a comment must be preceded by two forward slashes //. This will change the font color (default green can be changed in File > Options > Formula Editor). A general comment will be added to the example. 1. Right click on Formula Fields and select New. 2. Type in Comment. 3. In the lower section, type //. 4. Next, type whatever clues you need to remember what was done. We ll type: Removed Priority and Address. Added Follow-Up date, Category, and X & Y coordinates. 5. Select Save and Close. 6. Drag the Comment formula to whichever section you will see it, like the Page Header. This will not show up in the Preview mode of the report but it is there for you to reference in the future. Beginning Crystal 1 39

40 Inserting Lines and Boxes Lines When reports have a great deal of information, it is often helpful to use lines to break up the data. This makes it easier to read. 1. Click on Insert Line. This turns the cursor into a pencil. 2. Place the pencil point wherever you would like to insert the line in the report. Then, drag the line across the screen until you have reached the desired length. 3. The line characteristics can be modified by right clicking on the line and selecting Format Line. Several line samples appear below 4. If any of the fields above the line are able to grow then in the Format Line dialog (right click on the line) select Move to Bottom of Section when Printing. This usually solves any growing issues, but sometimes the line should be given its own section instead. o A new section can be added by right clicking in the left margin next to the section and selecting Insert Section Below. These options can also be selected by typing the underlined letter. The I is underlined. All Crystal sections allow multiples. They will show with a letter behind the section designation. Example: Details a, Details b, Report Footer a, Report Footer b Example 6 Beginning Crystal 1 40

41 Boxes Another option is enclosing data in a box. In the example we will place a box around the Total Requests text object and field (#TotReq). 1. Click on Insert Box. This turns the cursor into a pencil. 2. Place the pencil point wherever one corner of the box should be (top left of Total Requests box) and then drag diagonally to the other corner (bottom right of #TotReq box) and click. 3. Right click on the box line and select Format Box 4. Select Fill:>>Color: 5. Use the drop down arrow to select Yellow. 6. Click OK Example 7 Beginning Crystal 1 41

42 Growing Fields Sometimes the data in a field is cut off and there is no more horizontal room to increase the field size. In this case, it is helpful to allow the information to be shown in multiple lines. This can be done with the Can Grow option. To add or delete the Can Grow option, complete the following: 1. In the example, right click on the field (RQ_CAT_TY). 2. Select Format Field. 3. On the Common tab, check the Can Grow box. The Maximum number of lines should be 0 to see all of the data in the field. This will scroll the data vertically. If the Can Grow option is unchecked then in most cases the data will cut off when reaching the limits of the field size. This is not the case for the Advanced View in the Web. The field will grow horizontally to the right and overlap any field to the right. This can be corrected by using the Can Grow option with the Maximum number of lines set at 1. Beginning Crystal 1 42
43 Report Manipulation Lucity typically provides a Summary report and a Detail report for each module. The Summary report is great for a quick overview of many records. The Detail report usually shows all of the fields within a module. It is much easier to delete fields and sections and move things around than it is to add information. We ll go over the steps to manipulate a report below: 1. Copy the ReqDetail.rpt report. This copy is just to play with so does not need to be exported or saved. (Copy and Paste) 2. Open ReqDetail Copy.rpt. 3. Removing Sections: If a section type has multiples (a, b, c ) then all but one may be removed by right clicking to the left of the report section and selecting Delete Section Right click on the left margin of the Detail g section and select Delete Section. The g section is removed and the Details sections will now rearrange their lettering. The old h section is now g. Some Sections cannot be removed but the information within them can be deleted. Right click in the left margin of the Page Header section and choose Select All Section Objects. Then press delete. Another option is to suppress a section. Right click in the left margin of the Detail c section and choose Suppress (No Drill- Down). 4. Moving fields around within a report can be challenging. In this example, Detail a section, we will move Home Phone and Work Phone up to just below Phone Number. a. To make room for these fields, place the cursor to the left of the report on the right edge of the ruler strip where the field is to be inserted. You ll see a single line with double arrows. b. Click, hold, and slightly wiggle, pulling to the right as you release to create a section break. c. Click and drag the section break line to make room for the new fields. d. Hold the Shift key and click Home Phone, RQ_HM_PHN, Work Phone and RQ_WK_PHN to highlight the fields to be moved. e. Click and drag the fields beneath Phone Number. f. Right click in the Details section next to Phone Number and select Merge Section Below. Note: The Merge function may have caused the check next to Do Not Disclose to disappear. Right click on the check box and select Move >> To Back. 5. Report sections can be switched by clicking and dragging to the new location. o Click and drag section Dk to beneath Da. This is now the new Db section. 6. The report page orientation is another way to add room or shrink a report. Landscape mode is always helpful if you need to add a couple of fields or see all of the text on one line. This option is found in File > Page Setup... > Orientation. Example 8 Beginning Crystal 1 43

44 Removing Parameters Parameters are special fields that query the user for information to be used in the report before the report will run. Common parameters used in Lucity reports include subtitles and date queries. o These can be removed by clicking on the Parameter field and selecting Delete. The report no longer uses the parameter field, but the parameter exists in Field Explorer. Unused parameter fields have been an issue in some of the Web reports. To permanently remove the parameter field in Field Explorer: o o Right click on the specific parameter field and select Delete OR Click the parameter field and press the delete key. Parameter fields are recognizable by the? at the beginning of the field: In V2016r2 there are two new options available through the Admin Portal to suppress the subtitle parameter for Dashboard and/or Web reports. Inserting an Agency Logo You may want to have your agency logo appear on your customized reports. This helps identify the report as one of your own. The image to be added to the report should be a Bitmap, TIFF, JPEG or PNG type. To insert an agency logo in our example report (LC_ReqSum.rpt), complete the following steps: 1. You may need to make space in the report for your logo. a. Right click somewhere to the left of the report in the Page Header section and select Insert Section Below. b. In the new PHb section left margin, click and hold, the cursor should turn into a hand. c. Drag up into the PHa section and release. The two sections have switched places. d. Place the cursor over the line between sections PHa and PHb (it should turn into double horizontal lines with an arrow pointing up and one pointing down). e. Click and drag down to increase the PHa section size so that it can accommodate the logo. 2. To insert a logo into the Page Header a section, perform one of the following steps: OR o Click on Insert and select picture. o Click on the Insert Picture icon. Beginning Crystal 1 44


45 3. Browse out to the location of your logo file and double click to add it to the report. 4. You can resize the logo by clicking and dragging the corners and edges. You can change the placement of the logo by clicking and dragging the entire picture. 5. Resize sections as necessary. 6. Finally, right click in the Page Header a section and select Merge Section Below. You now have one Page Header section. Save and Close the Report. Adding a Report to the Module To use any new or revised reports within Lucity, you ll need to add them to the module where you wish to view them. The reports need to stay within the family for which they were created. For example, you may not run a Work report in Sewer modules. 1. Open the desired module. (ex. Requests) 2. Click on Reports. 3. Select Add. 4. Click on the box with three dots next to Report File Path. 5. Find the report directory with the new report and double click on the report (LC_ReqSum.rpt). 6. Enter the report name and give it a description. 7. Select Save. This report is now available to be used within the module. Example 9 Accessing Reports in Lucity Within a module you may use any of the reports available in the reports dialog box. Frequently used reports can be added to the Quick Reports option (drop down arrow next to the Report icon). This can be set up in the Reports dialog. Right click on the Report Title and select the type of Quick Report you would like saved. This setting is on a User Login basis. This allows various users to set up their own Quick Reports in whichever manner they d like to see them. Beginning Crystal 1 45

46 The report will be displayed with the hand icon before the report name. Another means to access a frequently used report is to simply add a number in front of the name to bump it to the top of the list. Datasource If standard reports are copied and pasted instead of exported and then run or verified in the Crystal software, the original Lucity connection information is maintained, but the connection information specific to the customer s database won t be available. Thus, the report will be unable to find the proper database tables. You should receive a warning message similar to the following Select No: If you receive the warning message displayed above, you have the following options: Delete this copied report and export the report from the Lucity module. This process was explained previously. You can manually point each table in the report to the correct datasource. The above options will repoint the connection strings. This will allow you to run the report in Crystal Reports, which is the quickest way to test the report modifications. Beginning Crystal 1 46

47 Set Datasource Location Below, we ve described the steps needed to set the Datasource Location for reports with database connectivity errors. Remember, you ll need to complete these steps if you ve performed a Save As or copied and pasted a report and received a warning message informing you that certain database tables could not be found. 1. Within the open report, click on Database in the toolbar at the top of the screen. 2. Click on Set Datasource Location. The following dialog will appear: 3. In the bottom window, open the Create New Connection folder. 4. Open ODBC. You ll see the dialog displayed on the following page: Beginning Crystal 1 47

48 5. In the ODBC dialog, click on the correct Datasource name and then click Finish. o For example, here we ve selected GBAWork001. Notes: Beginning Crystal 1 48

49 6. You ll return to the Set Datasource Location dialog. Now, open Tables in the bottom window. Beginning Crystal 1 49

50 7. Next you ll have to click on each table in the top window (Current Data Source) and find its match in the bottom window (Replace With). Click on the matching table name and then press Update. o As you can see in the example below, we ve selected the WKREQ table in both windows. 8. After updating each table listed in the top window, click Close. Note: Make sure to perform these steps with the Subreport tables as well!! Note: If the matching table names don t appear in the bottom window, open the Synonyms or Views tables and look for them there. Once the database is unified (version 2015R2 or later) Synonyms or Views should not be necessary unless the client has created a special View. If the database is unified and the table list cuts off, not showing the bottom of the alphabetical list, then check the Options Database tab and make sure the Stored Procedures is unchecked. Beginning Crystal 1 50

51 9. If a field type has changed or been removed from the table since the report was last updated then there will be an issue with Field Mapping and you will see something similar to this: Sometimes unchecking the Match type checkbox will show the field to Map To but sometimes it doesn t. In Lucity 7.5 Work module > Tracking grid, the Tracked Item and Description fields were changed from a Text type field to a Memo type field. There was no option to match the Unmapped Fields to so selecting OK allowed the rest of the mapping to complete. When going into the Tracking subreport, these fields had been removed. These fields needed to be manually brought back into the report with the new field types. The fields have the same name; they are just a different type of field that allows more data. Beginning Crystal 1 51
52 Converting Desktop Reports to use in the Web Custom Reports that have been created for the desktop version of Lucity will NOT work in the Web application as is. To convert a report from a desktop Lucity report to a Web report, complete the following steps: 1. Make a copy of the desktop report and give it a new name (maybe add Web to the end of the file name). Open the Web report in Crystal Reports. 2. Go to Database >> Set Datasource Location. o o SQL Server Clients select OLE DB (ADO) >> Make New Connection. Oracle Clients select Oracle Server. Beginning Crystal 1 52


53 3. If you are using SQL Server you will then be prompted to select a provider. Use the Microsoft OLE DB Provider for SQL Server as shown below. 4. Next, enter the Connection information. o For SQL Server, include the SQL Server Name, User ID, Password, and Database. Beginning Crystal 1 53
 map every table from the report one at a time. Don t forget the tables in the Subreports!")
54 o For Oracle, include the Service, User ID, and Password. 5. Once you create a connection you will need to individually (manually) map every table from the report one at a time. Don t forget the tables in the Subreports! Note: The converted report needs to be added to the appropriate module in Web. Beginning Crystal 1 54
55 Using Crystal Reports with Lucity Beginner 2 The second of a seven-part series, this workbook is designed for new Crystal Reports users. You ll learn how to add selection parameters to a report including date ranges, secured fields, and selection categories. We ll also show you how to sort and group the report data. Finally, we ll show you how to add summaries and running totals to a report. The screen captures in this workbook are taken from Crystal XI. Depending on which version of Crystal you are using, your screens may vary slightly. Table of Contents Section Options... 3 Section Expert... 3 Formatting Multiple Columns... 4 Additional Options... 6 Multiple Reports... 6 Parameters... 7 Date... 7 Record Selection with Parameters... 9 Adding Parameters to the Report Title Formula Option Text Object Option Secured Fields (Main Body of Report) Field Viewing Options Field to Show Blank Field to show Hidden Logged in User ID and Logged in Employee Code Web Only Static and Dynamic Selections Static Selections Dynamic Selections Using the Selection Parameter Dynamic Cascading Prompts Parameter Date Formatting for Entry Sorting Interactive Sorting Grouping... 23
56 Summaries Running Totals Work Order Reports Importance of Grouping Importance of Running Totals Concatenate Fields Address Formula Beginning Crystal 2 2


57 Section Options Each section of the report has a variety of options available to it. To view these options, right click in each section to the left of the report. o Some useful options include Suppress, Hide, Insert Section Below, Delete Section, and Select All Section Objects. The availability of the options depends on the section. Section Expert The Section Expert can be accessed from the above right click menu or at the top of the report in the Expert Toolbar or under Report in the Menu Bar. o Click on Section Expert. You ll see the following dialog: Beginning Crystal 2 3
, New Page After, Keep Together, Suppress Blank Section (used for sub-reports), and Format with")
58 When a Section is clicked on and highlighted, the checked options show what has been set up for this section. Some options that have been chosen elsewhere, such as Suppress, are reflected here. Other useful options include conditional suppression of a section (using the Suppress formula button), New Page After, Keep Together, Suppress Blank Section (used for sub-reports), and Format with Multiple Columns (Detail section only). Caution: The Keep Together option has been known to cause odd blank pages at the beginning of a report or large blank spaces throughout the report. Formatting Multiple Columns You may want to format a report with multiple columns. This is set up with the information in the Details section of the report and may also include the Group section data. To set up Multiple Columns, complete the steps below: 1. Within the Work reports file open LC_ReqSumCol.rpt. 2. Reduce the number of columns to two or three. Keep the Request #, Record Date, and Status fields. 3. Click on Section Expert and choose Details. o If you have multiple Detail sections then you must click on the top Details title (not Detail a) and all of the Detail sections will be duplicated. Individual Detail sections do not have the Format with Multiple Columns option. 4. Click on Format with Multiple Columns. o Note the addition of the Layout tab below: Beginning Crystal 2 4

59 5. Click on the Layout tab. a. You must enter a size for the column section in the Detail Size. Figure out how wide the first set of columns are from the ruler at the top and then allow at least that much for the duplicate section. b. The Horizontal Gap is the space between the columns. c. The Vertical Gap is the space between each line. d. It is also important to choose a Printing Direction. e. Click OK when you have finished altering the layout. Note: The Format Groups with multiple column option at the bottom of the Layout tab allows this to be used in Grouping (discussed later). The Multiple Column option is not available in the Header section. In order to identify your columns in the header, you ll need to create new column headings or copy the existing ones and paste. The Landscape orientation is no longer necessary. 1. Shorten the Line in the Detail section to Shorten all other lines to Move the Print Date and Print Time right edges to In File > Page Setup > Orientation select Portrait. 5. OK 6. Center Page number. Save Beginning Crystal 2 5

60 Below, you can see examples of the report Design and Preview. Design Preview Additional Options Right click in the main body of the report or Ruler to find additional options. These help with the report design. o These include Snap to Grid, Remove All Vertical Guidelines and Remove All Horizontal Guidelines. Ruler, Guidelines, Grid, and Tooltips can be accessed through View in the top Menu Bar. Multiple Reports To quickly move between multiple reports it can be helpful to view them as multiple tabs. To set up this design, open your first report in Crystal then select File > Open and then open the additional report to be viewed or worked on. The report can be selected by clicking on the tab and closed by clicking on the X. Beginning Crystal 2 6

61 Parameters Parameters are useful in creating reports that are more dynamic. The report will query the user for information and then typically use this in the record selection criteria. A common use of this feature is date ranges, categories and personnel. Selection criteria are usually filtered on from within the Lucity modules. The report is then run using these criteria, and the specific criteria used can be stated in the subtitle. Sometimes, it is helpful to have the report make the selection. In the steps below, we ll show you how to set up these selection parameters in the report. Date In general it is best to set up a date range with two parameter fields. The report query will ask the user to supply a Start Date and an End Date. 1. From Work > Requests, we will modify the Summary of Requests report (ReqSum.rpt). For this example, open LC_ReqSumDt.rpt. 2. In LC_ReqSumDt.rpt open Field Explorer > Parameter Fields. 3. Right click on Parameter Fields and select New. OR Click on Parameter Fields and then click the new icon in the Field Explorer toolbar. Beginning Crystal 2 7

62 4. In the Create New Parameter dialog, include the following: a. Enter a Name. For our example, we ve typed Start Date. b. Select the type of data that the parameter field will be. In our example, we will choose Date. Note: There is an option for DateTime which would correspond with our field type but in the report we have pulled the Date portion out of the field using the Date formula. If you had used the DateTime type then the user would have to enter the irrelevant Time portion of the field each time they ran the report. c. Under Options the Prompt Text is automatically filled in with Enter (Parameter Name). This prompting text can be revised by clicking in the box and adding or subtracting text. (We have added for Status Date Range.) d. OK 5. Repeat this procedure for End Date. There are now two parameter fields (Start Date and End Date) that can be used in the selection criteria and in a date title. Note: Even though the parameters have been created, the report will not use them unless they are put in the selection criteria. Beginning Crystal 2 8

. 3. Select OK.")

63 Record Selection with Parameters To use your newly defined Date parameters in a report to select records, complete the followings: 1. Click on Select Expert 2. Click the Status Date Formula (StatDate). 3. Select OK. The dialog displayed below will appear: 4. Select from the drop down boxes the appropriate criteria: Beginning Crystal 2 9
 to the correct order.")

64 5. Then, if you would like to view the formula for the Selection Criteria that you have created, click on Show Formula>>> Note: There is an option to Set Parameter Order when you right click on Parameter Fields in Field Explorer. This is the order in which you will be queried. You can click and drag the parameters (or use the arrows) to the correct order. Adding Parameters to the Report Title Once you ve added Date parameters to a report, you ll want to add that data to the title section. This helps you know which dates are reflected in the report. You can manually enter the dates in the Report Subtitle parameter query. OR You can create a Formula to automatically state the dates selected and place in the Title section. OR You can create a Text Object and bring in the dates. Formula Option 1. Right click on Formula Fields and select New. 2. Enter a descriptive name. For our example, we ve typed Status Date Range Title. Beginning Crystal 2 10

65 3. Select OK, then type in the following: "Status Dates Between "&{?Start Date}&" and "&{?End Date} The parameter fields can be selected from the Report Fields. 4. Now, either remove the Report Subtitle or create some room in the Page Header section to drag Date Range Title formula into the Page Header. Text Object Option 1. Click on Insert Text Object and place below?report Subtitle. 2. Type Status Dates Between and 3. Increase the box size to accommodate the addition of the Date parameters. 4. From Field Explorer > Parameter Fields, drag the Start Date in front of and and the End Date behind and. Add spaces as needed. Example 10 Beginning Crystal 2 11
66 Secured Fields (Main Body of Report) Sometimes fields should be hidden in reports if the person viewing the report does not have the proper level of security. This can be done by using parameters and formatting options. Note: This will only work for fields in the main body of the report. Fields that need to be hidden in subreports will be addressed in our related workbook, Advanced Crystal 3. Many cost fields in Work Order reports are set to use the Hidden option. Sometimes you may wish to suppress the fields completely. The following steps are provided so you can set up your own field security (step 7). 1. From Work > Work Flow Setup > Employees module, we will modify the Employee List Report (EmployeeList.rpt). From the Work report folder open LC_EmployeeCost.rpt. 2. Modify the Department text object to Unit Cost. 3. Add a text object to the right called Overtime Rate. 4. Remove the EM_DEPT_TY field. 5. Add from the WKUEMP table the EM_UNIT_C field beneath the Unit Cost heading. 6. Add from the WKUEMP table the EM_OVERI_C field beneath the Overtime Rate heading. 7. Right click Parameter Fields and select New. 8. Type in the Name - ViewSecuredFields. This is a special parameter field that must have this name ViewSecuredFields. When the report is run within Lucity the security is passed to the report and will not query the user. If the report is run outside of a Lucity module, in Crystal, then the security will be queried. If the report is refreshed, it will ask for the parameters again, including the permission to view the secure fields. At this point you can change the security value the report will run with. 9. Select the Type > Number and under Options > Discreet Value -True. 10. Click OK. Field Viewing Options Field to Show Blank For a blank field to show up when the user does not have rights to view the secured fields, do the following: 1. Right click the field that requires suppression (EM_UNIT_C) and select Format Field. 2. Click the Common tab. 3. Click the formula box next to Suppress. 4. Double click the ViewSecuredFields parameter from the Report Fields. Beginning Crystal 2 12
67 5. Type = 0. {?ViewSecuredFields} = 0 6. Click Save and close. 7. Click OK Field to show Hidden For the word Hidden to show up when the user does not have rights to view the secured fields, do the following: 1. Right click in the field that requires suppression (EM_OVERI_C) and select Format Field. 2. Click the Common tab 3. Click the formula box next to Display String. 4. Type in: if {?ViewSecuredFields}=0 then "Hidden" else "$"& ({WKUEMP.EM_OVERI_C}) Note: The inclusion of the dollar sign is because once the formula brings in the word Hidden, the formula requires the outcome to be text. The field will not allow number formatting. Using the & for joining is an implied to text for the number field. If a + had been used for joining, then a conversion would have been necessary +(totext({wkuemp.em_overi_c})). 5. Click Save and Close. 6. Click OK If the user did not have permission to view Employee costs, then because of the field set ups, the Unit Cost is blank and the Overtime is showing Hidden. It would be helpful to make a notation at the bottom of the report to explain why some of the fields are Hidden, such as: A Hidden field indicates permission to view the secured field is turned off. Logged in User ID and Logged in Employee Code Web Only For versions 7.4 or later the Logged in User ID and Logged in Employee Code can be brought into the report straight from Lucity. This information is being brought in from the Employee module in Work and is set up much like the ViewSecuredFields parameter. Beginning Crystal 2 13
68 For the User ID, create a new parameter called LOGGEDINUSERID. For the Employee Code, create a new parameter called LOGGEDINEMPCODE. Both parameters are String type fields. Drag the parameter fields into the report. When the report is run from Lucity, these fields will populate with the correct Logged in User information. Static and Dynamic Selections A pick list of values to use in a report is possible by using parameter fields. An example of this use will be shown in selecting Categories. 1. From Work > Work Flow Setup > Category, we will modify the Category with Problem and Task Report (CatProbTask.rpt). From the Work report folder open LC_CatProbTaskCat.rpt. 2. Right click Parameter Fields and choose New. 3. Enter the Name (Category). Beginning with version 2015, Lucity Web will support dynamic parameter selections but requires the Name to be that of the specific field. (See Dynamic Selections) 4. Enter the Type (String). 5. Choose the List of Values type. Set up as either a Static Selection or Dynamic Selection. (Discussed next) Static Selections This allows selection from a set list of values for a specific field. 1. Next to List of Values: select Static. 2. Under Value Field select CT_BR_TY (This is the Category text field). 3. If you want to choose specific Categories to be in your selection list, click Insert. 4. Click on the down arrow under Value. 5. Click the Category that you want in your list. 6. For each additional Category, click on a blank line, and then click on Click here to add item, and then click the down arrow for the list. o o If All the Categories should be in the list, click Actions and choose Append all database values. This drop down box is also where you can clear all values in a list. 7. Under Options you may revise the Prompt Text. It has automatically placed the Name (Category) after Enter. 8. Under Options place True next to both Allow discreet values and Allow multiple values. o The True and False options may be changed by clicking on True (or False) which will cause a drop down of True or False to select from. Beginning Crystal 2 14

69 9. Click OK. Dynamic Selections This allows selection from whatever values are in a specific field at the time the user runs the report. Prior to V2015 for this option to be used with Web reports, the report needed to be developed in Crystal 2008 or later and run with the HTML view where the dynamic selection was only available after the report ran initially. Lucity version 2015 Web supports dynamic selection for either Advanced View (HTML) or Basic View (pdf). 1. Create a new parameter named WKCAT.CT_BR_TY. For the Dynamic pick list to show up in V2015 or newer the field name needs to be used. Even if you are using an older version of Lucity, the parameter should be set up this way so it will work correctly when you upgrade. 2. Type is String. 3. Next to List of Values: select Dynamic. 4. Under Choose a Data Source, select New. 5. Then Click either Insert or Click here to add item. Select the field in question. 6. Edit the Prompt text if desired. 7. Select Options Beginning Crystal 2 15

70 8. OK Note: For Web reports, make sure the Show on (Viewer) Panel option is set for Editable. Using the Selection Parameter You must now add this selection criterion to the Select Expert. Static parameter {WKCAT.CT_BR_TY} = {?Category} Dynamic parameter {WKCAT.CT_BR_TY} = {?WKCAT.CT_BR_TY} Beginning Crystal 2 16

71 When the report is run and the Category parameter is queried, it will appear similar to the following example. Below, we have selected a group of Categories by clicking on Curbs. Then shift/click on Engineering Then the > button Individual Categories can be moved by clicking on the Category and then the > button. All of the Categories can be selected by using the >> button. Another helpful way to select Multiple values is selecting the value then holding the control key(ctrl) down and selecting additional values, then moving these values over with one click on the > button. The Remove and Remove All buttons work with the Selected Values: window. OK Example 11 Beginning Crystal 2 17

72 Dynamic Cascading Prompts A dynamic cascading prompt allows the user to choose first one selection criteria and for this chosen selection then choosing a second one. Possibly Web only. There have been issues using this with Crystal XI which is what Desktop runs. For a Sewer Pump Station report a parameter was created to choose a Pump Station and then once the station was selected then the pumps were selected from a list of pumps associated with the station. The selection criteria within the Select Expert would be set up like this: {SWPUMPS.PM_PUMP_NO} = {?SWPUMPS.PM_PUMP_NO} and {SWSTATN.SN_STN_NAM} = {?SWSTATN.SN_STN_NAM} When running the report in Web the following prompt would show up: Beginning Crystal 2 18


73 It does not use the cascading feature. If the report uses the Advanced View and is rerun with the parameter tab it works correctly: Parameter Date Formatting for Entry Crystal expects dates to be entered as yyyy-mm-dd. A client wanted to be able to enter dates mm-ddyyyy. To get around the standard Crystal formatting, the date parameters were set up as string fields instead of date fields. Beginning Crystal 2 19
] Note: Later versions of Crystal allow the parameter date entry in the mm-dd-yyyy structure.")
74 When the parameters were used in the Select Expert they were converted to Date type fields. Date ({WKRESRCE.WR_END_DT}) in [CDate ({?Start Date}) to CDate ({?End Date})] Note: Later versions of Crystal allow the parameter date entry in the mm-dd-yyyy structure. Sorting Sorting is a simple method to view data in your report in a certain order; ascending or descending. Crystal Reports allows sorts within sorts, each sort reflecting its own sort direction. If there is grouping in a report (discussed next), the grouping comes first before any field sorting. Many of the work reports have groupings to deal with duplicate records created in filtering so simple sorting will not work. Additional sorting results can usually be accomplished with additional groups. We are going to set up a simple sort within the LC_ReqSum.rpt report (created in the Beginning Crystal 1 document). The following steps will set up a sort on the Category then within Category a sort on the Problem. 1. Click Record Sort Expert. 2. Choose the field to be sorted by. This is typically found in the Report Fields. o Click on RQ_CAT_TY and move to the Sort Fields box by pressing the > button. 3. Then select the Sort Direction: Ascending or Descending. 4. Repeat this for the RQ_PROB_TY field. Each field s Sort Direction is independent of the other fields to be sorted on. Beginning Crystal 2 20
 report.")

 to use the correct sorting parameter.")
75 Interactive Sorting To create a report with a choice of sorting, we will modify the Summary of Requests (ReqSum.rpt) report. From the Work report folder open LC_ReqSumSort.rpt. 1. First we will create a Static parameter formula to list what the sorting choices are. (Sort By) 2. Using Formula Workshop, create a formula (Sort) to use the correct sorting parameter. 3. Place this formula in the Detail Section. 4. Use the Format Field option to hide formula field by Suppressing. Beginning Crystal 2 21


76 5. Place formula under Sort Fields: in the Record Sort Expert. Preview The following prompt will appear. The drop down arrow will show the fields to be sorted by. Example 12 Beginning Crystal 2 22
 report. 1. From the Work report folder open LC_ReqSumProbGr.rpt. 2. Change the Report title.")

77 Grouping Grouping is a powerful tool and relatively easy to use. It is particularly helpful when creating summaries or counts. We are going to add a grouping on Problem to the Summary of Requests (ReqSum.rpt) report. 1. From the Work report folder open LC_ReqSumProbGr.rpt. 2. Change the Report title. For example, we ve titled this report: Requests By Problem Report. 3. Select Insert Group. If the field you wish to Group By is currently in the report, click on it to highlight it and then press the Insert Group button. It will automatically group on the field; however, you may also use the drop down box to select the field to group on (RQ_PROB_TY). 4. Choose any pertinent options. Beginning Crystal 2 23

78 o o Group Header (GH1) and Footer (GF1) sections have been added. The Group #1 Name is the field that this report was grouped by. Preview The Problem is now being shown twice, once as a Group Header and again as a column, so we will eliminate the Problem column. We will create a separate section with the column headings (Page Header b) because there is currently no room to fit Problem above Request #. (next page) Beginning Crystal 2 24
. 6.")
79 5. On the left-hand ruler, find the spot where you want the break to occur. It should appear just above the column titles. o Click and hold the mouse over that spot and move the cursor slightly, pull to the right and release. A new break line is formed. The section with the column titles is Page Header b (PHb). 6. Increase the size of Page Header a by dragging down the bottom line of this section. 7. Drag the Problem column title above Request # in the Page Header a section. Format bold. 8. Left align the Group #1 Name field to the Problem text box. 9. Delete the Problem field (RQ_PROB_TY). 10. The address formula could be moved over (left side at 6 ). 11. In File > Page Setup, change from Landscape orientation to Portrait. 12. Adjust lines and Page Header fields to fit in the Portrait orientation. Preview Beginning Crystal 2 25

80 Note: Like when Sorting, Grouping can be nested; a Group within a Group. If multiple groups had been used then they could be switched around by clicking and dragging on the sections. Summaries You may want to know the total count of each individual group. The summary option can be used for this purpose. Continue with the LC_ReqSumProbGr.rpt report. 1. Click on the field that you wish to count. (RQ_NUMBER) 2. Select Insert Summary. The Insert Summary dialog will appear: The field to summarize (RQ_NUMBER) should already be in the field to summarize. 3. Select the type of Summary (Count). 4. Choose the summary location (Group#1) and click OK. There is now a subtotal for each Problem group. o You may want to add some lines and make the group subtotal bold for easier reading. Beginning Crystal 2 26

81 Preview The report already has a Grand Total but if you needed to create one you could repeat the process and choose Grand Total (Report Footer) in the Summary location box. The summaries will automatically be dropped into the report wherever Crystal seems to think it should go. Click and drag the field and reformat it to fit your needs. Running Totals The Running Totals feature is used to add a list of numbers cumulatively. The various options offered within the Running Total dialog have rendered the use of variables (discussed in later documents) obsolete in some cases. In this example we will create a count on the number of Work Orders per Category. 1. We will modify the Work Order Summary Report (WOSum.rpt). From the Work report folder open LC_WOSumRunTot.rpt. 2. Create a new group on Category (WO_CAT_TY). 3. Shift the Category group to Group 1 by clicking and dragging it into position. 4. Delete the Category Column. 5. Move the Main Task and Address columns to the left about 1 ½ inches. Beginning Crystal 2 27
. 9. Choose the Field to Summarize (WO_NUMBER). 10. Choose the Type of summary (count). 11.")
82 6. Change the Report title to Work Orders By Category Report. 7. Within Field Explorer, right click Running Total Fields and select New. The Create Running Total Field dialog will appear. 8. Type in a name for the Running Total Name (i.e. WO Count). 9. Choose the Field to Summarize (WO_NUMBER). 10. Choose the Type of summary (count). 11. Choose how the report will Evaluate the Work Order Number field. o On change of group WO_NUMBER 12. Choose when to Reset. o On change of group - WO_CAT_TY 13. Then, click OK. 14. Add a text object for a column header (No. WO) just to the right of Address. Beginning Crystal 2 28
. We will now add a count of Work Orders greater than $200 per Category.")
. 18. Choose the Field to Summarize (WO_NUMBER). 19. Choose the Type of summary (distinct count). 20.")
83 15. Drag the Running Total formula (WO Count) under the No. WO column header into the Group footer 1 (GF1) section. The Running Total formula has a pound sign # in front to distinguish it as a Running Total type field (#WOCount). We will now add a count of Work Orders greater than $200 per Category. This will use a formula for evaluation. 16. Within Field Explorer, right click Running Total Fields and select New. The Create Running Total Field dialog will appear. 17. Type in a name for the Running Total Name (WOCount>200). 18. Choose the Field to Summarize (WO_NUMBER). 19. Choose the Type of summary (distinct count). 20. Choose how the report will Evaluate the WO_NUMBER (Use a Formula). o Type in the following formula: {WKORDER.WO_TOTCOST}>200 Choose when to Reset (On Change of Group- WO_CAT_TY). 21. Then, click OK. 22. Create a new column title (No. WO > $200) and place it to the left of Total Cost. Beginning Crystal 2 29


84 23. Drag the Running Total formula (WOCount>200) into the Group Footer 1 (GF1) section under the No. WO >$200 column header. Preview Work Order Reports Example 13 The importance of using Running Totals and Grouping can t be stressed enough for Work Order reports that have summaries. This is only an issue if the report is to be run with a filter on any field that is normally a grid (child) type field such as Location, Task or Resource. Never assume the report will not be used with a filter. Importance of Grouping In the previous report the Work Order information was placed in the Work Order Number Group Footer section. If the information had been put in the Detail section and the report run with a filter on a field that is normaly a grid type field, then the information in the Detail section would show up as many times as the filter is true. An additional Category Cost is added using the Insert Summary tool to help illustrate the point. Beginning Crystal 2 30
 then the report run")
85 The Distinct Count for WO>$200 has been changed to Count to illustrate the impact of the filter. In the previous example the WO# record has the following Resources: If a Lucity filter had been created to view records that had Employees as Resources (WR_RTYP_CD=1) then the report run in Lucity with this filter would have looked like this: The WO# record shows up twice because there are two Employees in the Resource section. The Total Cost and No. WO >$200 for the Auxiliary Equipment is also double. The No. WO value is correct because we said to evaluate on change of group (WO_NUMBER). Importance of Running Totals The way the report is currently set up, the information is placed in the Work Order Number Group Footer section and the Total Cost Field is in a formula with variables (discussed in later documents). The Cost field could have been brought in simply as a field (WO_TOTCOST). Running Totals could have been used to total the cost for both the Category Group and the Report Total. The following example shows the importance of the Running Total when the report is run with a filter of a field from a grid. instead of the Summary The information is placed in the Work Order Number Group Footer section so it only shows once. The total cost for the Category is shown with a simple summary in Bold and as a Running Total formula in Italic. Beginning Crystal 2 31
86 Concatenate Fields Multiple fields can be joined together in a single formula as opposed to bringing all of the fields in separately. This might be useful for names or address. The concept is simple; however, if any of the fields in a simple + type formula are empty, the formula would show up as blank. The null fields need to be addressed as follows: In the current Work Order Detail Report (WODetail.rpt) the Billing information looks like this: Preview We can create a formula to join the First and Last Names. In the example we will create a formula called Name: In the Formula Workshop the formula can be typed in manually or parts can be brought in from the various workshop sections (Field, Function or Operator). If Then Else can be brought from Operators > Control Structure. Is Null can be brought in from Functions > Print State. (If IsNull({WKORDER.WO_BFIRST}) Then " " Else {WKORDER.WO_BFIRST})&" "& (If IsNull({WKORDER.WO_BLAST}) Then " " Else {WKORDER.WO_BLAST}) This would change the format to: Preview Beginning Crystal 2 32
 Address Formula Another common usage of concatenated fields is the Address field.")
87 Note: The ampersand (&) operator may be used instead of the plus sign for string concatenation. This will perform an implicit conversion when the formula uses mixed data types. Total $ & {WKORDER.WO_TOTCOST} instead of Total $ + cstr({wkorder.wo_totcost}) Address Formula Another common usage of concatenated fields is the Address field. Any time a record shows the address as multiple parts ADR_BDG and ADR_DIR then this is a field that uses the address set up in the General section of Lucity. It should be brought into a report as a concatenated formula. The Work Order Location Address is as follows: A null Street Name is not addressed because we do not want to see the formula if there is no Street Name. Example 14 Beginning Crystal 2 33
88 Crystal Report Examples Beginner Training I. Example 1 Export the Sewer Pipe Summary Report (PipeSum.rpt) found in Sewer Pipe Inventory. Save in the Sewer folder as CT_PipeSum.rpt. Open the report and remove the Save Data with Report option. Save. Solution 1. Open Sewer > Inventory > Pipes 2. Open Reports 3. Click All Records 4. Click and highlight Sewer Pipe Summary Report (note where the Sewer reports are located) 5. Click Export Report 6. Select Crystal Reports from the Format: dropdown. Click OK 7. Choose the correct location for the Sewer Reports. 8. In the File name: type in the report name CT_PipeSum.rpt then click Save. (next page)

89 9. Go to the Sewer reports folder and open CT_PipeSum.rpt by double clicking. 10. In the Menu Bar click File >>Save Data with Report. This will uncheck the option. 11. Save Ex-I-2
90 II. Example 2 Export the Work Request/Work Order Review (ReqsWORev.rpt) report found in Work Requests. Save in the Work folder as CT_ReqsWORev.rpt. With initial Save, click Cancel. Export again, using This Record Only. Open the report and remove the Save Data with Report option. Remove the ID formula in the Select Expert. Save. Solution 1. Open Work > Requests 2. Open Reports. 3. Click All Records. 4. Click and highlight Work Request/Work Order Review (note where the Request reports are located). 5. Click Export Report. 6. Select Crystal Reports from the Format: dropdown. 7. Click OK 8. Choose the correct location for the Request Reports. 9. In the File name: type in the report name CT_ReqsWORev.rpt then click Save. 10. You can either wait (it will eventually export) or Click Cancel. 11. If you selected cancel then select This Record Only and run the Export again from step Go to the Work reports folder and open CT_ReqsWORev.rpt by double clicking. 13. In the Menu Bar click File > Save Data with Report. This will uncheck the option. 14. Save Ex-II-3

91 15. If The Export was done with This Record Only then in the Preview tab you will see one line of data. Open the Select Expert in the Expert Tools Toolbar. 16. Click Show Formula>>> 17. Click and drag over the ID formula to highlight it and press the Delete Key. 18. Click OK 19. Refresh Data. (If you get the ODBC dialog then enter the Password and Finish) You should now see a number of lines of data. 20. Save Ex-II-4


92 III. Example 3 Original Report title will be changed, the Address column removed and the Type field widened. 1. In the Water Report folder, open CT_wtbfsum.rpt. (Double click to open or Right click Open.) This is a copy of the Backflow Preventer Summary Report (wtbfsum.rpt). 2. Change the title to: Backflow Preventer Inventory Report. 3. Remove the Address column. 4. Increase the width of the Type data field (BF_TYPE_TY). 5. Save Ex-III-5
93 Solution 1. To change the title: a. Double click the Title text object box. b. Click and drag over Summary and change to Inventory. 2. To remove the Address column header and field: a. Click on the column header text object, Address, press the Delete key. b. Repeat for field. 3. To increase the Type field: a. First the Size column needs to be moved to the right to make room for the increase in Type field. i. Click in the top ruler section near the 5 1/2 mark to set a guideline on the right side of the BF_SIZE field. ii. Drag the Size column header to the right to attach to the marker. iii. Click and drag the Size marker to about 7. b. Click on the BF_TYPE_TY field to highlight it. c. Place the cursor over the right side of the box and click on the sizing handle, drag to the right (5 7/8 ). 4. Save Ex-III-6


94 IV. Example 4 Original Formatting will be applied to the Size number field as well as the Column Header text objects. Continue revising CT_wtbfsum.rpt. 1. Decrease the Size numeric field to one decimal place and right align column header and field. 2. Format all Column headings to font size 9 and Bold. 3. Check to see if the Column headings fit in the given box, otherwise resize. 4. Save the report. Revised Ex-IV-7

95 Solution 1. To change the Size number formatting: a. Right Click on the BF_SIZE field to highlight and open the options. Select Format Field. b. Click Customize c. Use the drop down boxes to choose the Decimals and Rounding options. d. Click OK e. Click OK 2. To right align the column header and field: a. Click on the Size column header then push shift and click on the BF_SIZE field. b. In the Formatting Toolbar click Align Right. 3. To change the Column Headers: a. Click Device No then hold the shift key down clicking on each of the column headers. b. In the Formatting Toolbar click the B and use the drop down arrow to pick the font size of Save Ex-IV-8
 This is a copy of the Request List Report (ReqList.rpt). 2.")
96 V. Example 5 Original Report fields will be moved, removed and added. Text objects will be added and revised. Align fields. See the Revised screen shot for field placement. 1. In the Work Report folder, open CT_ReqList.rpt. (Double click to open or Right click Open.) This is a copy of the Request List Report (ReqList.rpt). 2. Add vertical guidelines to the left edges of the Category/Problem fields and the Address/Cross Street fields. 3. Remove the Cross Street field (@XStreet). 4. Add Column Headers for City and Zip Code. 5. Bring into the Detail a section the Loc City and Loc Zip Code fields (second tab in Request). 6. Remove the Category field (RQ_CAT_TY). 7. Move the Problem field (RQ_PROB_TY) into the space where the Category field had been. 8. Bring in the Supervisor text field (second tab in Request) and place under the Problem field. Size to match the Problem field. 9. Change the column headers to reflect the field changes. 10. Align fields and Save. Ex-V-9
97 Revised Solution 1. In the Work Report folder, open CT_ReqList.rpt. (Double click to open or Right click Open.) 2. Add vertical guidelines for the left edges of the Problem/Category fields and Address/Cross Street fields: o Click in the top ruler bar close to where the guideline markers should be placed. (If the ruler is not there, then go into File > Options > Layout and make sure Rulers is checked for the Design View.) The Category/Problem marker should be about 1 ¼ and the Address/Cross Street about 3 ½. 3. Remove field: o Click and press the Delete key. Ex-V-10
98 4. Modify Column Header: a. Double click the Cross Street text object. b. Click and drag over Cross Street, type City. c. Click out of the box. 5. Add Column Header: a. Click on Insert Text Object in the Insert Tools Toolbar. b. Place (click) the plus sign indicator to the right of City. c. Type Zip Code. d. Click out of the box. (If bold, depending on your Options set up, make unbold by clicking the B in the Formatting Toolbar.) 6. Add City and Zip Code fields: a. In the Request module, Request tab. b. Ctrl right click in the Loc City box. c. Click Field Definition. d. Note Field Name RQ_LOC_CTY. e. Repeat for Loc Zip Code. RQ_LOC_PST f. In Field Explorer, open Database Fields > WKREQ. g. Click and drag the RQ_LOC_CTY field into the Detail a section h. Click and drag the RQ_LOC_PST field into the Detail a section to the right of the City field. 7. Remove the Category field: o Click on the RQ_CAT_TY field and press the Delete key. 8. Move the Problem field: o Click and Drag the RQ_PROB_TY field up to where RQ_CAT_TY field had been. The marker helps keep the column alignment. Ex-V-11
99 9. Bring in the Supervisor field. a. In the Request module, Request tab. b. Ctrl right click in the Supervisor text box. c. Click Field Definition. d. Note Field Name RQ_SUPR_TY. e. In Field Explorer, open Database Fields > WKREQ. f. Click and drag the RQ_SUPR_TY field into the Detail a section under RQ_PROB_TY. g. Click and drag the right sizing handle so the right edge matches the Problem field edge. 10. Change the Column Headers. a. Double click the Problem text object. b. Click and drag over Problem, type Supervisor. c. Double click the Category text object. d. Click and drag over Category, type Problem. 11. Align Fields: 12. Save a. For the Column Headers, shift and click on Zip Code and City. b. Right click in City. c. Align > Tops d. Repeat the steps for RQ_PROB_TY aligned to RQ_NUMBER. e. Repeat the steps for all of the fields in the bottom row, align to Date field. Ex-V-12


100 VI. Example 6 A Date field and line will be added. 1. From the Water Report folder, open CT_wtbfsum.rpt. 2. Add an Installation Date Column heading to the right of Size. 3. Create a formula for the Installation Date and place it beneath the new Column heading. 4. Format the date field like this: 5. Add a line beneath the data in the Detail section and select the Move to Bottom of Section when Printing option. 6. Save Revised Ex-VI-13
101 Solution 1. Add Column header for Installation Date: a. Add a text object to the right of Size. b. Type in Installation Date: 2. Find the field definition of the Installation Date. o In the Backflow Inventory module > Attributes (first) tab, Ctrl right click the Installation Date field. Select Field Definition. Note: Field Name- BF_INST_DT 3. Create a Date formula a. In Field Explorer right click on Formula Fields and select New b. Give the formula a name (InstallDate). c. Open Functions in the Functions Tree box. d. Open Date and Time. e. Open Date. f. Double click Date (datetime). g. In the Field Tree box open GBAWater001 h. Open WTBKFLOW i. Double click the BF_INST_DT field (This will drop the date field within the parenthesis) j. Save and close 4. Drag the InstallDate formula field into the Detail section under the appropriate Column header. Ex-VI-14
102 5. Format the Date formula field. a. Right click select Format Field b. Click on the Date tab and select 03/01/1999. c. OK 6. Add a line a. In the Insert Tool Toolbar click and release on Insert Line. b. Click just below the BF_NUMBER field on the left edge of the field then drag across to the right side of the row and release. c. Right click on the line and select Format Line d. Change Color to Silver. e. Click to check the box next to Move to Bottom of Section when Printing. (This will allow for growing fields). f. OK 7. Save Ex-VI-15
103 VII. Example 7 Original We will add a date field, time field, a box and use the formatting for comments. (See next page for placement of fields.) 1. In the Work Report folder, open CT_ReqList.rpt. 2. Add new Column Headers under Status for Status Date and Status Time. Add guidelines and align. 3. Create a Date formula for Status Date. (Status Date) 4. Create a Time formula for Status Time. (Status Time) 5. Bring the new formula fields into the Detail a section to line up with the appropriate Column Headers. Align. 6. Place a box around the Status Date and Time fields. 7. Format the box border to Gray. 8. Create a formula that is strictly a comment describing the changes in the report. (ie. Added Supervisor, City, Zip, Status Date and Time.) Bring into the Page Header section. 9. Save Ex-VII-16
104 Revised Help with new items 1. To create a Time formula: a. In Field Explorer, right click on Formula Fields. b. Select New and give it a name (Status Time) c. OK d. Open the Function Tree. e. Open Date and Time. f. Open Time. g. Double click Time(dateTime). h. In the Field Tree open GBAWork001. i. Open WKREQ. j. Double click RQ_STAT_TM. k. Save and close l. Drag the field under the Status Time column header. Ex-VII-17
105 2. To create a box: a. Click and release on Insert Box in the Insert Tools Toolbar. b. Click (and hold) where the top left corner of the box is to be placed just above and to the left Drag diagonally to the bottom right corner to form a box. c. Right click on the box outline and select Format Box d. From Border Color select Gray. e. OK 3. A comment formula is created within the formula workshop by using double forward slash // before each line. Ex-VII-18

106 VIII. Example 8 A Detail report will be revised by removing sections and moving fields. 1. From the Work reports folder, open CT_ReqWOComment. 2. Add a section below Detail a and then switch places so the Detail a section is blank. 3. Increase the Page Header section to add column headers. 4. Drag in the text objects to the Page Header and the fields to the Detail a section. Request # (change Font and Boldness to match other fields.) Category Recorded By Recorded Date 5. Remove all sections except the ones containing CustComment.rpt (in red), Info for WO (in red), LinkedWOs.rpt (in red) and Comments.rpt (in red). 6. Save Ex-VIII-19

107 IX. Example 9 We will use the Can Grow option, remove a parameter type field, insert a logo and add the report to the module. 1. From the Work reports folder, open CT_ReqList.rpt. 2. The Problem field is cutting off so format to Can Grow. 3. To accommodate the Can Grow feature, split the Detail a section just below the Request Number field. 4. Remove the Report Subtitle parameter field. 5. Insert the Lucity Logo (Lucity.png) into the Page Header. (Located at C:\temp\) 6. Add the report to the Request module list of reports. Revised Ex-IX-20
108 Solution 1. Format the Problem field to grow vertically. a. Right click in the RQ_PROB_TY field and select Format Field b. Click on the Common tab. c. Click to check the box next to Can Grow. d. Ok 2. Split the Detail a section. a. Place the curser on the right edge of the vertical ruler just below the RQ_Number field. Click, hold it should turn into a line with two arrows b. Pull to the right off of the ruler. The Detail a section should now be split into Detail a and b sections. 3. Remove the Report Subtitle parameter field. 4. Add logo. 5. Save a. Click on?report Subtitle. b. Press the Delete key. a. Just above the Request List Report title, in the left ruler, click and pull to the right to create two Page Header sections. b. Increase the Page Header a section to allow the logo. c. Click on Insert Picture from the Insert Tools Toolbar. d. Go out to the picture location (C:\temp\) double click Lucity.png. e. Click in the Page Header a section where the left top corner of the logo should be placed. Click and drag to correct location if necessary. f. Right click in the Page header a section and select Merge Section Below. 6. Add report to the Work Request module. a. In the Work Requests module, open the Report Dialog. b. Click Add. c. In Report File Path browse out to the report file location. d. Double click on the correct report (CT_ReqList.rpt). e. Type in the Report Name, Description and Save. Ex-IX-21
109 X. Example 10 We will add Date parameters, select records with the parameters and add a title that uses the parameters. 1. In the Water Report folder, open CT_wtbfsum.rpt. 2. Add date range parameters (Start and End) for the Installation Date. 3. Use the date parameters in the selection criteria. 4. Bring the date parameters into the Page Header in a text object. 5. Save Revised Solution 1. In Field Explorer right click on Parameter Fields, select New 2. Type in a Name for the Start Date parameter. (Start Date) 3. Select the parameter Type: Date. 4. List of Values should be Static. 5. In Options don t allow multiple values. 6. OK. Ex-X-22

110 7. Repeat for the End Date. 8. Click on field and then click Select Expert. 9. Use the drop down boxes to select the correct fields to create the following formula: in {?Start Date} to {?End Date} 10. Add a text object below Subtitle field. Type in Installation Dates Between and. 11. Drag the?start Date and?end Date parameter fields into the text object. Ex-X-23
111 XI. Example 11 We will add a dynamic parameter to choose records. 1. From the Work Report folder, open CT_ReqList.rpt. 2. Add a dynamic parameter to choose the Supervisor (RQ_SUPR_TY). 3. Use the Parameter to select records. Solution 1. In Field Explorer right click on Parameter Fields and select New 2. In Name type in WKREQ.RQ_SUPR_TY. 3. Select String for Type. 4. For List of Values: select Dynamic. 5. Click Insert and click on the RQ_SUPR_TY field. 6. In Options change the Prompt Text to Enter Supervisor. 7. In Options allow multiples. 8. OK Ex-XI-24

112 9. In Select Expert add a formula using the Supervisor field and the parameter field. {WKREQ.RQ_SUPR_TY} = {?WKREQ.RQ_SUPR_TY} Ex-XI-25

113 XII. Example 12 We will add a sort. 1. From the Work Report folder, open CT_ReqListSort.rpt. 2. Remove the current sort on the Request Number (RQ_NUMBER). 3. Add a sort on the Problem Ascending. 4. Add a sort on the Supervisor Ascending. 5. Save. Solution 1. In the Expert Tools Toolbar click on Record Sort Expert. 2. In the Available Fields: box click on the RQ_PROB_TY field and use the arrow to move to the Sort Fields: box. 3. Click Ascending. 4. Repeat for the RQ_SUPR_TY field. (See next page) Ex-XII-26
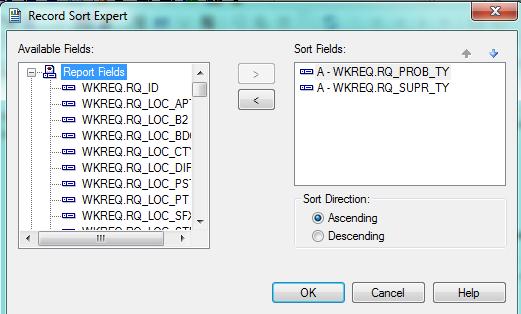
114 Ex-XII-27

115 XIII. Example 13 We will add two groups, a summary and a running total. 1. From the Water Report folder, open CT_wtbfsum.rpt. 2. Create a group for Type. 3. Create a group for Size. 4. Move the Column headers for Type and Size to the left to align with the Group Headers. 5. Remove the Type and Size fields from the Detail section. 6. Add guidelines and rearrange the columns to close up the space. 7. Summarize the number of each Size. Place in Size Group Footer. 8. Create a Running Total to total the number of sizes per Type. Place in Type Group Footer. 9. Save Ex-XIII-28
116 Solution 1. To create the group on Type, click on the BF_TYPE_TY field. 2. Click on Insert Group in the Insert Tools Toolbar. 3. OK 4. Repeat for the BF_SIZE field. 5. To summarize the number of devices of the grouped size, click on the BF_Number field. 6. Click on Insert Summary from the Insert Tools Toolbar. 7. Use the drop down arrow for Calculate this summary and select Count. 8. Use the drop down arrow for Summary location and select Group #2 BF_SIZE. 9. OK 10. The summary field is automatically placed in the Group Footer 2 section. It can be moved to a different location within the section. Ex-XIII-29
 14. Move BF_SIZE to the Field to summarize box. 15. In Type of summary use the drop down arrow and select count. 16. Evaluate On change of group, BF_SIZE 17.")
117 11. To create the Running Total of sizes per Type, right click on Running Total Fields in Field Explorer. (See next page) 12. Select New 13. Type in a name for the Running Total formula. (Sizes/Type) 14. Move BF_SIZE to the Field to summarize box. 15. In Type of summary use the drop down arrow and select count. 16. Evaluate On change of group, BF_SIZE 17. Reset On change of group, BF_TYPE 18. OK 19. Drag the running total field into the Group Footer 1 Section. Ex-XIII-30
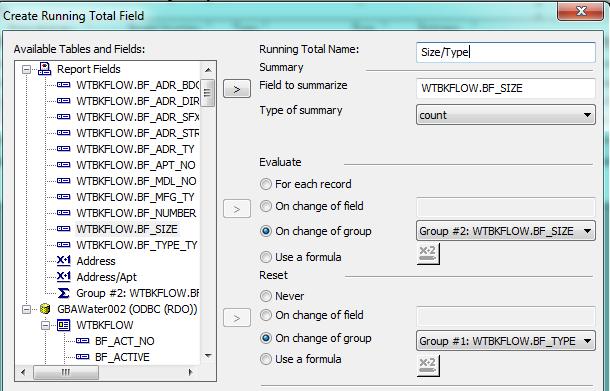
118 Ex-XIII-31
. 4. Move the fields from the Detail section to the Group Header 1 section. 5.")
119 XIV. Example 14 Add subtasks and their costs. 1. From the Work Report folder, open CT_WOSumTsk.rpt. 2. Group on Work Order # (WKORDER.WO_NUMBER) field. 3. Suppress or delete the actual Group name field (Group #1 Name). 4. Move the fields from the Detail section to the Group Header 1 section. 5. Create a formula (Subtask) combining Subtask Code (WT_TASK_CD) and Text (WT_TASK_TY) fields. if isnull({wkwotsk.wt_task_cd}) then"" else {WKWOTSK.WT_TASK_CD}&" "& if isnull({wkwotsk.wt_task_ty}) then"" else {WKWOTSK.WT_TASK_TY} 6. Group on Subtask Code (WKWOTSK.WT_TASK_CD) field. Suppress both Header (GH2) and Footer (GF2) sections for this group. 7. Group on Subtask ID (WKWOTSK.WT_ID) suppress or delete the actual Group name field (Group #3 Name). 8. Add a section to the Group Header 1 section new section GH1b. 9. Add column headers for the Subtask and Subtask Cost (Underline, Not Bold and Italic) in the Group Header 1b section (GH1b). 10. Add the Subtask formula into the Group Header 3 section (GH3) under the Subtask column header. 11. Add the Subtask Total Cost (WKWOTSK.WT_TOTCOST) field into the Group Header 3 section (GH3) under the Cost column header. Ex-XIV-32
 (GF1) 14. Change the title. (Work Order Subtask Summary Report) 15.")
120 12. Create a Running Total on the Task Cost and place in the Work Order group footer (GF1). a. Evaluate on change of group WT_ID b. Reset on change of group WO_NUMBER. 13. Add a Text field to describe the Total Cost field. (WO Subtask Total Cost) (GF1) 14. Change the title. (Work Order Subtask Summary Report) 15. Add a line at the bottom of the GF1 section to separate Work Orders. 16. Add a line above the WO Subtask Total Cost text box and field (GF1). 17. Format the cost fields with $. 18. Save. Ex-XIV-33
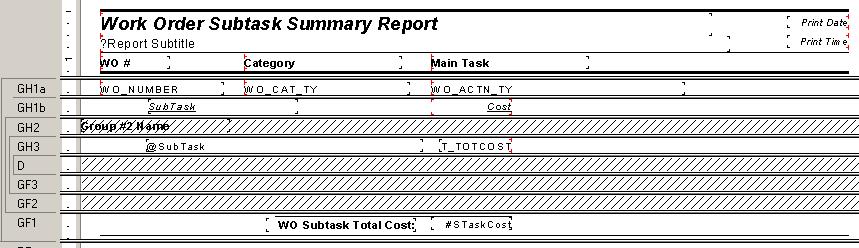
121 Ex-XIV-34

122 XV. Example Create a new Sewer report from Crystal s Standard Report Wizard option called Sewer Pump List, to be saved in the Sewer report folder as CT_SWPumpList.rpt. Use the following tables: SWPUMPS SWSTATN SWSLOT 2. Bring in the following fields. Pump Number (PM_PUMP_NO) Pump Type text (PM_TYPE) Pump Size (PM_PMP_SZ) Pump Capacity (PM_CAPCITY) Total Dynamic Head (PM_DYNM_HD) 3. Group on Pump Type (PM_TYPE). 4. Put in a count summary for Pump Type. (Count on Pump Number) Ex-XV-35

. 10.")
123 5. Put in a Grand Total for number of Pumps. 6. Move the Print Date field to the right. 7. Add the Title Sewer Pump List. 8. Remove the PM_TYPE_TY field from the Detail section since this field is being grouped on. 9. Change the Column headers to be more descriptive (see example). 10. Add a text object for Type. Place in the Page Header section, under the title. Ex-XV-36
124 Ex-XV-37

125 XVI. Example Create a new Work report from Crystal s Blank Report option called Work Order Summary, to be saved in the Work report folder as CT_WOSumCat.rpt. Use the following tables: WKORDER WKWOTSK WKRESRCE WKORDERLOC WKWOASSET 2. Select on New Work Orders, WO_STAT_CD = Bring in the following fields. WO Number (WO_NUMBER) Category text (WO_CAT_TY) Main Task text (WO_ACTN_TY) Total Cost (WO_TOTCOST) 4. Group on Category. 5. Group on WO Number. 6. Move fields to GF2 section. 7. Put in a cost subtotal for Category using a Running Total. Ex-XVI-38


126 8. Put in a cost Grand Total using a Running Total. Ex-XVI-39
127 XVII. Example 17 From the Backflow Preventer module we would like to add the Testing information. This could be done with additional grouping on the Device and then the Testing ID but usually this child type information is brought in as a subreport. The subreport will be placed in its own section so blank subreport spacing can be suppressed. 1. From the Water Report folder, open CT_wtbfsumSubReport. 2. Add an additional Detail section. 3. Add a subreport (call it Testing) Use table WTBFTEST. 4. Link the subreport. 5. Format the subreport Especially the Suppress Blank Subreport option. 6. Open the subreport and Add a subreport Title Testing. a. Add Testing fields. Initial Test Date BT_DATE_A Pass Initial? BT_PASS_I Final Test Date BT_DATE_B Pass Final? BT_PASS_F b. Add a box around the data, top in the report header section and the bottom in the report footer section. c. Delete or suppress unused sections. 7. Preview the report notice the empty space for a record with no testing. Ex-XVII-40
128 8. In the Detail Section Expert make sure the section with the subreport has the Suppress Blank Section option checked. 9. Save Subreport Ex-XVII-41
. b. Give it a File name. (TaskResSub.rpt) c. Save 3.")

129 XVIII. Example 18 Add the Task/Resource subreport from the Work Order Detail report (WODetail.rpt) to the Work Order Summary Report (WOSum.rpt). Solution 1. From the Work Report folder, open WODetail.rpt. 2. Right click on the TaskRes.rpt subreport and select Save Subreport As a. Select the correct location to put the subreport in (Work). b. Give it a File name. (TaskResSub.rpt) c. Save 3. Close the WODetail.rpt report. 4. From the Work Report folder, open CT_WOSumTaskResource.rpt. 5. Add a new Group footer section beneath GF1a. 6. Insert a subreport selecting Choose an existing report option. 7. Browse out to the TaskResSub.rpt report that was saved in the Work folder. 8. Double click on the file. OK 9. Format the subreport. o In the Common tab, Uncheck Keep Object Together. It depends on the amount of data that will show in the subreport as to whether this is checked or not. Ex-XVIII-42
130 10. Link the subreport. 11. Open the subreport and remove the blank sections (Header and Footer). 12. Open the subreport s Select Expert and remove the additional linking formula. 13. In Section Expert check the Suppress Blank Section option for the Group Footer 1b section. Ex-XVIII-43
131 XIX. Example 19 Set the report up to query for a date range that will be used with the Initial Test Date in the subreport. Use the existing Date parameters. Solution 1. From the Water Report folder, open CT_wtbfsumSubTestDt.rpt. 2. The Start Date and End Date parameters already exist for the Installation Date selection. Remove this formula from the Select Expert. 3. Right click on the Testing subreport and select Change Subreport Links 4. Move both the [?] Start Date and [?] End Date parameter fields from the Available Fields: into the Field(s) to link to: box. 5. In the right lower box use the drop down arrow and for both the?start Date and?end Date. (see next page) Ex-XIX-44

132 6. OK 7. Open the Testing subreport. 8. Click Select Expert > Show Formula > Formula Editor 9. Change the formula from: = {?Pm-?Start Date} and = {?Pm-?End Date} and {WTBFTEST.BT_BF_ID} = {?Pm-WTBKFLOW.BF_ID} To this: {@InitialTestDate}>= {?Pm-?Start Date} and {@InitialTestDate} <= {?Pm-?End Date} and {WTBFTEST.BT_BF_ID} = {?Pm-WTBKFLOW.BF_ID} 10. Save and close 11. OK 12. Change the Date Title to read Initial Test Dates Between?Start Date and?end Date Ex-XIX-45
 3. Click Insert Subreport. 4. Give it a New report name. (Comment) 5. Click Report Wizard 6. In Data Source Selection choose GBAWater001. Finish 7.")
133 XX. Example 20 Add a General Comment subreport below the Testing subreport in its own section. Solution 1. From the Water Report folder, open CT_wtbfsumSubComment.rpt. 2. Add a new Detail section under Detail b. (Dc) 3. Click Insert Subreport. 4. Give it a New report name. (Comment) 5. Click Report Wizard 6. In Data Source Selection choose GBAWater001. Finish 7. Select WTMEMO in the Available Data Sources: and use the arrow (>) to move it to the Selected Tables: 8. Finish and OK 9. Drop the subreport box into the Detail c section. 10. Format the subreport. 11. Link the subreport by right clicking on it and selecting Change Subreport Links 12. Move the BF_ID field to Field(s) to link to: 13. In the lower right box select CO_REC_ID. Ex-XX-46

134 14. Open the Comment subreport. a. Add a text field to the Detail section. (Comment:) b. Bring in the CO_TEXT field and place it next to Comment:. c. In the subreport s Select Expert click New. d. Click on CO_FIELD e. OK f. Use the drop down box to select is equal to. g. In the right box select BF_MEMO1. h. OK i. Suppress empty sections. 15. In the main report s Section Expert click on Details c and then click to check the Suppress Blank Section option. 16. OK Revised Subreport Ex-XX-47
135 XXI. Example 21 Add a Dated Comment subreport below the Comment subreport in its own section. Solution 1. From the Water Report folder, open CT_wtbfsumSubComment.rpt. 2. Add a new Detail section under Detail c. (Dd) 3. Click Insert Subreport. 4. Give it a New report name. (Dated Comment) 5. Click Report Wizard 6. In Data Source Selection choose GBAWater001. Finish 7. Select WTGDMEMO in the Available Data Sources: and use the arrow (>) to move it to the Selected Tables: 8. Finish and OK 9. Drop the subreport box into the Detail d section. 10. Format the subreport. 11. Link the subreport by right clicking on it and selecting Change Subreport Links 12. Move the BF_ID field to Field(s) to link to: 13. In the lower right box select GM_PAR_ID. OK Ex-XXI-48


136 14. Open the Dated Comment subreport. a. In the subreport s Select Expert click New. b. Click on GM_PARENT c. OK d. Use the drop down box to select is equal to. e. In the right box select the table name, WTBKFLOW. f. OK g. Bring in the Column Headers and Fields. 15. In the main report s Section Expert click on Details d and then click to check the Suppress Blank Section option. 16. OK Revised Subreport Ex-XXI-49
TRAINING GUIDE. Intermediate Crystal 2
 TRAINING GUIDE Intermediate Crystal 2 Using Crystal Reports with Lucity Intermediate Examples 2 The fourth of a seven-part series, this workbook is designed for Crystal Reports users with some experience.
Chapter 2 The Design Window
 Chapter 2 Objectives Chapter 2 The Design Window Learn about Crystal sections Move objects Use Toolbars, Icons, and Menus Format fields Add Special Fields Change a Group Use the Crystal Field Explorer
Excel Select a template category in the Office.com Templates section. 5. Click the Download button.
 Microsoft QUICK Excel 2010 Source Getting Started The Excel Window u v w z Creating a New Blank Workbook 2. Select New in the left pane. 3. Select the Blank workbook template in the Available Templates
Microsoft Word: Steps To Success (The Bare Essentials)
") Microsoft Word: Steps To Success (The Bare Essentials) Workbook by Joyce Kirst 2005 Microsoft Word: Step to Success (The Bare Essentials) Page Contents 1 Starting Word 2 Save 3 Exit 5 Toolbars, Alignment,
Microsoft Word: Steps To Success (The Bare Essentials) Workbook by Joyce Kirst 2005 Microsoft Word: Step to Success (The Bare Essentials) Page Contents 1 Starting Word 2 Save 3 Exit 5 Toolbars, Alignment,
Rev. C 11/09/2010 Downers Grove Public Library Page 1 of 41
 Table of Contents Objectives... 3 Introduction... 3 Excel Ribbon Components... 3 Office Button... 4 Quick Access Toolbar... 5 Excel Worksheet Components... 8 Navigating Through a Worksheet... 8 Making
Quick Reference Card Business Objects Toolbar Design Mode
 Icon Description Open in a new window Pin/Unpin this tab Close this tab File Toolbar New create a new document Open Open a document Select a Folder Select a Document Select Open Save Click the button to
Using Microsoft Excel
 Using Microsoft Excel Table of Contents The Excel Window... 2 The Formula Bar... 3 Workbook View Buttons... 3 Moving in a Spreadsheet... 3 Entering Data... 3 Creating and Renaming Worksheets... 4 Opening
Quick Start Guide - Contents. Opening Word Locating Big Lottery Fund Templates The Word 2013 Screen... 3
 Quick Start Guide - Contents Opening Word... 1 Locating Big Lottery Fund Templates... 2 The Word 2013 Screen... 3 Things You Might Be Looking For... 4 What s New On The Ribbon... 5 The Quick Access Toolbar...
CounselLink Reporting. Designer
 CounselLink Reporting Designer Contents Overview... 1 Introduction to the Document Editor... 2 Create a new document:... 2 Document Templates... 3 Datasets... 3 Document Structure... 3 Layout Area... 4
User Guide. Web Intelligence Rich Client. Business Objects 4.1
 User Guide Web Intelligence Rich Client Business Objects 4.1 2 P a g e Web Intelligence 4.1 User Guide Web Intelligence 4.1 User Guide Contents Getting Started in Web Intelligence 4.1... 5 Log into EDDIE...
Microsoft Word Introduction
 Academic Computing Services www.ku.edu/acs Abstract: This document introduces users to basic Microsoft Word 2000 tasks, such as creating a new document, formatting that document, using the toolbars, setting
Introducing Gupta Report Builder
 Business Reporting Chapter 1 Introducing Gupta Report Builder You can use Report Builder to design reports. This chapter describes: Our approach to building reports. Some of the reports you can build.
MS Word Professional Document Alignment
 MS Word Professional Document Alignment Table of Contents CHARACTER VS. PARAGRAPH FORMATTING...5 Character formatting...5 Paragraph Formatting...5 USING SHOW/HIDE TO REVEAL NON-PRINTING CHARACTERS...5
Section 1 Microsoft Excel Overview
 Course Topics: I. MS Excel Overview II. Review of Pasting and Editing Formulas III. Formatting Worksheets and Cells IV. Creating Templates V. Moving and Navigating Worksheets VI. Protecting Sheets VII.
Microsoft Word 2010 Basics
 1 Starting Word 2010 with XP Click the Start Button, All Programs, Microsoft Office, Microsoft Word 2010 Starting Word 2010 with 07 Click the Microsoft Office Button with the Windows flag logo Start Button,
VisualPST 2.4. Visual object report editor for PowerSchool. Copyright Park Bench Software, LLC All Rights Reserved
 VisualPST 2.4 Visual object report editor for PowerSchool Copyright 2004-2015 Park Bench Software, LLC All Rights Reserved www.parkbenchsoftware.com This software is not free - if you use it, you must
MICROSOFT WORD 2010 BASICS
 MICROSOFT WORD 2010 BASICS Word 2010 is a word processing program that allows you to create various types of documents such as letters, papers, flyers, and faxes. The Ribbon contains all of the commands
Microsoft Office Word. Part1
 Microsoft Office 2010 - Word Part1 1 Table of Contents What is Microsoft Word?... 4 Creating a document... 5 Toolbar... 6 Typing in MS Word Text Area... 7 Cut, Copy and Paste Text... 9 Paste Preview...
Study Guide. PCIC 3 B2 GS3- Key Applications-Excel. Copyright 2010 Teknimedia Corporation
 Study Guide PCIC 3 B2 GS3- Key Applications-Excel Copyright 2010 Teknimedia Corporation Teknimedia grants permission to any licensed owner of PCIC 3 B GS3 Key Applications-Excel to duplicate the contents
Introduction to Microsoft Word 2008
 1. Launch Microsoft Word icon in Applications > Microsoft Office 2008 (or on the Dock). 2. When the Project Gallery opens, view some of the available Word templates by clicking to expand the Groups, and
Understanding Word Processing
 Understanding Word Processing 3.0 Introduction In this chapter you are going to learn how to create a simple memo or note or a complex and complicated multi column business document using word processing
Corel Ventura 8 Introduction
 Corel Ventura 8 Introduction Training Manual A! ANZAI 1998 Anzai! Inc. Corel Ventura 8 Introduction Table of Contents Section 1, Introduction...1 What Is Corel Ventura?...2 Course Objectives...3 How to
Creating Reports in Access 2007 Table of Contents GUIDE TO DESIGNING REPORTS... 3 DECIDE HOW TO LAY OUT YOUR REPORT... 3 MAKE A SKETCH OF YOUR
 Creating Reports in Access 2007 Table of Contents GUIDE TO DESIGNING REPORTS... 3 DECIDE HOW TO LAY OUT YOUR REPORT... 3 MAKE A SKETCH OF YOUR REPORT... 3 DECIDE WHICH DATA TO PUT IN EACH REPORT SECTION...
Creating Pages with the CivicPlus System
 Creating Pages with the CivicPlus System Getting Started...2 Logging into the Administration Side...2 Icon Glossary...3 Mouse Over Menus...4 Description of Menu Options...4 Creating a Page...5 Menu Item
-Using Excel- *The columns are marked by letters, the rows by numbers. For example, A1 designates row A, column 1.
 -Using Excel- Note: The version of Excel that you are using might vary slightly from this handout. This is for Office 2004 (Mac). If you are using a different version, while things may look slightly different,
Intro to Excel. To start a new workbook, click on the Blank workbook icon in the middle of the screen.
 Excel is a spreadsheet application that allows for the storing, organizing and manipulation of data that is entered into it. Excel has variety of built in tools that allow users to perform both simple
Word 2010 Beginning. Technology Integration Center
 Word 2010 Beginning File Tab... 2 Quick Access Toolbar... 2 The Ribbon... 3 Help... 3 Opening a Document... 3 Documents from Older Versions... 4 Document Views... 4 Navigating the Document... 5 Moving
Changing the Layout of a Document
 LESSON 5 Changing the Layout of a Document 5.1 After completing this lesson, you will be able to: Adjust page margin settings. Set paragraph indentation and spacing. Change indents and tab settings. Insert
Microsoft Office Excel
 Microsoft Office 2007 - Excel Help Click on the Microsoft Office Excel Help button in the top right corner. Type the desired word in the search box and then press the Enter key. Choose the desired topic
Contents. Launching Word
 Using Microsoft Office 2007 Introduction to Word Handout INFORMATION TECHNOLOGY SERVICES California State University, Los Angeles Version 1.0 Winter 2009 Contents Launching Word 2007... 3 Working with
Index COPYRIGHTED MATERIAL. Symbols and Numerics
 Symbols and Numerics ( ) (parentheses), in functions, 173... (double quotes), enclosing character strings, 183 #...# (pound signs), enclosing datetime literals, 184... (single quotes), enclosing character
Excel 2016: Part 1. Updated January 2017 Copy cost: $1.50
 Excel 2016: Part 1 Updated January 2017 Copy cost: $1.50 Getting Started Please note that you are required to have some basic computer skills for this class. Also, any experience with Microsoft Word is
WEEK NO. 12 MICROSOFT EXCEL 2007
 WEEK NO. 12 MICROSOFT EXCEL 2007 LESSONS OVERVIEW: GOODBYE CALCULATORS, HELLO SPREADSHEET! 1. The Excel Environment 2. Starting A Workbook 3. Modifying Columns, Rows, & Cells 4. Working with Worksheets
Learning Worksheet Fundamentals
 1.1 LESSON 1 Learning Worksheet Fundamentals After completing this lesson, you will be able to: Create a workbook. Create a workbook from a template. Understand Microsoft Excel window elements. Select
Microsoft Excel 2010 Basic
 Microsoft Excel 2010 Basic Introduction to MS Excel 2010 Microsoft Excel 2010 is a spreadsheet software in the new Microsoft 2010 Office Suite. Excel allows you to store, manipulate and analyze data in
Using Microsoft Word. Table of Contents
 Using Microsoft Word Table of Contents The Word Screen... 2 Document View Buttons... 2 Selecting Text... 3 Using the Arrow Keys... 3 Using the Mouse... 3 Line Spacing... 4 Paragraph Alignment... 4 Show/Hide
Microsoft Word Part I Reference Manual
 Microsoft Word 2002 Part I Reference Manual Instructor: Angela Sanderson Computer Training Coordinator Updated by: Angela Sanderson January 11, 2003 Prepared by: Vi Johnson November 20, 2002 THE WORD SCREEN
Microsoft Office Word. Help. Opening a Document. Converting from Older Versions
 Microsoft Office 2007 - Word Help Click on the Microsoft Office Word Help button in the top right corner. Type the desired word in the search box and then press the Enter key. Choose the desired topic
Layout and display. STILOG IST, all rights reserved
 2 Table of Contents I. Main Window... 1 1. DEFINITION... 1 2. LIST OF WINDOW ELEMENTS... 1 Quick Access Bar... 1 Menu Bar... 1 Windows... 2 Status bar... 2 Pop-up menu... 4 II. Menu Bar... 5 1. DEFINITION...
Word 2013 Beginning. Technology Integration Center
 Word 2013 Beginning Getting Started... 2 Quick Access Toolbar... 3 The Ribbon... 3 Help... 4 Compatibility Mode... 4 Document Views... 4 Navigating the Document... 5 Moving Around in the Document... 5
12 BASICS OF MS-EXCEL
 12 BASICS OF MS-EXCEL 12.1 INTRODUCTION MS-Excel 2000 is a Windows based application package. It is quite useful in entering, editing, analysis and storing of data. Arithmetic operations with numerical
Microsoft Word 2011 Tutorial
 Microsoft Word 2011 Tutorial GETTING STARTED Microsoft Word is one of the most popular word processing programs supported by both Mac and PC platforms. Microsoft Word can be used to create documents, brochures,
Excel 2016 Basics for Windows
 Excel 2016 Basics for Windows Excel 2016 Basics for Windows Training Objective To learn the tools and features to get started using Excel 2016 more efficiently and effectively. What you can expect to learn
Basic Intro to ETO Results
 Basic Intro to ETO Results Who is the intended audience? Registrants of the 8 hour ETO Results Orientation (this training is a prerequisite) Anyone who wants to learn more but is not ready to attend the
Spreadsheets Microsoft Office Button Ribbon
 Getting started with Excel 2007 you will notice that there are many similar features to previous versions. You will also notice that there are many new features that you ll be able to utilize. There are
MAKING TABLES WITH WORD BASIC INSTRUCTIONS. Setting the Page Orientation. Inserting the Basic Table. Daily Schedule
 MAKING TABLES WITH WORD BASIC INSTRUCTIONS Setting the Page Orientation Once in word, decide if you want your paper to print vertically (the normal way, called portrait) or horizontally (called landscape)
User Manual Version 1.1 January 2015
 User Manual Version 1.1 January 2015 - 2 / 112 - V1.1 Variegator... 7 Variegator Features... 7 1. Variable elements... 7 2. Static elements... 7 3. Element Manipulation... 7 4. Document Formats... 7 5.
Excel 2016 Basics for Mac
 Excel 2016 Basics for Mac Excel 2016 Basics for Mac Training Objective To learn the tools and features to get started using Excel 2016 more efficiently and effectively. What you can expect to learn from
Excel Tutorial 1
 IT٢.we Excel 2003 - Tutorial 1 Spreadsheet Basics Screen Layout Title bar Menu bar Standard Toolbar Other Tools Task Pane Adding and Renaming Worksheets Modifying Worksheets Moving Through Cells Adding
The American University in Cairo. Academic Computing Services. Word prepared by. Soumaia Ahmed Al Ayyat
 The American University in Cairo Academic Computing Services Word 2000 prepared by Soumaia Ahmed Al Ayyat Spring 2001 Table of Contents: Opening the Word Program Creating, Opening, and Saving Documents
New York City College of Technology. Microsoft Word Contact Information:
 New York City College of Technology Microsoft Word 2016 Contact Information: 718-254-8565 ITEC@citytech.cuny.edu Opening Word 2016 Begin by clicking on the bottom left corner icon on the desktop. From
Open Office Calc (Spreadsheet) Tutorial
 Tutorial") Open Office Calc (Spreadsheet) Tutorial Table of Contents Introduction...3 What is a Spreadsheet?...3 Starting OpenOffice Calc...3 OpenOffice Calc (Spreadsheet) Basics...4 Creating a New Document...5 Entering
Open Office Calc (Spreadsheet) Tutorial Table of Contents Introduction...3 What is a Spreadsheet?...3 Starting OpenOffice Calc...3 OpenOffice Calc (Spreadsheet) Basics...4 Creating a New Document...5 Entering
Rev. B 12/16/2015 Downers Grove Public Library Page 1 of 40
 Objectives... 3 Introduction... 3 Excel Ribbon Components... 3 File Tab... 4 Quick Access Toolbar... 5 Excel Worksheet Components... 8 Navigating Through a Worksheet... 9 Downloading Templates... 9 Using
Excel Main Screen. Fundamental Concepts. General Keyboard Shortcuts Open a workbook Create New Save Preview and Print Close a Workbook
 Excel 2016 Main Screen Fundamental Concepts General Keyboard Shortcuts Open a workbook Create New Save Preview and Print Close a Ctrl + O Ctrl + N Ctrl + S Ctrl + P Ctrl + W Help Run Spell Check Calculate
Kenora Public Library. Computer Training. Introduction to Excel
 Kenora Public Library Computer Training Introduction to Excel Page 2 Introduction: Spreadsheet programs allow users to develop a number of documents that can be used to store data, perform calculations,
Working with Charts Stratum.Viewer 6
 Working with Charts Stratum.Viewer 6 Getting Started Tasks Additional Information Access to Charts Introduction to Charts Overview of Chart Types Quick Start - Adding a Chart to a View Create a Chart with
BusinessObjects Frequently Asked Questions
 BusinessObjects Frequently Asked Questions Contents Is there a quick way of printing together several reports from the same document?... 2 Is there a way of controlling the text wrap of a cell?... 2 How
Introduction to Excel 2013
 Introduction to Excel 2013 Copyright 2014, Software Application Training, West Chester University. A member of the Pennsylvania State Systems of Higher Education. No portion of this document may be reproduced
Introduction to Microsoft Word 2010
 Introduction to Microsoft Word 2010 Microsoft Word is a word processing program you can use to write letters, resumes, reports, and more. Anything you can create with a typewriter, you can create with
Introduction to Microsoft Word 2010
 Introduction to Microsoft Word 2010 THE BASICS PAGE 02! What is Microsoft Word?! Opening Microsoft Word! The Title Bar! Page View and Zoom MENUS...PAGE 03! Quick Access Toolbar! The Ribbon! File Tab! Home
INTRODUCTION... 1 UNDERSTANDING CELLS... 2 CELL CONTENT... 4
 Introduction to Microsoft Excel 2016 INTRODUCTION... 1 The Excel 2016 Environment... 1 Worksheet Views... 2 UNDERSTANDING CELLS... 2 Select a Cell Range... 3 CELL CONTENT... 4 Enter and Edit Data... 4
MICROSOFT WORD 2010 Quick Reference Guide
 MICROSOFT WORD 2010 Quick Reference Guide Word Processing What is Word Processing? How is Word 2010 different from previous versions? Using a computer program, such as Microsoft Word, to create and edit
Introduction to Microsoft Excel 2010
 Introduction to Microsoft Excel 2010 THE BASICS PAGE 02! What is Microsoft Excel?! Important Microsoft Excel Terms! Opening Microsoft Excel 2010! The Title Bar! Page View, Zoom, and Sheets MENUS...PAGE
eschoolplus+ Cognos Query Studio Training Guide Version 2.4
 + Training Guide Version 2.4 May 2015 Arkansas Public School Computer Network This page was intentionally left blank Page 2 of 68 Table of Contents... 5 Accessing... 5 Working in Query Studio... 8 Query
What can Word 2013 do?
 Mary Ann Wallner What can Word 2013 do? Provide the right tool for: Every aspect of document creation Desktop publishing Web publishing 2 Windows 7: Click Start Choose Microsoft Office > Microsoft Word
Introduction to Microsoft Office 2016: Word
 Introduction to Microsoft Office 2016: Word Last Updated: September 2018 Cost: $2.00 Microsoft Word is a word processing software. You can use it to type letters, reports, and other documents. This class
CPM-200 User Guide For Lighthouse for MAX
 CPM-200 User Guide For Lighthouse for MAX Contents Page Number Opening the software 2 Altering the page size & Orientation 3-4 Inserting Text 5 Editing Text 6 Inserting Graphics 7-8 Changing the Colour
Nauticom NetEditor: A How-to Guide
 Nauticom NetEditor: A How-to Guide Table of Contents 1. Getting Started 2. The Editor Full Screen Preview Search Check Spelling Clipboard: Cut, Copy, and Paste Undo / Redo Foreground Color Background Color
Beginning a presentation
 L E S S O N 2 Beginning a presentation Suggested teaching time 40-50 minutes Lesson objectives To learn how to create and edit title and bullet slides, you will: a b c d Select slide types by using the
Microsoft Access 2010
 2013\2014 Microsoft Access 2010 Tamer Farkouh M i c r o s o f t A c c e s s 2 0 1 0 P a g e 1 Definitions Microsoft Access 2010 What is a database? A database is defined as an organized collection of data
Introduction to Excel
 Office Button, Tabs and Ribbons Office Button The File menu selection located in the upper left corner in previous versions of Excel has been replaced with the Office Button in Excel 2007. Clicking on
Computer Nashua Public Library Introduction to Microsoft Word 2010
 Microsoft Word is a word processing program you can use to write letters, resumes, reports, and more. Anything you can create with a typewriter, you can create with Word. You can make your documents more
Word - Basics. Course Description. Getting Started. Objectives. Editing a Document. Proofing a Document. Formatting Characters. Formatting Paragraphs
 Course Description Word - Basics Word is a powerful word processing software package that will increase the productivity of any individual or corporation. It is ranked as one of the best word processors.
EXCEL BASICS: MICROSOFT OFFICE 2010
 EXCEL BASICS: MICROSOFT OFFICE 2010 GETTING STARTED PAGE 02 Prerequisites What You Will Learn USING MICROSOFT EXCEL PAGE 03 Opening Microsoft Excel Microsoft Excel Features Keyboard Review Pointer Shapes
Advanced Excel. Click Computer if required, then click Browse.
 Advanced Excel 1. Using the Application 1.1. Working with spreadsheets 1.1.1 Open a spreadsheet application. Click the Start button. Select All Programs. Click Microsoft Excel 2013. 1.1.1 Close a spreadsheet
Application of Skills: Microsoft Excel 2013 Tutorial
 Application of Skills: Microsoft Excel 2013 Tutorial Throughout this module, you will progress through a series of steps to create a spreadsheet for sales of a club or organization. You will continue to
Service Minder Plus Features/Helpful Hints
 Service Minder Plus Features/Helpful Hints This manual covers helpful hints and use of features. Note: These items will be addressed during the training sessions. This document is meant to be used as an
SUM - This says to add together cells F28 through F35. Notice that it will show your result is
 COUNTA - The COUNTA function will examine a set of cells and tell you how many cells are not empty. In this example, Excel analyzed 19 cells and found that only 18 were not empty. COUNTBLANK - The COUNTBLANK
ECDL Module 6 REFERENCE MANUAL
 ECDL Module 6 REFERENCE MANUAL Presentation Microsoft PowerPoint XP Edition for ECDL Syllabus Four PAGE 2 - ECDL MODULE 6 (USING POWERPOINT XP) - MANUAL 6.1 GETTING STARTED... 4 6.1.1 FIRST STEPS WITH
Introduction to Excel 2007
 Introduction to Excel 2007 These documents are based on and developed from information published in the LTS Online Help Collection (www.uwec.edu/help) developed by the University of Wisconsin Eau Claire
Excel 2010 Level 1: The Excel Environment
 Excel 2010 Level 1: The Excel Environment Table of Contents The Excel 2010 Environment... 1 The Excel Window... 1 File Tab... 1 The Quick Access Toolbar... 4 Access the Customize the Quick Access Toolbar
Query Studio Training Guide Cognos 8 February 2010 DRAFT. Arkansas Public School Computer Network 101 East Capitol, Suite 101 Little Rock, AR 72201
 Query Studio Training Guide Cognos 8 February 2010 DRAFT Arkansas Public School Computer Network 101 East Capitol, Suite 101 Little Rock, AR 72201 2 Table of Contents Accessing Cognos Query Studio... 5
Do It Yourself Website Editing Training Guide
 Do It Yourself Website Editing Training Guide Version 3.0 Copyright 2000-2011 Sesame Communications. All Rights Reserved. Table of Contents DIY Overview 3 What pages are editable using the DIY Editing
EXCEL BASICS: MICROSOFT OFFICE 2007
 EXCEL BASICS: MICROSOFT OFFICE 2007 GETTING STARTED PAGE 02 Prerequisites What You Will Learn USING MICROSOFT EXCEL PAGE 03 Opening Microsoft Excel Microsoft Excel Features Keyboard Review Pointer Shapes
Creating a Website with Publisher 2016
 Creating a Website with Publisher 2016 Getting Started University Information Technology Services Learning Technologies, Training & Audiovisual Outreach Copyright 2017 KSU Division of University Information
Learn more about Pages, Keynote & Numbers
 Learn more about Pages, Keynote & Numbers HCPS Instructional Technology May 2012 Adapted from Apple Help Guides CHAPTER ONE: PAGES Part 1: Get to Know Pages Opening and Creating Documents Opening a Pages
Using Sitecore 5.3.1
 Using Sitecore 5.3.1 An End-User s Guide to Using and Administrating Sitecore Author: Sitecore Corporation Date: December 12, 2007 Release: Rev. 1.0 Language: English Sitecore is a registered trademark.
Introductory Excel Walpole Public Schools. Professional Development Day March 6, 2012
 Introductory Excel 2010 Walpole Public Schools Professional Development Day March 6, 2012 By: Jessica Midwood Agenda: What is Excel? How is Excel 2010 different from Excel 2007? Basic functions of Excel
Microsoft Excel 2010 Basics
 Microsoft Excel 2010 Basics Starting Word 2010 with XP: Click the Start Button, All Programs, Microsoft Office, Microsoft Excel 2010 Starting Word 2010 with 07: Click the Microsoft Office Button with the
TheFinancialEdge. Crystal Reports Tutorial
 TheFinancialEdge Crystal Reports Tutorial 101911 2011 Blackbaud, Inc. This publication, or any part thereof, may not be reproduced or transmitted in any form or by any means, electronic, or mechanical,
PRESENCE. RadEditor Guide. SchoolMessenger 100 Enterprise Way, Suite A-300 Scotts Valley, CA
 PRESENCE RadEditor Guide SchoolMessenger 100 Enterprise Way, Suite A-300 Scotts Valley, CA 95066 800-920-3897 www.schoolmessenger.com Contents Contents... 2 Introduction... 3 What is RadEditor?... 3 RadEditor
Introduction to Excel
 Introduction to Excel Written by Jon Agnone Center for Social Science Computation & Research 145 Savery Hall University of Washington Seattle WA 98195 U.S.A. (206)543-8110 November 2004 http://julius.csscr.washington.edu/pdf/excel.pdf
Content Author's Reference and Cookbook
 Sitecore CMS 6 Content Author's Reference and Cookbook Rev. 080627 Sitecore CMS 6 Content Author's Reference and Cookbook A Conceptual Overview and Practical Guide to Using Sitecore Table of Contents Chapter
EDITING AN EXISTING REPORT
 Report Writing in NMU Cognos Administrative Reporting 1 This guide assumes that you have had basic report writing training for Cognos. It is simple guide for the new upgrade. Basic usage of report running
EXCEL 2013 FDLRS SUNRISE
 EXCEL 2013 FDLRS SUNRISE Goal: Participants will create a spreadsheet and graph to document student progress. Objectives: Participants will create a spreadsheet which includes basic formulas. Participants
Excel 2003 Tutorial II
 This tutorial was adapted from a tutorial by see its complete version at http://www.fgcu.edu/support/office2000/excel/index.html Excel 2003 Tutorial II Charts Chart Wizard Chart toolbar Resizing a chart
TRAINING GUIDE. Advanced Crystal 1
 TRAINING GUIDE Advanced Crystal 1 Using Crystal Reports with Lucity Advanced Examples 1 The fifth of a seven-part series, this workbook is designed for Crystal Reports users with some experience, who wish
The HOME Tab: Cut Copy Vertical Alignments
 The HOME Tab: Cut Copy Vertical Alignments Text Direction Wrap Text Paste Format Painter Borders Cell Color Text Color Horizontal Alignments Merge and Center Highlighting a cell, a column, a row, or the
Microsoft Word Part 3 Office 2013
 Microsoft Word Part 3 Office 2013 Hyperlinks When a document is sent as an electronic copy, hyperlinks can be added to direct the reader to a web page. To add a hyperlink: Highlight the word, phrase, paragraph,
Designer Reference 1
 Designer Reference 1 Table of Contents USE OF THE DESIGNER...4 KEYBOARD SHORTCUTS...5 Shortcuts...5 Keyboard Hints...5 MENUS...7 File Menu...7 Edit Menu...8 Favorites Menu...9 Document Menu...10 Item Menu...12