The same procedure is used for the other factors.
|
|
|
- Lynette Avis Freeman
- 6 years ago
- Views:
Transcription
1
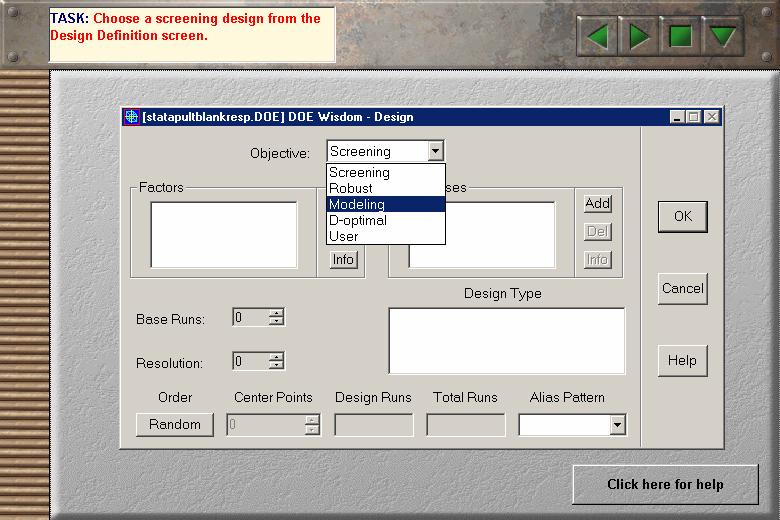
2 When DOE Wisdom software is opened for a new experiment, only two folders appear; the message log folder and the design folder. The message log folder includes any error message information that occurs during use of the software. This information is only important if you need to call technical support. The design folder opens the design definition screen. To open this screen, click the design button. The design definition screen will appear. DOE Wisdom supports 5 types of experimental objectives; screening, robust design, modeling, D- optimal, and user defined designs. For our statapult experiment, we will use a screening design.


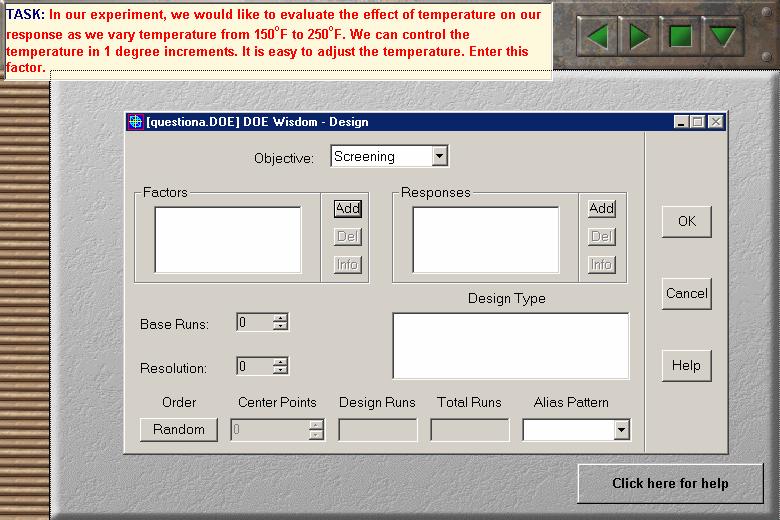
3 We need to define three factors for our experiment. To add the first factor, simply choose Add in the factors section. The factor definition window appears. Our first factor is pull-back angle. Type pull-back in the name section. Tab to the unit section and type degrees. Our low level is 440 degrees. Tab to the low-level section and type 440. Our high level is 490 degrees. Tab to the high level section and type 490. We can adjust the angle in 1 degree increments. Tab to the precision section and enter 1. It is easy to adjust this factor so our ease of adjustment is easy. Click on the OK button. You now see the pull-back factor listed in the factors section of the design definition window. The same procedure is used for the other factors.


4 We now need to define the response for our experiment. In this case the response is distance. To add the response, simply choose add in the response section. The response definition window appears. Type distance in the name section. Tab to the units section and type inches. Tab to the Min section and enter the minimum expected value for the response. In this case we will enter 30. Our maximum expected value is 230. Click the arrows at the right of the replicates section to indicate the number of replicates desired. In this experiment, we will run three replicates. Since there is only one response in this experiment, we do not need to use the desirability function. Click on the OK button. You now see distance listed in the response section of the design definition window.
5

6 When factors and responses have been entered, DOE Wisdom displays the permissible design types for the objective selected. The recommend design type is highlighted. You can change this design type by positioning the mouse pointer over the design type and clicking. In this experiment, we will use a factorial design.

7 The base runs, resolution, design types and total runs sections are all interactive. If you select a different design types, the number of runs and the resolution will change. DOE Wisdom allows you to choose either standard or random order for your worksheet. Standard order creates a worksheet in the textbook order of the design. Random order creates a worksheet with all the runs in randomized order. This assists in averaging out the effects of extraneous, uncontrolled factors that may be present. Click on the order button to switch back and forth
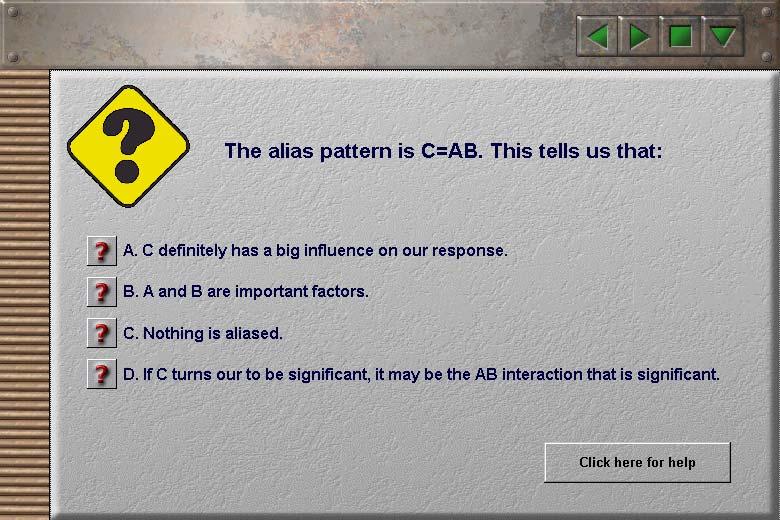
8 between standard and random order. We will use standard order for this experiment. NOTE: When DOE Wisdom provides a resolution of V, it implies resolution V or higher. In our experiment, there will be no center point.the number of design runs is 8. Since we have three replicates the number of total runs is 24, or 3 times 8. Since this is a full-factorial design, there is no alias pattern to view. Once the factors, responses, design type, and order have been defined, simply choose the OK


9 command button to accept this design.
10

11 Three new folders will now appear in the project window; the design report folder, the worksheet folder, and the data folder.double-click on the design report folder. The DOE Wisdom design report folder will appear. This summarizes all factor, response, and design information. The next step is to view our worksheet folder. Double-click the worksheet folder. The worksheet window will appear. DOE Wisdom will create a worksheet listing the runs to perform in the order we are to perform them. We will print out a copy of this worksheet and use it during our
12 experimental runs. Now it is time to perform our experiment. For the first run we will set the pull-back angle to 440, the hook position to 1, and the peg to 1. We will then launch the ball and measure the distance is traveled. In this case it traveled 32.5 inches. We record this distance on the worksheet. We will launch the ball two additional times with these settings and record the distances. The distances were 36 and 38.5 inches.
13 The worksheet shows that the second setup should be as follows; pull-back angle 440, hook position 1, peg position 4. After setting the statapult to these settings we now launch a ball and measure the distance. In this case the ball traveled 69 inches. This is recorded on the worksheet. All additional runs are completed as outlined on the worksheet. The final worksheet is shown here.

14 It is now time to enter our data. Double-click the data folder in the project window. The data definition window will open. Enter the results listed on the worksheet in the appropriate columns of the data entry screen. Select file and save to save your data.

15 Now it is time to analyze our data. This is where the software saves us a huge amount of time and effort, as trying to analyze the data by hand would take days.
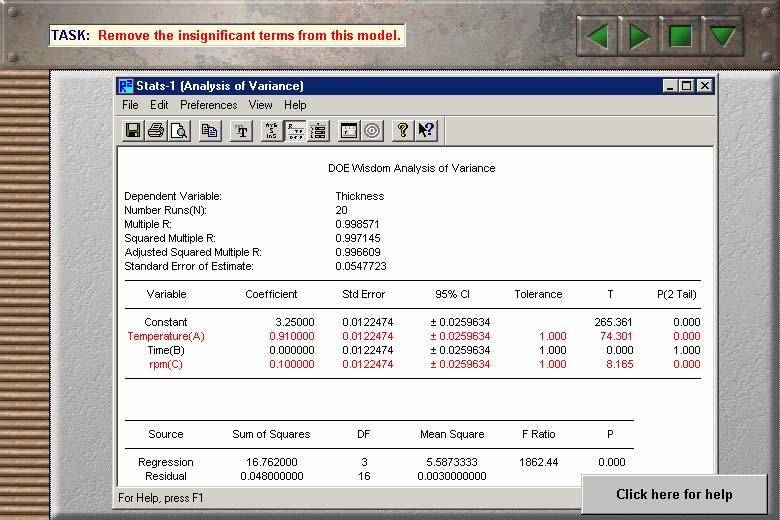
16 Once the data is entered, two additional folder appear in the project window; the graphs folder and the stats folder. Double-click on the stats folder. The analysis of variance screen will appear. Remember our previous discussions regarding the ANOVA? The first thing we want to review is the P2-Tail value for each term. If the P2-Tail value is greater than 0.1, we should remove the term from our model. In this case, the P2-Tail value for the BC interaction is and the value for the ABC interaction is We need to remove these two terms from our model. To remove the terms, select edit, and report variables. In the factor folder all highlighted terms will remain in the ANOVA. Use the mouse pointer to select the BC term and click on the left-mouse button to remove the term. Follow the same procedure to remove the ABC term. Select OK. The ANOVA now appears with both BC and ABC terms removed.

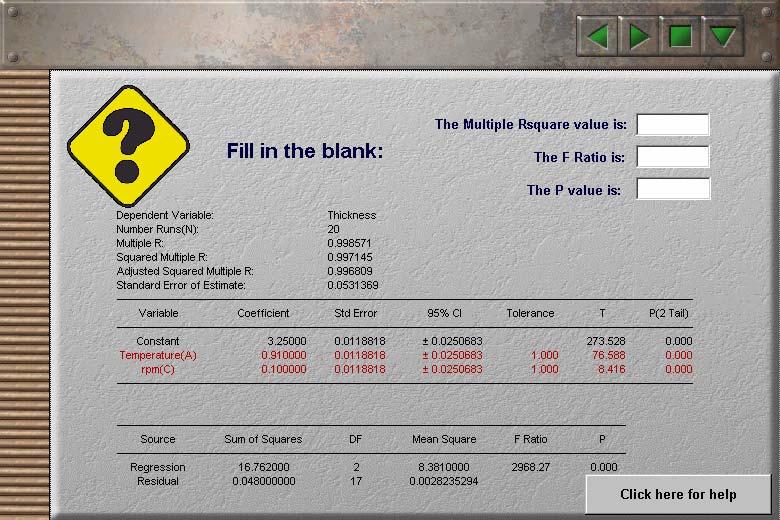
17 The following terms had a significant impact on the distance the ball traveled; pullback, hook, peg, the pullback-hook interaction or AB, and the pullback-peg interaction or AC. Our multiple-r value is This is very close to 1. Our squared multiple R value is % of the variance in the data was due to the fact the response varied for different levels of the factors. The F-Ratio is This is definitely greater than 6 and indicates that the change in the response at different settings didn t happen by chance. The p value is We can be very confident that the model detects a shift in the data.
18

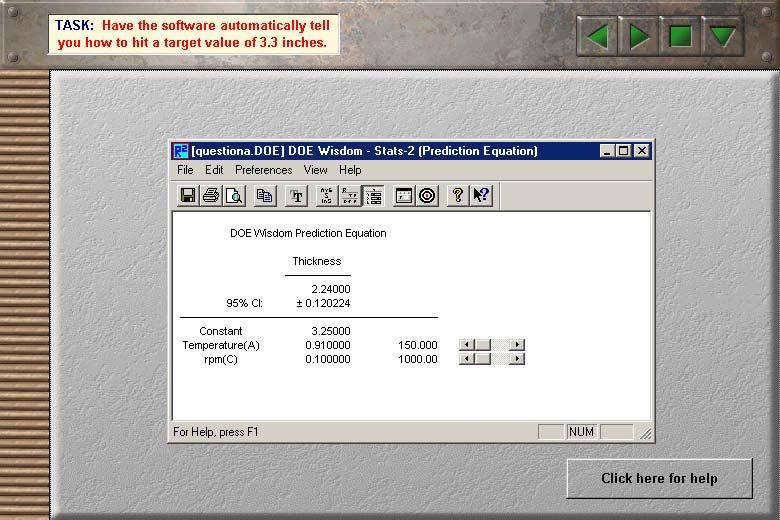
19 Now let s have the software automatically tell us how to hit a target. Click on the prediction equation button. The prediction equation screen will appear. Click on the find target button. The Find target value screen will appear. Select the target button. We would like to hit a target of 120 inches. Type this number in the target screen. Click on the search button. The software searches for the factor settings necessary to hit a distance of 120 inches. In this case, the recommended settings are; pull-back 459, hook 3, peg 4.
20
21 Let s look at some of the graphs we discussed in previous modules. In the project window, double-click the graphs folder. The Pareto Chart will appear. The Pareto Chart shows vertical bars with heights proportional to the average delta over 2 values for each factor interaction. Since the ABC and BC interactions were not statistically significant, we would like to remove them from our Pareto Chart. Select edit, and graph. The edit graph tabs appear. Click on the factors tab. Remove the ABC and BC terms. The Pareto Chart now appears without these terms.
22 We can also edit the Pareto Bar colors and style, select edit, and graph. Click on the factor display tab. Highlight pull-back. Click on fill style and select solid. Click on fill color and select red. Click on the OK button. The Pareto Chart now appears as shown here.
23 Click on the scatter-plot button to view the scatter plot. It initially displays only pull-back. Let s add the other two factors. Select edit and graph, select the factors tab, and add the hook and peg factors. The graph now appears as shown here.
24 Click on the main-effects button. The main-effects graph appears. Notice that pull-back, hook, and peg have the greatest slope. The BC, and ABC interactions have very little slope.

25 Click on the interactions button.the pullback-hook interaction appears. To add the other interactions, select edit and graph. Click on the factors tab and add the other two interactions. Select OK. The graph will now appear as shown here. Click on the contour plot button. The contour plot appears. Remember the hit a target feature predicted we could hit a target of 120 inches by setting pullback to 459, hook to 3, and peg to 4. To set the peg to 4, click on the edit model button. Slide the peg value to 4. Select file and exit. The peg value will change to 4. If we set pullback to 459 and hook to 3, the contour plot shows a predicted value of 120 inches.

26 Click on the response surface button. The response surface graph appears. You can rotate the graph by clicking on the horizontal and vertical arrows. This allows you to see a 3-dimensional view of your model.


27 This concludes module 6, in this lesson we have shown how to use design of experiments software. The use of software is vital to the successful implementation of experimental design. In the next lesson we will show some examples of how others have used these powerful tools to save time and money.
CHAPTER 2 DESIGN DEFINITION
 CHAPTER 2 DESIGN DEFINITION Wizard Option The Wizard is a powerful tool available in DOE Wisdom to help with the set-up and analysis of your Screening or Modeling experiment. The Wizard walks you through
For our example, we will look at the following factors and factor levels.
 In order to review the calculations that are used to generate the Analysis of Variance, we will use the statapult example. By adjusting various settings on the statapult, you are able to throw the ball
CHAPTER 1 GETTING STARTED
 CHAPTER 1 GETTING STARTED Configuration Requirements This design of experiment software package is written for the Windows 2000, XP and Vista environment. The following system requirements are necessary
A cell is highlighted when a thick black border appears around it. Use TAB to move to the next cell to the LEFT. Use SHIFT-TAB to move to the RIGHT.
 Instructional Center for Educational Technologies EXCEL 2010 BASICS Things to Know Before You Start The cursor in Excel looks like a plus sign. When you click in a cell, the column and row headings will
Statistics with a Hemacytometer
 Statistics with a Hemacytometer Overview This exercise incorporates several different statistical analyses. Data gathered from cell counts with a hemacytometer is used to explore frequency distributions
BioFuel Graphing instructions using Microsoft Excel 2003 (Microsoft Excel 2007 instructions start on page mei-7)
") BioFuel Graphing instructions using Microsoft Excel 2003 (Microsoft Excel 2007 instructions start on page mei-7) Graph as a XY Scatter Chart, add titles for chart and axes, remove gridlines. A. Select
BioFuel Graphing instructions using Microsoft Excel 2003 (Microsoft Excel 2007 instructions start on page mei-7) Graph as a XY Scatter Chart, add titles for chart and axes, remove gridlines. A. Select
Using Charts in a Presentation 6
 Using Charts in a Presentation 6 LESSON SKILL MATRIX Skill Exam Objective Objective Number Building Charts Create a chart. Import a chart. Modifying the Chart Type and Data Change the Chart Type. 3.2.3
Chapter 2 Surfer Tutorial
 Chapter 2 Surfer Tutorial Overview This tutorial introduces you to some of Surfer s features and shows you the steps to take to produce maps. In addition, the tutorial will help previous Surfer users learn
Section 4 General Factorial Tutorials
 Section 4 General Factorial Tutorials General Factorial Part One: Categorical Introduction Design-Ease software version 6 offers a General Factorial option on the Factorial tab. If you completed the One
Design and Analysis of Experiments Prof. Jhareswar Maiti Department of Industrial and Systems Engineering Indian Institute of Technology, Kharagpur
 Design and Analysis of Experiments Prof. Jhareswar Maiti Department of Industrial and Systems Engineering Indian Institute of Technology, Kharagpur Lecture 59 Fractional Factorial Design using MINITAB
Creating a Text Frame. Create a Table and Type Text. Pointer Tool Text Tool Table Tool Word Art Tool
 Pointer Tool Text Tool Table Tool Word Art Tool Picture Tool Clipart Tool Creating a Text Frame Select the Text Tool with the Pointer Tool. Position the mouse pointer where you want one corner of the text
Creating Charts in Office 2007 Table of Contents
 Table of Contents Microsoft Charts... 1 Inserting a Chart in Excel... 1 Tip Shortcut Key to Create a Default Chart in Excel... 2 Activating Your Chart... 2 Resizing an Embedded Chart... 2 Moving a Chart...
Data Management Project Using Software to Carry Out Data Analysis Tasks
 Data Management Project Using Software to Carry Out Data Analysis Tasks This activity involves two parts: Part A deals with finding values for: Mean, Median, Mode, Range, Standard Deviation, Max and Min
Learning Log Title: CHAPTER 6: TRANSFORMATIONS AND SIMILARITY. Date: Lesson: Chapter 6: Transformations and Similarity
 Chapter 6: Transformations and Similarity CHAPTER 6: TRANSFORMATIONS AND SIMILARITY Date: Lesson: Learning Log Title: Date: Lesson: Learning Log Title: Chapter 6: Transformations and Similarity Date: Lesson:
Bluman & Mayer, Elementary Statistics, A Step by Step Approach, Canadian Edition
 Bluman & Mayer, Elementary Statistics, A Step by Step Approach, Canadian Edition Online Learning Centre Technology Step-by-Step - Minitab Minitab is a statistical software application originally created
Excel 2013 Charts and Graphs
 Excel 2013 Charts and Graphs Copyright 2016 Faculty and Staff Training, West Chester University. A member of the Pennsylvania State System of Higher Education. No portion of this document may be reproduced
Data Analysis Guidelines
 Data Analysis Guidelines DESCRIPTIVE STATISTICS Standard Deviation Standard deviation is a calculated value that describes the variation (or spread) of values in a data set. It is calculated using a formula
OrgPublisher Advanced Box Layout Editor
 OrgPublisher Advanced Box Layout Editor OrgPublisher Table of Contents Table of Contents... 3 Using the... 3 Arranging Chart Box Sections... 3 Sizing the Chart Box Section... 4 Moving, Deleting, or Resizing
= 3 + (5*4) + (1/2)*(4/2)^2.
 + (1/2)*(4/2)^2.") Physics 100 Lab 1: Use of a Spreadsheet to Analyze Data by Kenneth Hahn and Michael Goggin In this lab you will learn how to enter data into a spreadsheet and to manipulate the data in meaningful ways.
Physics 100 Lab 1: Use of a Spreadsheet to Analyze Data by Kenneth Hahn and Michael Goggin In this lab you will learn how to enter data into a spreadsheet and to manipulate the data in meaningful ways.
INSTRUCTIONS FOR USING MICROSOFT EXCEL PERFORMING DESCRIPTIVE AND INFERENTIAL STATISTICS AND GRAPHING
 APPENDIX INSTRUCTIONS FOR USING MICROSOFT EXCEL PERFORMING DESCRIPTIVE AND INFERENTIAL STATISTICS AND GRAPHING (Developed by Dr. Dale Vogelien, Kennesaw State University) ** For a good review of basic
Excel Spreadsheets and Graphs
 Excel Spreadsheets and Graphs Spreadsheets are useful for making tables and graphs and for doing repeated calculations on a set of data. A blank spreadsheet consists of a number of cells (just blank spaces
Excel 2010 Charts and Graphs
 Excel 2010 Charts and Graphs In older versions of Excel the chart engine looked tired and old. Little had changed in 15 years in charting. The popular chart wizard has been replaced in Excel 2010 by a
Years after US Student to Teacher Ratio
 The goal of this assignment is to create a scatter plot of a set of data. You could do this with any two columns of data, but for demonstration purposes we ll work with the data in the table below. The
Introduction to Excel Workshop
 Introduction to Excel Workshop Empirical Reasoning Center September 9, 2016 1 Important Terminology 1. Rows are identified by numbers. 2. Columns are identified by letters. 3. Cells are identified by the
Microsoft PowerPoint 2002
 Microsoft PowerPoint 2002 Creating a New Presentation Upon opening, PowerPoint 2002 will display a blank title slide for a new presentation. You can begin creating a PowerPoint presentation by typing the
KIN 147 Lab Practical Mid-term: Tibial Acceleration Data Analysis Excel analyses work much better on PCs than on Macs (especially older Macs)
") KIN 147 Lab Practical Mid-term: Tibial Acceleration Data Analysis Excel analyses work much better on PCs than on Macs (especially older Macs) Your goal is to correctly analyze accelerometer data Analyzing
KIN 147 Lab Practical Mid-term: Tibial Acceleration Data Analysis Excel analyses work much better on PCs than on Macs (especially older Macs) Your goal is to correctly analyze accelerometer data Analyzing
Microsoft Excel 2002 M O D U L E 2
 THE COMPLETE Excel 2002 M O D U L E 2 CompleteVISUAL TM Step-by-step Series Computer Training Manual www.computertrainingmanual.com Copyright Notice Copyright 2002 EBook Publishing. All rights reserved.
Patterning Math Lab 4a
 Patterning Math Lab 4a This lab is an exploration of transformations of functions, a topic covered in your Precalculus textbook in Section 1.5. As you do the exercises in this lab you will be closely reading
Microsoft Excel 2007 Creating a XY Scatter Chart
 Microsoft Excel 2007 Creating a XY Scatter Chart Introduction This document will walk you through the process of creating a XY Scatter Chart using Microsoft Excel 2007 and using the available Excel features
Subject: Computer Applications Grade: 9th Mr. Holmes Unit Lesson Layer Duration MS Excel Chapter: 7 - Creating a Chart in Excel
 Subject: Computer Applications Grade: 9th Mr. Holmes Unit Lesson Layer Duration MS Excel Chapter: 7 - Creating a Chart in Excel Applied (do) 3/11/13 3/2/13 Essential Questions What do you think about,
1. What specialist uses information obtained from bones to help police solve crimes?
 Mathematics: Modeling Our World Unit 4: PREDICTION HANDOUT VIDEO VIEWING GUIDE H4.1 1. What specialist uses information obtained from bones to help police solve crimes? 2.What are some things that can
Microsoft Excel. Charts
 Microsoft Excel Charts Chart Wizard To create a chart in Microsoft Excel, select the data you wish to graph or place yourself with in the conjoining data set and choose Chart from the Insert menu, or click
KIN 147 Lab 02: Acceleration Data Analysis
 KIN 147 Lab 02: Acceleration Data Analysis Excel analyses work much better on PCs than on Macs (especially older Macs) Your goal is to correctly analyze accelerometer data Analyzing the Acceleration Data
DESIGN, ANALYSIS AND MATHEMATICAL MODELLING: EFFICYCLE
 DESIGN, ANALYSIS AND MATHEMATICAL MODELLING: EFFICYCLE 1 AASHIMA LOHCHAB, 2 MANSI AGGARWAL, 3 MEENAKSHI GOEL, 4 SHREYA SINGH, 5 VIVEK CHAWLA, 6 N.R. CHAUHAN 1 MAE Dept., Indira Gandhi Delhi Technical University
Math 227 EXCEL / MEGASTAT Guide
 Math 227 EXCEL / MEGASTAT Guide Introduction Introduction: Ch2: Frequency Distributions and Graphs Construct Frequency Distributions and various types of graphs: Histograms, Polygons, Pie Charts, Stem-and-Leaf
EXCEL BASICS: MICROSOFT OFFICE 2007
 EXCEL BASICS: MICROSOFT OFFICE 2007 GETTING STARTED PAGE 02 Prerequisites What You Will Learn USING MICROSOFT EXCEL PAGE 03 Opening Microsoft Excel Microsoft Excel Features Keyboard Review Pointer Shapes
Total Number of Students in US (millions)
") The goal of this technology assignment is to graph a formula on your calculator and in Excel. This assignment assumes that you have a TI 84 or similar calculator and are using Excel 2007. The formula you
The goal of this technology assignment is to graph a formula on your calculator and in Excel. This assignment assumes that you have a TI 84 or similar calculator and are using Excel 2007. The formula you
General Factorial Models
 In Chapter 8 in Oehlert STAT:5201 Week 9 - Lecture 2 1 / 34 It is possible to have many factors in a factorial experiment. In DDD we saw an example of a 3-factor study with ball size, height, and surface
Plotting Graphs. Error Bars
 E Plotting Graphs Construct your graphs in Excel using the method outlined in the Graphing and Error Analysis lab (in the Phys 124/144/130 laboratory manual). Always choose the x-y scatter plot. Number
GeoGebra. 10 Lessons. maths.com. Gerrit Stols. For more info and downloads go to:
 GeoGebra in 10 Lessons For more info and downloads go to: http://school maths.com Gerrit Stols Acknowledgements Download GeoGebra from http://www.geogebra.org GeoGebra is dynamic mathematics open source
SUM - This says to add together cells F28 through F35. Notice that it will show your result is
 COUNTA - The COUNTA function will examine a set of cells and tell you how many cells are not empty. In this example, Excel analyzed 19 cells and found that only 18 were not empty. COUNTBLANK - The COUNTBLANK
Geometer s Sketchpad Techno Polly
 Geometer s Sketchpad Techno Polly Opening an Existing Sketch 1. To open an existing sketch in Geometer s Sketchpad, first click on the icon on your desktop then when the program opens click on File, Open.
Creating Automated Dashboard Excel 2013 Contents
 Creating Automated Dashboard Excel 2013 Contents Summarize Data Using Pivot Table... 2 Constructing Report Summary... 2 Create a PivotTable from worksheet data... 2 Add fields to a PivotTable... 2 Grouping
Data Visualization SURFACE WATER MODELING SYSTEM. 1 Introduction. 2 Data sets. 3 Open the Geometry and Solution Files
 SURFACE WATER MODELING SYSTEM Data Visualization 1 Introduction It is useful to view the geospatial data utilized as input and generated as solutions in the process of numerical analysis. It is also helpful
Controlling the Control Palette
 Controlling the Control Palette By Olav Martin Kvern Presented at the PageMaker Conference, Dallas November 11 13, 1996 Click here to return to the Thunder Lizard Productions home page. www.thunderlizard.com
Technology Assignment: Limits at Infinity
 The goal of this technology assignment is to find the location of the horizontal asymptote for your model from Technology Assignment: Rational Model. You will produce a graph similar to the one below.
Excel. Spreadsheet functions
 Excel Spreadsheet functions Objectives Week 1 By the end of this session you will be able to :- Move around workbooks and worksheets Insert and delete rows and columns Calculate with the Auto Sum function
v SMS 11.1 Tutorial Data Visualization Requirements Map Module Mesh Module Time minutes Prerequisites None Objectives
 v. 11.1 SMS 11.1 Tutorial Data Visualization Objectives It is useful to view the geospatial data utilized as input and generated as solutions in the process of numerical analysis. It is also helpful to
Chemistry 1A Graphing Tutorial CSUS Department of Chemistry
 Chemistry 1A Graphing Tutorial CSUS Department of Chemistry Please go to the Lab webpage to download your own copy for reference. 1 When you open Microsoft Excel 2003, you will see a blank worksheet: Enter
Pre-Lab Excel Problem
 Pre-Lab Excel Problem Read and follow the instructions carefully! Below you are given a problem which you are to solve using Excel. If you have not used the Excel spreadsheet a limited tutorial is given
EXCEL BASICS: MICROSOFT OFFICE 2010
 EXCEL BASICS: MICROSOFT OFFICE 2010 GETTING STARTED PAGE 02 Prerequisites What You Will Learn USING MICROSOFT EXCEL PAGE 03 Opening Microsoft Excel Microsoft Excel Features Keyboard Review Pointer Shapes
Excel Tips and FAQs - MS 2010
 BIOL 211D Excel Tips and FAQs - MS 2010 Remember to save frequently! Part I. Managing and Summarizing Data NOTE IN EXCEL 2010, THERE ARE A NUMBER OF WAYS TO DO THE CORRECT THING! FAQ1: How do I sort my
Excel R Tips. is used for multiplication. + is used for addition. is used for subtraction. / is used for division
 Excel R Tips EXCEL TIP 1: INPUTTING FORMULAS To input a formula in Excel, click on the cell you want to place your formula in, and begin your formula with an equals sign (=). There are several functions
Lesson 1: Creating T- Spline Forms. In Samples section of your Data Panel, browse to: Fusion 101 Training > 03 Sculpt > 03_Sculpting_Introduction.
 3.1: Sculpting Sculpting in Fusion 360 allows for the intuitive freeform creation of organic solid bodies and surfaces by leveraging the T- Splines technology. In the Sculpt Workspace, you can rapidly
Getting Started with DADiSP
 Section 1: Welcome to DADiSP Getting Started with DADiSP This guide is designed to introduce you to the DADiSP environment. It gives you the opportunity to build and manipulate your own sample Worksheets
Microsoft Excel 2007
 Microsoft Excel 2007 1 Excel is Microsoft s Spreadsheet program. Spreadsheets are often used as a method of displaying and manipulating groups of data in an effective manner. It was originally created
How do you roll? Fig. 1 - Capstone screen showing graph areas and menus
 How do you roll? Purpose: Observe and compare the motion of a cart rolling down hill versus a cart rolling up hill. Develop a mathematical model of the position versus time and velocity versus time for
Math 121 Project 4: Graphs
 Math 121 Project 4: Graphs Purpose: To review the types of graphs, and use MS Excel to create them from a dataset. Outline: You will be provided with several datasets and will use MS Excel to create graphs.
Premier Literacy Tools
 Premier Literacy Tools Tutorial Guide A step-by-step guide to the most popular tools in Premier Literacy Tools. Created by: Heather Harris, Special Education Coach Intern Table of Contents Talking Word
Lastly, in case you don t already know this, and don t have Excel on your computers, you can get it for free through IT s website under software.
 Welcome to Basic Excel, presented by STEM Gateway as part of the Essential Academic Skills Enhancement, or EASE, workshop series. Before we begin, I want to make sure we are clear that this is by no means
v Data Visualization SMS 12.3 Tutorial Prerequisites Requirements Time Objectives Learn how to import, manipulate, and view solution data.
 v. 12.3 SMS 12.3 Tutorial Objectives Learn how to import, manipulate, and view solution data. Prerequisites None Requirements GIS Module Map Module Time 30 60 minutes Page 1 of 16 Aquaveo 2017 1 Introduction...
Models for Nurses: Quadratic Model ( ) Linear Model Dx ( ) x Models for Doctors:
 Linear Model Dx ( ) x Models for Doctors:") The goal of this technology assignment is to graph several formulas in Excel. This assignment assumes that you using Excel 2007. The formula you will graph is a rational function formed from two polynomials,
The goal of this technology assignment is to graph several formulas in Excel. This assignment assumes that you using Excel 2007. The formula you will graph is a rational function formed from two polynomials,
4-8 Similar Figures and Proportions. Warm Up Problem of the Day Lesson Presentation Lesson Quizzes
 Warm Up Problem of the Day Lesson Presentation Lesson Quizzes Warm Up Find the cross products, and then tell whether the ratios are equal. 1. 16, 40 6 15 2. 3. 3 8, 18 46 8, 24 9 27 4. 28, 42 12 18 240
The Mathcad Workspace 7
 For information on system requirements and how to install Mathcad on your computer, refer to Chapter 1, Welcome to Mathcad. When you start Mathcad, you ll see a window like that shown in Figure 2-1. By
Instructions for Using ABCalc James Alan Fox Northeastern University Updated: August 2009
 Instructions for Using ABCalc James Alan Fox Northeastern University Updated: August 2009 Thank you for using ABCalc, a statistical calculator to accompany several introductory statistics texts published
Complete Assignment #1 listed below on WK #1 in packet. Textbook required!!!
 400Algebra 2H ASSIGNMENT SHEETrev14 CHAPTER 3: Linear Functions with Review of Chapter 1 and 2 (3-1 to 3-4 Highlights on reverse side) Directions: 1. Review classwork and read each section in textbook
4. In the Change Chart Type dialog box, click the type of chart to which you want to change. 5. Click the chart style. 6. Click OK.
 PROCEDURES LESSON 21: BUILDING BASIC CHARTS Creating a Chart 1 Select the range of data you want to chart 2 Click the INSERT tab Charts Group 3 Click the desired chart category button 4 In the gallery,
Fractional. Design of Experiments. Overview. Scenario
 Design of Experiments Overview We are going to learn about DOEs. Specifically, you ll learn what a DOE is, as well as, what a key concept known as Confounding is all about. Finally, you ll learn what the
How to use Excel Spreadsheets for Graphing
 How to use Excel Spreadsheets for Graphing 1. Click on the Excel Program on the Desktop 2. You will notice that a screen similar to the above screen comes up. A spreadsheet is divided into Columns (A,
Project 11 Graphs (Using MS Excel Version )
") Project 11 Graphs (Using MS Excel Version 2007-10) Purpose: To review the types of graphs, and use MS Excel 2010 to create them from a dataset. Outline: You will be provided with several datasets and will
Project 11 Graphs (Using MS Excel Version 2007-10) Purpose: To review the types of graphs, and use MS Excel 2010 to create them from a dataset. Outline: You will be provided with several datasets and will
HOUR 12. Adding a Chart
 HOUR 12 Adding a Chart The highlights of this hour are as follows: Reasons for using a chart The chart elements The chart types How to create charts with the Chart Wizard How to work with charts How to
Sec 4.1 Coordinates and Scatter Plots. Coordinate Plane: Formed by two real number lines that intersect at a right angle.
 Algebra I Chapter 4 Notes Name Sec 4.1 Coordinates and Scatter Plots Coordinate Plane: Formed by two real number lines that intersect at a right angle. X-axis: The horizontal axis Y-axis: The vertical
8. MINITAB COMMANDS WEEK-BY-WEEK
 8. MINITAB COMMANDS WEEK-BY-WEEK In this section of the Study Guide, we give brief information about the Minitab commands that are needed to apply the statistical methods in each week s study. They are
General Factorial Models
 In Chapter 8 in Oehlert STAT:5201 Week 9 - Lecture 1 1 / 31 It is possible to have many factors in a factorial experiment. We saw some three-way factorials earlier in the DDD book (HW 1 with 3 factors:
Adjust model for 3D Printing. Direct modeling tools 13,0600,1489,1616(SP6)
") Adjust model for 3D Printing Direct modeling tools 13,0600,1489,1616(SP6) Sometimes, the model needs to be prepared or adapted for printing. Adding material, change of a draft angles are an example. In
Adjust model for 3D Printing Direct modeling tools 13,0600,1489,1616(SP6) Sometimes, the model needs to be prepared or adapted for printing. Adding material, change of a draft angles are an example. In
11.4. Imagine that you are, right now, facing a clock and reading the time on that. Spin to Win. Volume of Cones and Pyramids
 Spin to Win Volume of Cones and Pyramids.4 Learning Goals In this lesson, you will: Rotate two-dimensional plane figures to generate three-dimensional figures. Give an informal argument for the volume
Microsoft Excel Using Excel in the Science Classroom
 Microsoft Excel Using Excel in the Science Classroom OBJECTIVE Students will take data and use an Excel spreadsheet to manipulate the information. This will include creating graphs, manipulating data,
Perimeter and Area of Geometric Figures on the Coordinate Plane
 Perimeter and Area of Geometric Figures on the Coordinate Plane There are more than 200 national flags in the world. One of the largest is the flag of Brazil flown in Three Powers Plaza in Brasilia. This
Session One: MINITAB Basics
 8 Session One: MINITAB Basics, 8-2 Start MINITAB, 8-3 Open a Worksheet, 8-3 Enter Data from the Keyboard, 8-4 Enter Patterned Data, 8-4 Save Your Project, 8-5 Compute Descriptive Statistics, 8-6 Perform
Scottish Improvement Skills
 Scottish Improvement Skills Creating a run chart on MS Excel 2007 Create and save a new Excel worksheet. Some of the details of steps given below may vary slightly depending on how Excel has been used
To be able to create charts that graphically represent your worksheet data, you will: Create column charts on chart sheets by using the F11 key.
 L E S S O N 1 Creating charts Suggested teaching time 55-65 minutes Lesson objectives To be able to create charts that graphically represent your worksheet data, you will: a b c Create column charts on
7-5 Parametric Equations
 3. Sketch the curve given by each pair of parametric equations over the given interval. Make a table of values for 6 t 6. t x y 6 19 28 5 16.5 17 4 14 8 3 11.5 1 2 9 4 1 6.5 7 0 4 8 1 1.5 7 2 1 4 3 3.5
This book is about using Microsoft Excel to
 Introducing Data Analysis with Excel This book is about using Microsoft Excel to analyze your data. Microsoft Excel is an electronic worksheet you can use to perform mathematical, financial, and statistical
Microsoft Excel Microsoft Excel
 Excel 101 Microsoft Excel is a spreadsheet program that can be used to organize data, perform calculations, and create charts and graphs. Spreadsheets or graphs created with Microsoft Excel can be imported
addition + =5+C2 adds 5 to the value in cell C2 multiplication * =F6*0.12 multiplies the value in cell F6 by 0.12
 BIOL 001 Excel Quick Reference Guide (Office 2010) For your lab report and some of your assignments, you will need to use Excel to analyze your data and/or generate graphs. This guide highlights specific
Adjust model for 3D Printing. Positioning - Consider Other Parts 13,0600,1489,1635(SP6)
") Adjust model for 3D Printing 13,0600,1489,1635(SP6) In this exercise, we will learn about parts positioning, and in particular, about the option Consider Other Parts. As we Position and Orientate parts
Adjust model for 3D Printing 13,0600,1489,1635(SP6) In this exercise, we will learn about parts positioning, and in particular, about the option Consider Other Parts. As we Position and Orientate parts
Select the Points You ll Use. Tech Assignment: Find a Quadratic Function for College Costs
 In this technology assignment, you will find a quadratic function that passes through three of the points on each of the scatter plots you created in an earlier technology assignment. You will need the
Spreadsheet View and Basic Statistics Concepts
 Spreadsheet View and Basic Statistics Concepts GeoGebra 3.2 Workshop Handout 9 Judith and Markus Hohenwarter www.geogebra.org Table of Contents 1. Introduction to GeoGebra s Spreadsheet View 2 2. Record
Technology Assignment: Scatter Plots
 The goal of this assignment is to create a scatter plot of a set of data. You could do this with any two columns of data, but for demonstration purposes we ll work with the data in the table below. You
What we will learn in Introduction to Excel. How to Open Excel. Introduction to Excel 2010 Lodi Memorial Library NJ Developed by Barb Hauck-Mah
 Introduction to Excel 2010 Lodi Memorial Library NJ Developed by Barb Hauck-Mah What is Excel? It is a Microsoft Office computer software program to organize and analyze numbers, data and labels in spreadsheet
Activity 1 Creating a simple gradebook
 Activity 1 Creating a simple gradebook 1 Launch Excel to start a new spreadsheet a. Click on the Excel icon to start a new workbook, either from the start menu, Office Toolbar, or an Excel icon on the
MOVING FROM CELL TO CELL
 VCAE: EXCEL Lesson 1 Please send comments to Author: Zahra Siddiqui at zed_ess@hotmail.com Concepts Covered: Cell Address; Cell Pointer; Moving across Cells Constants: Entering, Editing, Formatting Using
Troubleshooting in Microsoft Excel 2002
 Page 1 of 8 Troubleshooting in Microsoft Excel 2002 Result: To understand how to work with the Excel software to enter data, navigate the page, and print materials. Tabs Look at the tabs at the bottom
Quality and Six Sigma Tools using MINITAB Statistical Software: A complete Guide to Six Sigma DMAIC Tools using MINITAB
 Samples from MINITAB Book Quality and Six Sigma Tools using MINITAB Statistical Software A complete Guide to Six Sigma DMAIC Tools using MINITAB Prof. Amar Sahay, Ph.D. One of the major objectives of this
Reviewing Hidden Content during Native Review
 Reviewing Hidden Content during Native Review Introduction When conducting a native file review it is important to note that certain files can have hidden content. These are features of certain software
SOLIDWORKS: Lesson 1 - Basics and Modeling. Introduction to Robotics
 SOLIDWORKS: Lesson 1 - Basics and Modeling Fundamentals Introduction to Robotics SolidWorks SolidWorks is a 3D solid modeling package which allows users to develop full solid models in a simulated environment
1-1. Points, Lines, and Planes. Lesson 1-1. What You ll Learn. Active Vocabulary
 1-1 Points, Lines, and Planes What You ll Learn Scan the text in Lesson 1-1. Write two facts you learned about points, lines, and planes as you scanned the text. 1. Active Vocabulary 2. New Vocabulary
How to Open Excel. Introduction to Excel TIP: Right click Excel on list and select PIN to Start Menu. When you open Excel, a new worksheet opens
 Introduction to Excel 2010 What is Excel? It is a Microsoft Office computer software program to organize and analyze numbers, data and labels in spreadsheet form. Excel makes it easy to translate data
252 APPENDIX D EXPERIMENT 1 Introduction to Computer Tools and Uncertainties
 252 APPENDIX D EXPERIMENT 1 Introduction to Computer Tools and Uncertainties Objectives To become familiar with the computer programs and utilities that will be used throughout the semester. You will learn
Word 3 Microsoft Word 2013
 Word 3 Microsoft Word 2013 Mercer County Library System Brian M. Hughes, County Executive Action Technique 1. Insert a Text Box 1. Click the Insert tab on the Ribbon. 2. Then click on Text Box in the Text