UAccess ANALYTICS. Fundamentals of Reporting. updated v.1.00
|
|
|
- Deirdre Burns
- 5 years ago
- Views:
Transcription


1 UAccess ANALYTICS Arizona Board of Regents, 2010 THE UNIVERSITY OF ARIZONA updated v.1.00 For information and permission to use our PDF manuals, please contact PDFs available at
2 COPYRIGHT & TRADEMARKS Copyright 2010 Arizona Board of Regents. All rights reserved. Record of Changes Date Version # Description 07/01/ Original
3 Table of Contents About this Workshop...v Access to Analytics Data...v Mosaic Community...v... 1 Reporting Concepts...1 Where does the Data come from?...1 What is a Report?...3 What is a Dashboard?...5 Quick Review Reporting Fundamentals...7 Analytics Answers...9 What is a Subject Area?...9 Choosing Your Subject Area...11 What Are Columns & Tables?...13 Viewing Columns...17 Planning Your Request...21 Building a Request...25 Quick Review - Building a Request...31 What is a Filter?...33 Adding a Filter...35 Basic Formatting...39 Saving your Request...43 Quick Review - Adding a Filter and Basic Formatting...45 Exercise - Employee List...47 Analytics Dashboards...49 Adding Requests to a Dashboard...49 Page iii
4 Page iv

5 About this Workshop This UAccess Analytics workshop is designed to help you become familiar with the fundamentals of reporting. If youʼve never written a report before, you probably have some questions. Whatʼs a column? Whatʼs a table? Where does the data come from? What is meant by the terms request and dashboard? This workshop will answer these questions and more. You will build a very simple report with a filter, and then you will add that report to a basic dashboard. For information on additional workshops in which you can further your knowledge of Requests and Dashboards, please go to the Workshops and Training Team website at Access to Analytics Data Request for individual access to UAccess Analytics: have your Supervisor submit a request via Mosaic Community The Mosaic Community is an online networking resource available to everyone on campus who is affected by the Mosaic project. If you have an official UA address, you can request membership in the Mosaic Community. Just go to and click the Sign Up link in the upper right corner of the screen. Once your membership is confirmed usually within a few hours youʼll have access to valuable information about all of the various aspects of the Mosaic Project. Youʼll want to join one or more of the groups within the Community, because thatʼs where the value comes in. Join the UAccess Analytics Group in the Mosaic Community for information specific to report writing and dashboard creation. In each of the group areas, there are short videos showing you how to perform different tasks, discussion boards with questions from campus and answers from the experts, and information on upcoming workshops from the Workshops and Training Team. Please take advantage of the opportunity and become a member of the Mosaic Community. Page v
6 Page vi


7 Reporting Concepts Where does the Data come from? The data available to us in UAccess Analytics currently comes from two sources: UAccess Employee and UAccess Student. Those sources are sometimes called transaction systems. Eventually, data will also be available from UAccess Financials (the replacement for FRS) and UAccess Research (the replacement software for SPINS). Each field in those transaction systems translates directly or indirectly to a column of data in UAccess Analytics. Transaction System The software you can use to enter data and change information UAccess Analytics The software you can use to look up large sets of information and build reports How do I know when to use the transaction system and when to use UAccess Analytics? Use the transaction system when you need to edit information or to look up one particular detail in real time. Page 1
8 Page 2


9 What is a Report? Reports are simply documents printed or electronic that show specific, focused content to a specific audience. Reports can be used to convey student, employee, classroom, department, grading, payroll, and many other types of information. In UAccess Analytics, reports are called requests. UAccess Analytics makes building a request fairly simple. To build a request, you will select the area of the data warehouse that holds the information you need that's called the Subject Area. From that Subject Area, you will select the specific information you need. Then you will tell the system to limit, or filter, that information so you get exactly what you need. Data Warehouse The repository where raw data from the transaction systems is collected and organized into Subject Areas Subject Area A collection of related information within UAccess Analytics Report / Request A subset of that information deliberately chosen and arranged to help answer questions Filter A tool that limits the rows of data in the column to just the ones you want to see The top part of the image shows the structure of a request. You can see the columns of information you've included. The lower part of the image displays the results of that same request. The data that is displayed is based on the structure of the request. Page 3
10 Page 4


11 What is a Dashboard? A dashboard is a collection of requests presented on web pages for quick and easy viewing. Benefits of using dashboards include: Dashboards are always accessible Data is automatically updated, usually overnight You can "drill-down" on many reports, accessing more detailed information with each click In UAccess Analytics, there are two different types of dashboards. There are shared dashboards, which can be shared among different groups of people for different purposes. For example, a department might have a shared dashboard on which there are reports that everyone in the department needs to see. Another example might be a dean's dashboard, which the deans of all of the colleges on campus might have access to. No one else would be able to see either dashboard, or even know it existed, except those for whom the dashboard had been built. Shared Dashboards Collections of requests available to multiple people either across campus, within a department, or within a small set of people Personal Dashboards A collection of requests visible only to the person who created it Each person also has their own personal dashboard available for their own use. You are the only person who can ever have access to your personal dashboard. Your personal dashboard is the place in which to store those requests you need to see on a regular basis. Page 5
12 Page 6
13 Quick Review Reporting Fundamentals 1. Currently, the data available in UAccess Analytics comes from the transaction systems. Those systems include and. 2. You will use a transaction system if you need to. 3. dashboards can be viewed by multiple people. 4. Each person also has their own available for their own use. Page 7
14 Page 8

15 Analytics Answers What is a Subject Area? Subject Areas are groups of related information within UAccess Analytics. A Subject Area gives you access to the data you will use to build a request. Each Subject Area has a short paragraph of information describing the general data that exists within that Subject Area. The Subject Areas you will see in the actual Analytics system will depend on the Analytics Roles you've been assigned. Those roles are the ones you saw previously on the MyBI shared dashboard page. Below are examples of Subject Areas. Currently, Subject Areas are available for Employee and Student Data. Eventually there will be Subject Areas available for Financials and Research. Page 9
16 Page 10

17 Choosing Your Subject Area Procedure You begin building a Request by choosing the appropriate Subject Area. You will need to decide which area best fits your criteria. 1. Click the Answers link. 2. When you click the Answers link from anywhere in the UAccess Analytics software, you are redirected to Analytics Answers, that portion of the software in which you can build your requests. Page 11
18 3. In Analytics Answers, the left side of the screen is called the Selection Pane. The Selection Pane on the initial screen contains your personal folders starting with My Folders (yours is currently empty), as well as any Shared Folders you might have access to. There are a few other items in the Selection Pane that will not be covered in the Fundamentals workshop. 4. On the right-hand side of the screen are the Subject Areas. If you have medium-level access to Student Administration data (BI_SA_MED), for example, you would see most of the student-based Subject Areas. 5. The center of the screen tells you how to build a new request. 6. Since you will build the same request, you will select the same Subject Area. Click the CSW - Student Records - Term Enrollment link. End of Procedure. Page 12


19 What Are Columns & Tables? The data coming from UAccess Employee and UAccess Student is collected into columns of information, and those columns of information are then collected into tables. The columns and tables are also gathered together into Subject Areas, which are made available through Analytics Answers. Columns & Tables A column is a set of data values of a particular type, such as Employee First Name. The columns provide the basic structure of the database. A table is a collection of related columns, such as Employee Contact Information. The specific values that appear in each column when you run the request are called records or rows. Each row or record provides a data value for each column. For example, a simple table that represents employees might have the following columns: Column A particular type of data, such as Employee First Name, that corresponds to a data entry field in a transaction system Table A collection of related columns, such as Employee Contact Information Subject Area A collection of related information within UAccess Analytics Empl ID Name Address line 1 Address line 2 City ZIP Code A report pulled from that Subject Area and table might look like this: Page 13


20 Tables and columns exist in UAccess Analytics, of course. When you select a Subject Area and are ready to start building your request, you will see that the tables and columns look similar to those in the image to the right. Tables The rows of information - the records - won't be pulled from the database until you build and run your requests. Columns Page 14
21 Page 15
22 Page 16
23 Viewing Columns Procedure You now have a basic understanding of what a dashboard might be. Now you will see the Columns found in UAccess Analytics. The Columns of data come from the tables found in Analytics. Letʼs see how some of those terms and ideas translate. 1. Once you've selected a Subject Area, the entire screen refreshes itself. In the Selection Pane on the left, instead of seeing the list of available Folders, you're now seeing the contents of the Subject Area you selected. 2. The contents of the Subject Area are divided into columns of information. Click the Academic Program object. Page 17
24 3. The Academic Program table is made up of about 25 columns of information. Take a look at those columns. You will see that there are actually groups of two or three versions of many pieces of information. 4. For example, there are three columns that begin with the words Academic Program. That means there are three different versions of the same type of information available to be put into a request. 5. Typically, the first version of a column is the Code or ID column. The term "code" means you're going to see a three- or four-character piece of information denoting the Academic Program or other piece of information. For example, you might see the codes UPHRM or UFNRT. Those codes represent the College of Pharmacy and the College of Fine Arts, respectively. Page 18

25 6. The second type of column you'll typically see won't have any sort of descriptor. That "blank" column - Academic Program, for example - will typically display a ten-character short description of the selected data. Following our previous example, you would see Pharmacy and Fine Arts listed in that column. Page 19
26 7. The third type of column data you'll typically see is the description variety - Academic Program Desc. The description column typically contains a 30-character long-form description for each record of data. In our example, you would see College of Pharmacy and College of Fine Arts. 8. Other tables contain other columns of information, of course. Click the Campus object. 9. Click the Class object. 10. There are over 100 columns of information here. 11. Click the scrollbar. End of Procedure. Page 20
27 Planning Your Request Procedure You now have a general understanding of how data is put together in UAccess Analytics. Now you can start the process of building a request. You should gather some information and make a few decisions before you start building, however. 1. Before you can begin building your request, you'll have to decide what information you need or want in that request. 2. In this case, you want a report to show us the cumulative grade point averages (GPAs) for students who were enrolled in the College of Architecture during the '94-'95 academic year. Page 21
28 3. Click the CSW - Student Records - Term Enrollment link. 4. Now that you've settled on the Student Records - Term Enrollment Subject Area, take a look at some columns of information to see if you can find what you're interested in. Remember, you're looking for cumulative GPAs for Architecture students back in the '94/'95 school year. Click the Academic Organization object. 5. Is there anything here of interest? Page 22
29 6. Click the Academic Plan object. 7. What about here? Anything you can use? Sometimes, you'll have to interpret the columns of data so that you understand them. What does "Academic Plan" mean? What about "Academic program?" How about "Institution?' Let's look at another group... Click the Academic Program object. 8. The Academic Program group has a number column that existed in the Academic Plan table. What are some of those duplicated columns? When you see situations like this, it doesn't matter which instance of any of those columns you choose for your request. They'll show exactly the same data. 9. Click the Fact Term Enrollment object. Page 23
30 10. When you see groups with words like Fact or Measures in the name of that grouping, Term Enrollment table, you should know that they typically contain numeric columns of information. These columns can be used to perform calculations, if necessary. This particular group has a Cumulative Grade Point Average column. Keep that in mind. 11. Click the Person object. 12. Okay, this group has both Person ID and Person Name columns. You'll need those. Click the Person button. 13. End of Procedure. Page 24
31 Building a Request Procedure You have an idea of the columns you need to use to get our request. Now you can start building the request. Remember, youʼre looking for a report that will show us the GPAs for Architecture students from the ʻ94/ʼ95 school year. 1. Find those columns you noted earlier. Click the Fact Term Enrollment object. 2. Click the Cumulative Grade Point Average object. 3. Click the Academic Program object. Page 25
32 4. Click the Academic Program Desc object. 5. Click the Person object. 6. Click the Person Id object. 7. Click the Person Name object. 8. Click the Term object. 9. Click the Academic Year object. 10. It seems you have some of the right columns of information. Now you can see what you've built so far. Click the Display Results button. Page 26

33 11. Note that you are now on the Results tab, on a screen called Compound Layout. This might also be called the "Home" screen. The large round button to the left of the words Compound Layout might be called the "I'm lost and I want to go Home." button. If you get stuck or lost somewhere in Analytics Answers and don't know where to go, you can always click the Home button to return to the Compound Layout screen. Page 27
34 12. There are two boxes of information on the default Compound Layout screen. Those two boxes - called views - are the Title View and the Table View. At the bottom of the Table View, you see that you are looking at the first 25 records of this request, which is the default for every request. You can use the page control buttons to move to the next page of 25 records, or you might open all pages. There may be hundreds or thousands of records in this request, however. There is no easy way to tell how many records there might be, and clicking the All Pages button without having some idea of the number of records may not be the wisest thing to do. 13. The GPA column needs some work to make the information look more like Grade Point Averages, but it seems to be the right column. The second column shows us the College of Architecture. That's good. The two Person columns are showing us what you want to see. The Academic Year column is showing all years. There might also be a better order to put the columns into. 14. Click the Criteria tab. Page 28
35 15. You can re-order the columns to have the results make more sense. Let's move the two Person columns in front of the GPA column. Press the left mouse button and drag the mouse to the desired location. 16. When you see the dark blue vertical bar in the spot where you want to drop the columns, release your mouse button. Release the mouse button. 17. Let's add another column to the request, so that you can put the students in class order - Freshmen, Sophomores, et cetera. Click the Academic Level Start Term object. 18. Click the Start Term Academic Level object. 19. When you add a new column from a new table, that column goes to the far right. Let's move this so it's the first column on the left. Press the left mouse button and drag the mouse to the desired location. Page 29
36 20. Release the mouse button. 21. Click the Display Results button. 22. End of Procedure. Page 30
37 Quick Review - Building a Request 1. From the Dashboard, you must click on the link to begin building a request. 2. Once you're in Analytics Answers and before you can begin building your request, you must select a. 3. Columns are organized into. 4. After selecting all of the columns you need, which button do you click to display the results?. 5. What is the name of the screen you're on when you're looking at the results?. 6. How many records do you see by default when you view the results of any request?. Page 31
38 Page 32


39 What is a Filter? A filter is a tool that narrows the rows of information returned in your request to just the ones you want to see. Both the filter and the columns you select determine what the results will contain. For example, you can use filters to find out who the top ten performers are, the most popular (or most in-demand) classes, the most over-worked faculty members, and so on. Filter A tool that limits the rows of data in the column to just the ones you want to see You can create filters for a particular request, or save them to your personal filter folder or to a shared filter folder if you want to be able to use the same filter in another request in the future. A filter consists of the following elements: A column to filter, such as Grade Point Averages. A value to use when applying the filter, such as An operator that determines how the value is applied to the column, such as Greater Than or Equal To. In this example, since the column contains the grade point averages for each student in the database, the operator is set at Greater Than or Equal To, and the value is 2.50, the results will include only those students whose GPAs are greater than or equal to Filters can have more than one part. Continuing the example above, the user might choose to add other pieces to the filter to further limit the results to only those students who attended English 101 with a particular professor, and who were in a particular degree program. Based on the image here, what result set is the report builder apparently looking for? Page 33
40 Page 34

41 Adding a Filter Procedure You've added some columns to our request, and now you should limit the results to get just the information you need. 1. When you were starting to build this request, you took a few moments to figure out the columns were needed. You need to do something similar with filtering. 2. Remember, you want Architecture Students from the '94-'95 school year. Click the Criteria tab. Page 35

42 3. Since Academic Program Desc seems to contain the college names, you should use that as part of our filter. Click the Add Filter button. 4. When you're building a filter - especially when you're not very familiar with the data - you can click the All Choices link to determine two things: how many choices do you have and what type of data are you dealing with. Click the All Choices link. 5. This is text data, and there are three pages of choices. Fortunately, the choice you need is right here on the first page. Click the College Arch & Landscape Arch list item. 6. Click the OK button. Page 36
43 7. Now that you've used the Academic Program Desc column to build our filter, what information will that column have in it when you see it on our request? Click the Remove Column button. 8. You can move on to the Academic Year column, and narrow our data to the '94-'95 school year. Click the Add Filter button. 9. Once again, let's see what you're dealing with here. Click the All Choices link. 10. Okay, these are just numbers. Rather than having to select the value, you can just type it into the Value field. In this case, the '94-'95 school year is the 1995 Academic Year. Click in the Value field. 11. You can type the desired information into the Value field. Type "1995". 12. This part of the filter is done. Click the OK button. 13. Just as you did earlier with the other column, you can get rid of the Academic Year column. Click the Remove Column button. 14. Our filter is done, so let's look at the results one more time. Click the Display Results button. 15. End of Procedure. Page 37
44 Page 38

45 Basic Formatting Procedure You've filtered the results to see just what you need. Now you can do just a bit of formatting. 1. Click the Criteria tab. 2. The default sorting order for any report runs from left to right. Let's order the request, starting with the first column. Click the Order By button. Page 39
46 3. Now this request is sorted ascending by Academic Level. You can sort by more than one column. Let's skip down to the GPA column. Click the Order By button. 4. Clicking the button again sorts that column in reverse, or descending, order from highest to lowest. Click the Order Ascending button. 5. Click the Display Results button. 6. The information is in the desired order, but you still have to format the GPA column. Those numbers don't look like GPAs yet. Click the Criteria tab. Page 40

47 7. Click the Column Properties button. 8. Click the Data Format tab. 9. Notice that your numbers don't have any decimal places. You can add a couple in order to make those numbers look like GPAs. Click the Override Default Data Format option. 10. Click the Decimal Places drop-down list. 11. Click the 2 list item. 12. Click the OK button. 13. Click the Display Results button. Page 41

48 14. That's much better. The request has been sorted by Start Term first, then GPA, and those numbers now look like real Grade Point Averages. 15. End of Procedure. Page 42
49 Saving your Request Procedure Youʼve done quite a bit of work. You need to save this request before you lose it! 1. What is the name of this request? 2. Click the Save Request button. Page 43

50 3. Sometimes it's useful to have your requests divided up into folders. Click the Create Folder link. 4. You can type the desired information into the Caption field. Type "Fundamentals". 5. Click the OK button. 6. You can type the desired information into the Name field. Type "Student Grade Point Averages". 7. You can also enter Description information if you'd like. Click the OK button. 8. End of Procedure. Page 44
51 Quick Review - Adding a Filter and Basic Formatting 1. A filter consists of three basic parts: a column, a value, and that will determine how the value is applied to the column of data. 2. Which tab must you be on in order to build your filters? 3. Which button do you click on to begin building the filter, once you've determined the basis for your filter? 4. What is the default sorting order for data in any request? Page 45
52 Page 46
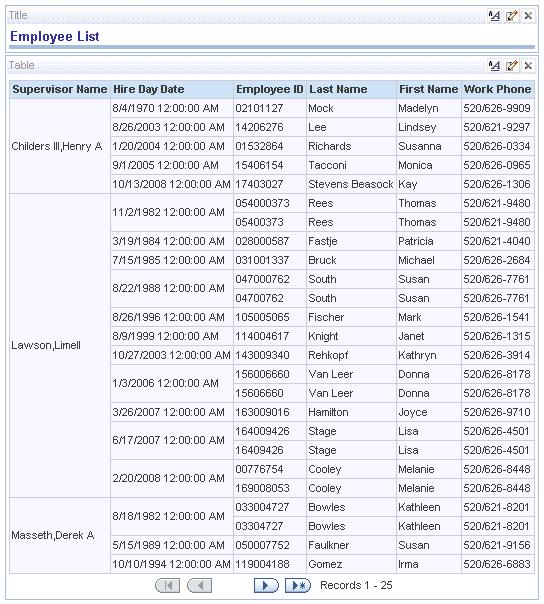
53 Exercise - Employee List Scenario: Your boss has asked you to create a request that will show specific personnel information for people in your department. Your boss would like to see names, phone numbers, and the date each employee started working for the University of Arizona. (An image of the finished request is on the next page.) -by-step: Select the Employee Profile Subject Area Include the following columns: Positions > Positions > Supervisor Name Dates > Hire Date > Hire Day Date Employees > Contact Information > Employee ID Employees > Contact Information > Last Name Employees > Contact Information > First Name Employees > Contact Information > Work Phone Add a filter to show only those employees who work for Limellʼ Lawson, Hank Childers, Derek Masseth, or Michele Norin What tab (top of the screen) do you need to be on to begin building your filter? What column of data will you use to build your filter? Sort the request by Supervisor Name (ascending) Last Name (ascending) Save the Request in your Fundamentals folder as Employee List Page 47
54 Page 48
55 Analytics Dashboards Adding Requests to a Dashboard Procedure Now that you've built your requests, you should put them on your personal dashboard page so you can readily access them. Remember, a dashboard is a collection of the requests presented on web pages for quick and easy viewing. Benefits of using dashboards include: Dashboards are always accessible Data is automatically updated, usually overnight You can "drill-down" on many reports, accessing more detailed information with each click 1. Click the Dashboards link. Page 49

56 2. Click the here link. 3. This is the Dashboard Editor. The short sentence at the top of the screen tells you what to do. Page 50

57 4. Where are your requests? Click the Fundamentals object. 5. Let's add the Student GPA request first. You have to drag-and-drop in this screen. Press the left mouse button and drag the mouse to the desired location. 6. Now drag-and-drop the Employee List request into the dashboard. Drop it just below the GPA request. Press the left mouse button and drag the mouse to the desired location. 7. When the dark blue line is inside of the section and below the Student GPA request, you can drop the second request. Release the mouse button. 8. Click the Save button. Page 51

58 9. Both requests are on the page, but they are one above the other, and the page is a bit long. There is room to put the requests side-by-side. Click the Page Options button. 10. Click the Edit Dashboard... link. 11. Note that there are three sets of buttons on the dashboard. Locate the Properties button for the Section. Click the Properties button. Page 52

59 12. Click the Arrange Horizontally link. 13. Click the Save button. Page 53

60 14. Now your two requests are on your personal dashboard. If this were the real system, next time you logged in to UAccess Analytics these two requests would be here for you. 15. If you had posted student grades or hired and fired employees, the requests would be automatically updated for you overnight. End of Procedure. Page 54
61 Page 55
Basic Reports & Dashboards
 Basic Reports & Dashboards Arizona Board of Regents, 2012 updated 06.01.2012 v.1.10 For information and permission to use our PDF manuals, please contact uitsworkshopteam@list.arizona.edu PDFs available
UAccess ANALYTICS Next Steps: Creating Report Selectors
 UAccess ANALYTICS Arizona Board of Regents, 2015 THE UNIVERSITY OF ARIZONA created 08.10.2015 v.1.00 For information and permission to use our PDF manuals, please contact uitsworkshopteam@list.arizona.edu
UAccess ANALYTICS Next Steps: Working with Bins, Groups, and Calculated Items: Combining Data Your Way
 UAccess ANALYTICS Next Steps: Working with Bins, Groups, and Calculated Items: Arizona Board of Regents, 2014 THE UNIVERSITY OF ARIZONA created 02.07.2014 v.1.00 For information and permission to use our
UAccess ANALYTICS Working with Agents: Delivering Data to Your Desktop
 UAccess ANALYTICS : Delivering Data to Your Desktop Arizona Board of Regents, 2015 THE UNIVERSITY OF ARIZONA updated 08.20.2015 v.3.00 For information and permission to use our PDF manuals, please contact
UACCESS ANALYTICS. Intermediate Reports & Dashboards. Arizona Board of Regents, 2015 THE UNIVERSITY OF ARIZONA. updated v.1.
 UACCESS ANALYTICS Arizona Board of Regents, 2015 THE UNIVERSITY OF ARIZONA For information and permission to use our PDF manuals, please send an email to: uitsworkshopteam@list.arizona.edu updated 06.01.2015
UAccess ANALYTICS. Intermediate Reports & Dashboards. updated v3.00
 UAccess ANALYTICS Intermediate Reports & Dashboards Arizona Board of Regents, 2017 THE UNIVERSITY OF ARIZONA For information and permission to use our PDF manuals, please send an email to: uitsworkshopteam@list.arizona.edu
UAccess ANALYTICS Oracle Business Intelligence Mobile for the Apple ipad or iphone
 UAccess ANALYTICS Oracle Business Intelligence Mobile for the Apple ipad or iphone Arizona Board of Regents, 2012 THE UNIVERSITY OF ARIZONA updated 07.06.2012 v.1.00 For information and permission to use
Academic Advising Basics
 Arizona Board of Regents, 2011 updated 07.11.2010 v.3.0 For information and permission to use our PDF manuals, please contact uitsworkshopteam@listserv.com PDFs available at www.uits.arizona.edu/workshops
eschoolplus+ Cognos Query Studio Training Guide Version 2.4
 + Training Guide Version 2.4 May 2015 Arkansas Public School Computer Network This page was intentionally left blank Page 2 of 68 Table of Contents... 5 Accessing... 5 Working in Query Studio... 8 Query
Lesson 1: Creating and formatting an Answers analysis
 Lesson 1: Creating and formatting an Answers analysis Answers is the ad-hoc query environment in the OBIEE suite. It is in Answers that you create and format analyses to help analyze business results.
EDITING AN EXISTING REPORT
 Report Writing in NMU Cognos Administrative Reporting 1 This guide assumes that you have had basic report writing training for Cognos. It is simple guide for the new upgrade. Basic usage of report running
Getting Started in CAMS Enterprise
 CAMS Enterprise Getting Started in CAMS Enterprise Unit4 Education Solutions, Inc. Published: 18 May 2016 Abstract This document is designed with the new user in mind. It details basic features and functions
Records and Enrollment Participants Guide
 IBM Cognos Analytics Welcome to Cognos Records and Enrollment Training! Today s objectives include: Gain a Basic Understanding of Cognos Understand University policies on data security including FERPA
Barchard Introduction to SPSS Marks
 Barchard Introduction to SPSS 21.0 3 Marks Purpose The purpose of this assignment is to introduce you to SPSS, the most commonly used statistical package in the social sciences. You will create a new data
Query Studio Training Guide Cognos 8 February 2010 DRAFT. Arkansas Public School Computer Network 101 East Capitol, Suite 101 Little Rock, AR 72201
 Query Studio Training Guide Cognos 8 February 2010 DRAFT Arkansas Public School Computer Network 101 East Capitol, Suite 101 Little Rock, AR 72201 2 Table of Contents Accessing Cognos Query Studio... 5
UAccess STUDENT. Financial Aid Training Manual FA Fundamentals
 UAccess STUDENT Financial Aid Training Manual FA Fundamentals Table of Contents UAccess Student... 1 Financial Aid... 1 Financial Aid- Fundamentals... 1 Training Registration... 1 Navigating Through
Tracking changes in Word 2007 Table of Contents
 Tracking changes in Word 2007 Table of Contents TRACK CHANGES: OVERVIEW... 2 UNDERSTANDING THE TRACK CHANGES FEATURE... 2 HOW DID THOSE TRACKED CHANGES AND COMMENTS GET THERE?... 2 WHY MICROSOFT OFFICE
Barchard Introduction to SPSS Marks
 Barchard Introduction to SPSS 22.0 3 Marks Purpose The purpose of this assignment is to introduce you to SPSS, the most commonly used statistical package in the social sciences. You will create a new data
Create your first workbook
 Create your first workbook You've been asked to enter data in Excel, but you've never worked with Excel. Where do you begin? Or perhaps you have worked in Excel a time or two, but you still wonder how
Introduction Google Forms is used to plan events, provide quizzes, survey, or collect needed information quickly.
 Table of Contents Introduction Creating a Form from Drive Question Types Editing the Form Form Layout Reorder Questions Confirmation Page Sharing your Form Add Collaborators Choose a Form Response Destination
PowerPoint Slide Basics. Introduction
 PowerPoint 2016 Slide Basics Introduction Every PowerPoint presentation is composed of a series of slides. To begin creating a slide show, you'll need to know the basics of working with slides. You'll
PowerPoint Instructions
 PowerPoint Instructions Exercise 1: Type and Format Text and Fix a List 1. Open the PowerPoint Practice file. To add a company name to slide 1, click the slide 1 thumbnail if it's not selected. On the
Microsoft Office Word 2010
 Microsoft Office Word 2010 Content Microsoft Office... 0 A. Word Basics... 4 1.Getting Started with Word... 4 Introduction... 4 Getting to know Word 2010... 4 The Ribbon... 4 Backstage view... 7 The Quick
USING DRUPAL. Hampshire College Website Editors Guide https://drupal.hampshire.edu
 USING DRUPAL Hampshire College Website Editors Guide 2014 https://drupal.hampshire.edu Asha Kinney Hampshire College Information Technology - 2014 HOW TO GET HELP Your best bet is ALWAYS going to be to
THE EXCEL ENVIRONMENT... 1 EDITING...
 Excel Essentials TABLE OF CONTENTS THE EXCEL ENVIRONMENT... 1 EDITING... 1 INSERTING A COLUMN... 1 DELETING A COLUMN... 1 INSERTING A ROW... DELETING A ROW... MOUSE POINTER SHAPES... USING AUTO-FILL...
Finding Your Way Around Aspen IMS
 Finding Your Way Around Aspen IMS 12181A 60 minutes - - - - - - - - - - - - - - - - - - - - - - - - - - - - - - - - - - - - - - - - - - - - - - - - - Description Knowing your way around Aspen IMS makes
Grade Point Scales Standard Honors AP/College A B C D F Sample file
 64 Transcripts Weighted Cumulative GPA When your student works extra hard and takes honors or college courses, they deserve a little credit. The best way to reflect this is through their GPA. They deserve
Business Process Guide
 Business Process Guide for Class and Course Permission Overrides 1 TABLE OF CONTENTS Topic Page Purpose...3 Navigation...3 Prerequisites...4 Prerequisites and Assumptions...4 Helpful Hints...4 Terminology...5
Getting Started Guide
 Getting Started Guide for education accounts Setup Manual Edition 7 Last updated: September 15th, 2016 Note: Click on File and select Make a copy to save this to your Google Drive, or select Print, to
2015 Arkansas Department of Education Data & Reporting Conference. Cognos Query Studio
 2015 Arkansas Department of Education Data & Reporting Conference Cognos Query Studio SMS Workshop August 7, 2015 Arkansas Public School Computer Network CREATING REPORTS USED TO GENERATE DATA FILES 1.
MESA Database User Guide
 MESA Database User Guide Table of Contents Introduction... 5 Login Screen... 5 Dashboard... 6 My Profile... 7 School Management... 8 Search for a School... 8 Add a School to Your Center... 8 Remove a School
Designing a Database -- Understanding Relational Design
 Designing a Database -- Understanding Relational Design Contents Overview The Database Design Process Steps in Designing a Database Common Design Problems Determining the Purpose Determining the Tables
Formulas, LookUp Tables and PivotTables Prepared for Aero Controlex
 Basic Topics: Formulas, LookUp Tables and PivotTables Prepared for Aero Controlex Review ribbon terminology such as tabs, groups and commands Navigate a worksheet, workbook, and multiple workbooks Prepare
In our first lecture on sets and set theory, we introduced a bunch of new symbols and terminology.
 Guide to and Hi everybody! In our first lecture on sets and set theory, we introduced a bunch of new symbols and terminology. This guide focuses on two of those symbols: and. These symbols represent concepts
CheckBook Pro 2 Help
 Get started with CheckBook Pro 9 Introduction 9 Create your Accounts document 10 Name your first Account 11 Your Starting Balance 12 Currency 13 We're not done yet! 14 AutoCompletion 15 Descriptions 16
ICDL & OOo BASE. Module Five. Databases
 ICDL & OOo BASE Module Five Databases BASE Module Goals taken from the Module 5 ICDL Syllabus Module 5 Database requires the candidate to understand some of the main concepts of databases and demonstrates
Creating Reports using Report Designer Part 1. Training Guide
 Creating Reports using Report Designer Part 1 Training Guide 2 Dayforce HCM Creating Reports using Report Designer Part 1 Contributors We would like to thank the following individual who contributed to
Instructions for Using iserve
 Instructions for Using iserve Getting Started Getting started in iserve is quick and easy! Follow these simple steps. 1. Go to http://iserve.wvu.edu/ 2. Click the Login button at the top of the page: 3.
BEGINNER PHP Table of Contents
 Table of Contents 4 5 6 7 8 9 0 Introduction Getting Setup Your first PHP webpage Working with text Talking to the user Comparison & If statements If & Else Cleaning up the game Remembering values Finishing
Using Windows 7 Explorer By Len Nasman, Bristol Village Computer Club
 By Len Nasman, Bristol Village Computer Club Understanding Windows 7 Explorer is key to taking control of your computer. If you have ever created a file and later had a hard time finding it, or if you
Section 1 Creating Mail Merge Files
 Course Topics: I. Creating Mail Merge Files II. Creating Mailing Labels III. Printing Selective Records IV. Using Mail Merge Toolbar V. Envelopes and labels on the fly Section 1 Creating Mail Merge Files
their in the new a program such as Excel or Links aren't just document.
 Navigating with Hyperlinks Hyperlinks are those bits of underlinedd text or pictures that, when you click them, take you to a new place, like another Web page. Most people never think of adding links to
MOODLE MANUAL TABLE OF CONTENTS
 1 MOODLE MANUAL TABLE OF CONTENTS Introduction to Moodle...1 Logging In... 2 Moodle Icons...6 Course Layout and Blocks...8 Changing Your Profile...10 Create new Course...12 Editing Your Course...15 Adding
PowerSchool Student and Parent Portal User Guide. https://powerschool.gpcsd.ca/public
 PowerSchool Student and Parent Portal User Guide https://powerschool.gpcsd.ca/public Released June 2017 Document Owner: Documentation Services This edition applies to Release 11.x of the PowerSchool software
Data Warehouse Training Project. Training Handbook. June 22, Office of Institutional Analysis, Assessment, and Reporting
 Data Warehouse Training Project Training Handbook June 22, 2010 Office of Institutional Analysis, Assessment, and Reporting Trainer: Marcia Belcheir, Ph.D. Data Warehouse Administrator: Steve Grantham,
The Crypt Keeper Cemetery Software Online Version Tutorials To print this information, right-click on the contents and choose the 'Print' option.
 The Crypt Keeper Cemetery Software Online Version Tutorials To print this information, right-click on the contents and choose the 'Print' option. Home Greetings! This tutorial series is to get you familiar
Smart Planner/Degree Search
 Smart Planner/Degree Search Module: Degree Tracker Business Process Name: Degree Tracker Testing Created/Edited By: Kathy Godwin/Heather Jepsen Creation Date: December 12 th, 2011 Copyright 2016 The Arizona
MITOCW watch?v=0jljzrnhwoi
 MITOCW watch?v=0jljzrnhwoi The following content is provided under a Creative Commons license. Your support will help MIT OpenCourseWare continue to offer high quality educational resources for free. To
Standards User Guide. PowerSchool 6.0 Student Information System
 PowerSchool 6.0 Student Information System Released June 2009 Document Owner: Document Services This edition applies to Release 6.0 of the PowerSchool Premier software and to all subsequent releases and
Creating Reports in Access 2007 Table of Contents GUIDE TO DESIGNING REPORTS... 3 DECIDE HOW TO LAY OUT YOUR REPORT... 3 MAKE A SKETCH OF YOUR
 Creating Reports in Access 2007 Table of Contents GUIDE TO DESIGNING REPORTS... 3 DECIDE HOW TO LAY OUT YOUR REPORT... 3 MAKE A SKETCH OF YOUR REPORT... 3 DECIDE WHICH DATA TO PUT IN EACH REPORT SECTION...
Excel 1. Module 6 Data Lists
 Excel 1 Module 6 Data Lists Revised 4/17/17 People s Resource Center Module Overview Excel 1 Module 6 In this module we will be looking at how to describe a database and view desired information contained
Google Docs Website (Sign in or create an account):
:") What is Google Docs? Google Docs is a free online word processor, spreadsheet, and presentation editor that allows you to create, store, share, and collaborate on documents with others. Create and share
What is Google Docs? Google Docs is a free online word processor, spreadsheet, and presentation editor that allows you to create, store, share, and collaborate on documents with others. Create and share
Google Classroom Help Sheet
 1 Google Classroom Help Sheet Table of Contents Introduction Signing into Google Classroom Creating a Class Changing a Class Theme Adding a Teacher Photo to the Class Renaming or Deleting a Class Adding
Instructor: Craig Duckett. Lecture 04: Thursday, April 5, Relationships
 Instructor: Craig Duckett Lecture 04: Thursday, April 5, 2018 Relationships 1 Assignment 1 is due NEXT LECTURE 5, Tuesday, April 10 th in StudentTracker by MIDNIGHT MID-TERM EXAM is LECTURE 10, Tuesday,
View the Advisor Case Load Self Service Report
 IBM Cognos Analytics View the Advisor Case Load Self Service Report The Advisor Case Load Self Service report will give you information about the students in your case load. The following is a guide on
Mastering the Environment WVU ecampus
 Mastering the Environment WVU ecampus Information Technology Services, West Virginia University Service Desk (304) 293-4444, ITShelp@mail.wvu.edu Mastering the Environment of WVU ecampus 1 Table of Contents
PowerPoint Introduction. Video: Slide Basics. Understanding slides and slide layouts. Slide Basics
 PowerPoint 2013 Slide Basics Introduction PowerPoint presentations are made up of a series of slides. Slides contain the information you will present to your audience. This might include text, pictures,
M i c r o s o f t E x c e l A d v a n c e d P a r t 3-4. Microsoft Excel Advanced 3-4
 Microsoft Excel 2010 Advanced 3-4 0 Absolute references There may be times when you do not want a cell reference to change when copying or filling cells. You can use an absolute reference to keep a row
Learning Worksheet Fundamentals
 1.1 LESSON 1 Learning Worksheet Fundamentals After completing this lesson, you will be able to: Create a workbook. Create a workbook from a template. Understand Microsoft Excel window elements. Select
Introduction to Cognos Participants Guide. Table of Contents: Guided Instruction Overview of Welcome Screen 2
 IBM Cognos Analytics Welcome to Introduction to Cognos! Today s objectives include: Gain a Basic Understanding of Cognos View a Report Modify a Report View a Dashboard Request Access to Cognos Table of
In the first class, you'll learn how to create a simple single-view app, following a 3-step process:
 Class 1 In the first class, you'll learn how to create a simple single-view app, following a 3-step process: 1. Design the app's user interface (UI) in Xcode's storyboard. 2. Open the assistant editor,
Microsoft Outlook Basics
 Microsoft Outlook 2010 Basics 2 Microsoft Outlook 2010 Microsoft Outlook 2010 3 Table of Contents Getting Started with Microsoft Outlook 2010... 7 Starting Microsoft Outlook... 7 Outlook 2010 Interface...
CaseComplete Roadmap
 CaseComplete Roadmap Copyright 2004-2014 Serlio Software Development Corporation Contents Get started... 1 Create a project... 1 Set the vision and scope... 1 Brainstorm for primary actors and their goals...
New Finance Officer & Staff Training
 New Finance Officer & Staff Training Overview MUNIS includes many programs and tools to allow for the management of the District financials. As newer finance officers and staff, you are charged with understanding,
TECHNOLOGY COMPETENCY ASSESSMENT MODULE Microsoft Access
 TECHNOLOGY COMPETENCY ASSESSMENT MODULE Microsoft Access This module was developed to assist students in passing the SkillCheck Incorporated Access 2003 Technology Competency Assessment. It was last updated
PeopleSoft Departmental Student Records Training. Bloomsburg University
 PeopleSoft Departmental Student Records Training Bloomsburg University 1 Table of Contents Bloomsburg University Training Notes... 3 Terminology Crosswalk... 3 Term Code Logic... 3 Viewing a Student s
Chronodat Help Desk (Lite)
") Chronodat Help Desk (Lite) (User Manual) By CHRONODAT, LLC For further information, visit us at www.chronodat.com For support, contact us at support@chronodat.com Version 2.0.0.0 Created: 10-03-2018 1
Chronodat Help Desk (Lite) (User Manual) By CHRONODAT, LLC For further information, visit us at www.chronodat.com For support, contact us at support@chronodat.com Version 2.0.0.0 Created: 10-03-2018 1
Getting Started. Reliance Communications, Inc. 603 Mission Street Santa Cruz, CA
 Getting Started Reliance Communications, Inc. 603 Mission Street Santa Cruz, CA 95060 888-527-5225 www.schoolmessenger.com Index Before you Begin...3 Getting Started...3 Log In...3 The Start Page...3 Help...4
Chronodat Help Desk. (User Manual) By CHRONODAT, LLC
 By CHRONODAT, LLC") Chronodat Help Desk (User Manual) By CHRONODAT, LLC For further information, visit us at www.chronodat.com For support, contact us at support@chronodat.com Version 2.0.0.0 Created: 09-24-2018 1 P a g e
Chronodat Help Desk (User Manual) By CHRONODAT, LLC For further information, visit us at www.chronodat.com For support, contact us at support@chronodat.com Version 2.0.0.0 Created: 09-24-2018 1 P a g e
MICROSOFT WORD 2010 BASICS
 MICROSOFT WORD 2010 BASICS Word 2010 is a word processing program that allows you to create various types of documents such as letters, papers, flyers, and faxes. The Ribbon contains all of the commands
Excel 2013 Workshop. Prepared by
 Excel 2013 Workshop Prepared by Joan Weeks Computer Labs Manager & Madeline Davis Computer Labs Assistant Department of Library and Information Science June 2014 Excel 2013: Fundamentals Course Description
Using Microsoft Word. Text Editing
 Using Microsoft Word A word processor is all about working with large amounts of text, so learning the basics of text editing is essential to being able to make the most of the program. The first thing
Earthwork 3D for Dummies Doing a digitized dirt takeoff calculation the swift and easy way
 Introduction Earthwork 3D for Dummies Doing a digitized dirt takeoff calculation the swift and easy way Getting to know you Earthwork has inherited its layout from its ancestors, Sitework 98 and Edge.
Notice on Access to Advanced Lists...2 Database Overview...2 Example: Real-life concept of a database... 2
 Table of Contents Notice on Access to Advanced Lists...2 Database Overview...2 Example: Real-life concept of a database... 2 Queries...2 Example: Real-life concept of a query... 2 Database terminology...3
Introduction. Watch the video below to learn more about getting started with PowerPoint. Getting to know PowerPoint
 PowerPoint 2016 Getting Started With PowerPoint Introduction PowerPoint is a presentation program that allows you to create dynamic slide presentations. These presentations can include animation, narration,
The Paperless Classroom with Google Docs by - Eric Curts
 The Paperless Classroom with Google Docs by - Eric Curts Table of Contents Overview How to name documents and folders How to choose sharing options: Edit, Comment, and View How to share a document with
Achieving Contentment with the AutoCAD Architecture Content Browser Douglas Bowers, AIA
 Achieving Contentment with the AutoCAD Architecture Content Browser Douglas Bowers, AIA AB110-3 If you have created AutoCAD Architecture (formerly ADT) object styles and want to know how to easily share
MICROSOFT SHAREPOINT SITE OWNER S MANUAL. Creating a Useful, Engaging Site for your Team to Love
 MICROSOFT SHAREPOINT SITE OWNER S MANUAL Creating a Useful, Engaging Site for your Team to Love CONTENTS UNDERSTAND SHAREPOINT UNDERSTAND PERMISSIONS CURRENT PERMISSION LEVELS 5 PERMISSION LEVEL DEFINITIONS
Buzz Student Guide BUZZ STUDENT GUIDE
 BUZZ STUDENT GUIDE 1 Buzz Student Guide The purpose of this guide is to enhance your understanding of the student navigation and functionality of Buzz, the Learning Management System used by Lincoln Learning
Electronic Portfolios in the Classroom
 Electronic Portfolios in the Classroom What are portfolios? Electronic Portfolios are a creative means of organizing, summarizing, and sharing artifacts, information, and ideas about teaching and/or learning,
SECTION 4 USING QUERIES. What will I learn in this section?
 SECTION 4 USING QUERIES What will I learn in this section? Select Queries Creating a Query Adding a Table to Query Adding Fields to Query Single Criteria Hiding column in a Query Adding Multiple Tables
Introduction. Using Styles. Word 2010 Styles and Themes. To Select a Style: Page 1
 Word 2010 Styles and Themes Introduction Page 1 Styles and themes are powerful tools in Word that can help you easily create professional looking documents. A style is a predefined combination of font
Training Guide. UAccess STUDENT. Financial Aid Campus Community. Go Live
 UAccess STUDENT Financial Aid Campus Community Go Live 1.25.10 Table of Contents Financial Aid-Campus Community...1 Training Registration...1 Viewing Service Indicators for Students...6 Viewing Checklists
Welcome to Google Docs:
 Welcome to Google Docs: Online free word processor, spreadsheet, and presentation tool that allows collaboration... (alternatives to Microsoft Word, Excel and PowerPoint) Allows users to create basic documents
TIES Student Information System. Attendance, Report Card Grading, Tests and Assessments
 TIES Student Information System i-cue Attendance, Report Card Grading, Tests and Assessments Copyright 2007 TIES All rights reserved No part of this document may be reproduced in any form without written
Handout Objectives: a. b. c. d. 3. a. b. c. d. e a. b. 6. a. b. c. d. Overview:
 Computer Basics I Handout Objectives: 1. Control program windows and menus. 2. Graphical user interface (GUI) a. Desktop b. Manage Windows c. Recycle Bin d. Creating a New Folder 3. Control Panel. a. Appearance
 Information Technology Virtual EMS Help https://msum.bookitadmin.minnstate.edu/ For More Information Please contact Information Technology Services at support@mnstate.edu or 218.477.2603 if you have questions
UTHealth Medical School Internal User Guide
 UTHealth Medical School Internal User Guide Welcome to UTHealth Medical School Internal User Guide for the Ad Astra Event Scheduling application! The MS Internal User Guide has been created to introduce
Student Records Training Level IIA
 ` Student Records Training Level IIA Assigning Overloads... 2 Assigning Student Specific Permissions... 4 Assigning Class Permission Numbers... 6 Changing Classes to Pass/Fail... 8 Adding a Class... 12
Microsoft Access 2016 Intro to Forms and Reports
 Microsoft Access 2016 Intro to Forms and Reports training@health.ufl.edu Access 2016: Intro to Forms and Reports 2.0 hours Topics include using the AutoForm/AutoReport tool, and the Form and Report Wizards.
Staff User Guide PowerSchool Student Information System
 PowerSchool Student Information System Document Properties Copyright Owner 2005 Apple Computer, Inc. All rights reserved. This document is the property of Apple Computer, Inc. and is for reference only.
McGovern Medical School Internal User Guide
 McGovern Medical School Internal User Guide Welcome to McGovern Medical School s Internal User Guide for the Ad Astra Event Scheduling application! The MMS Internal User Guide has been created to introduce
sforce Web Services Enterprise API sforce Object Query Language sforce Custom Objects... 40
 Release Notes Winter 04 Major Announcements Dashboards... 2 Workflow Automation... 8 Advanced Page Layout Wizard... 12 Dynamic Page Layouts and Field-Level Security... 14 Team-Based Account Management...
POFT 2301 INTERMEDIATE KEYBOARDING LECTURE NOTES
 INTERMEDIATE KEYBOARDING LECTURE NOTES Be sure that you are reading the textbook information and the notes on the screen as you complete each part of the lessons in this Gregg Keyboarding Program (GDP).
Copyright 2009 Labyrinth Learning Not for Sale or Classroom Use LESSON 1. Designing a Relational Database
 LESSON 1 By now, you should have a good understanding of the basic features of a database. As you move forward in your study of Access, it is important to get a better idea of what makes Access a relational
Excel Basics Rice Digital Media Commons Guide Written for Microsoft Excel 2010 Windows Edition by Eric Miller
 Excel Basics Rice Digital Media Commons Guide Written for Microsoft Excel 2010 Windows Edition by Eric Miller Table of Contents Introduction!... 1 Part 1: Entering Data!... 2 1.a: Typing!... 2 1.b: Editing
PowerSchool Parent Portal User Guide. PowerSchool 7.x Student Information System
 PowerSchool 7.x Student Information System Released December 2012 Document Owner: Documentation Services This edition applies to Release 7.6 of the PowerSchool software and to all subsequent releases and
Arduino IDE Friday, 26 October 2018
 Arduino IDE Friday, 26 October 2018 12:38 PM Looking Under The Hood Of The Arduino IDE FIND THE ARDUINO IDE DOWNLOAD First, jump on the internet with your favorite browser, and navigate to www.arduino.cc.
AdminPlus Contact DB User Guide LEARN OUR SOFTWARE STEP BY STEP
 AdminPlus Contact DB User Guide LEARN OUR SOFTWARE STEP BY STEP Copyright 2016 Rediker Software. All rights reserved. Information in this document is subject to change without notice. The software described
FanBuzz Business-Enterprise-Create A New fan Page
 This Tutorial video can be found here http://instamagicplugins.com/aio-tutorial-videos/create-a-new-fan-page/ Hi, this is Nick LaPolla with Red Zebra Media and InstaMagic Plugins. Welcome to the the All-inOne