Last Time: Data and Image Models
|
|
|
- Arthur York
- 5 years ago
- Views:
Transcription


 Operations: =,, <, >, - Can measure distances or spans Q - Ratio (zero fixed) Operations: =,,")
1 CS448B :: 2 Oct 2012 Visualization Design Last Time: Data and Image Models Jeffrey Heer Stanford University The Big Picture Nominal, Ordinal and Quantitative task questions & hypotheses intended audience data physical type int, float, etc. abstract type nominal, ordinal, etc. domain metadata semantics conceptual model processing algorithms mapping visual encoding visual metaphor image visual channel perception N - Nominal (labels) Operations: =, O - Ordered (rank-ordered, sorted) Operations: =,, <, > Q - Interval (location of zero arbitrary) Operations: =,, <, >, - Can measure distances or spans Q - Ratio (zero fixed) Operations: =,, <, >, -, ¹ Can measure ratios or proportions S. S. Stevens, On the theory of scales of measurements,
 in the language express all the facts in the set of data, and only the facts in the data.")
2 Visual Encoding Variables Position Size Value Texture Color Orientation Shape Others? Design Criteria (Mackinlay) Expressiveness A set of facts is expressible in a visual language if the sentences (i.e. the visualizations) in the language express all the facts in the set of data, and only the facts in the data. Effectiveness A visualization is more effective than another visualization if the information conveyed by one visualization is more readily perceived than the information in the other visualization. Mackinlay s Ranking Assignment 1 Review Conjectured effectiveness of the encoding 2
3 Design Considerations Title, labels, legend, captions, source! Expressiveness and Effectiveness Avoid unexpressive marks (lines? bars? gradients?) Use perceptually effective encodings Don t distract: faint gridlines, pastel highlights/fills The elimination diet approach start minimal Support comparison and pattern perception Between elements, to a reference line, or to totals Design Considerations Group / sort data by meaningful dimensions Transform data (e.g., invert, log, normalize) Are model choices (regression lines) appropriate? Reduce cognitive overhead Minimize visual search, minimize ambiguity -> Avoid legend lookups if direct labeling works -> Avoid color mappings with indiscernible colors Be consistent! Visual inferences should consistently support data inferences In-Class Review Rubric Expressiveness Prioritizes important information / Avoids false inferences Consistent visual mappings (e.g., respect color mappings) Make encodings meaningful rather than arbitrary Effectiveness Facilitates accurate decoding / Minimizes cognitive overhead Highlight elements of primary interest Grouping / Sorting Data Transformation Non-Data Elements Descriptive: Title, Label, Caption, Data Source, Annotations Reference: Gridlines, Legend Design Space of A1 Submissions Spatial Encoding Color Encoding Data Transformation Sorting Labeling Scatter plots, Bar charts, Line charts, Dot plots, Parallel Coords, Maps Nominal, Highlights, Quantitative Normalize (by pop), regression lines, grouping (threshold), medal weights By medal count, or derived metrics Title, Caption, Axis labels Annotations, Country flags 3
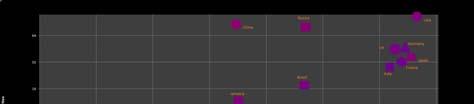
4 Scatter Plots 4
5 5
6 6


7 7

8 8
9 9

10 10
11 11
12 12
13 13
14 Multiple Plots 14

15 Gender Ratio 15
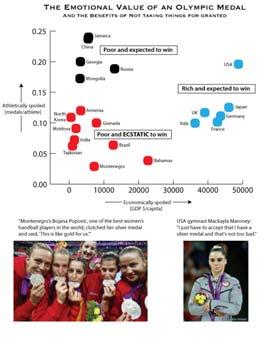
16 Socioeconomics of the Olympics 16

17 17
18 18
19 Reference Lines & Fitting Models 19

20 20
21 21


22 22
23 Line Charts 23

24 Bar Charts 24


25 25


26 26


27 27


28 28


29 29

30 Dot Plots 30


31 Parallel Coordinates & Bump Charts 31


32 32

33 Maps 33


34 Other 34

35 35


36 36
 Mackinlay s Ranking Source: The Atlantic")
37 In-Class Design Exercise Visualization Design In-Class Exercise Task: Analyze and Re-design visualization Identify data variables (n,o,q) and encodings Critique the design: what works, what doesn t Sketch a re-design to improve communication Be ready to share your thoughts with the class Break into groups with those sitting near you (~4 people per group) Mackinlay s Ranking Source: The Atlantic 300 no. 2 (September 2007) Number of Classified U.S. Documents Conjectured effectiveness of the encoding 37


38 Washington Dulles Airport Map Source: United Airlines Hemispheres Source: National Geographic, September, 2008, p. 22. Silver, Mark. "High School Give-and-Take." Source: Business Week, June 18, 2007 Preparing for a Pandemic Source: Scientific American, 293(5). November, 2005, p


39 Source: Wired Magazine, September 2008 Edition Music: Super Cuts (page 92) 39
Visualization Re-Design
 CS448B :: 28 Sep 2010 Visualization Re-Design Last Time: Data and Image Models Jeffrey Heer Stanford University The Big Picture Taxonomy task data physical type int, float, etc. abstract type nominal,
Project II. argument/reasoning based on the dataset)
") Project II Hive: Simple queries (join, aggregation, group by) Hive: Advanced queries (text extraction, link prediction and graph analysis) Tableau: Visualizations (mutidimensional, interactive, support
Project II Hive: Simple queries (join, aggregation, group by) Hive: Advanced queries (text extraction, link prediction and graph analysis) Tableau: Visualizations (mutidimensional, interactive, support
Visual Encoding Design
 CSE 442 - Data Visualization Visual Encoding Design Jeffrey Heer University of Washington Last Time: Data & Image Models The Big Picture task questions, goals assumptions data physical data type conceptual
Last Time: Value of Visualization
 CS448B :: 29 Sep 2011 Data and Image Models Last Time: Value of Visualization Jeffrey Heer Stanford University The Value of Visualization Record information Blueprints, photographs, seismographs, Analyze
Data and Image Models
 CSE 442 - Data Visualization Data and Image Models Jeffrey Heer University of Washington Last Week: Value of Visualization The Value of Visualization Record information Blueprints, photographs, seismographs,
Data and Image Models
 CSE 512 - Data Visualization Data and Image Models Jeffrey Heer University of Washington Last Time: Value of Visualization The Value of Visualization Record information Blueprints, photographs, seismographs,
Data and Image Models
 CSE 442 - Data Visualization Data and Image Models Jeffrey Heer University of Washington Last Time: Value of Visualization The Value of Visualization Record information Blueprints, photographs, seismographs,
We will start at 2:05 pm! Thanks for coming early!
 We will start at 2:05 pm! Thanks for coming early! Yesterday Fundamental 1. Value of visualization 2. Design principles 3. Graphical perception Record Information Support Analytical Reasoning Communicate
Visual Encoding Design
 CSE 442 - Data Visualization Visual Encoding Design Jeffrey Heer University of Washington Review: Expressiveness & Effectiveness / APT Choosing Visual Encodings Assume k visual encodings and n data attributes.
CIS 4930/6930 Spring 2014 Introduction to Data Science /Data Intensive Computing. University of Florida, CISE Department Prof.
 CIS 4930/6930 Spring 2014 Introduction to Data Science /Data Intensive Computing University of Florida, CISE Department Prof. Daisy Zhe Wang Data Visualization Value of Visualization Data And Image Models
Cartographic symbolization
 Symbology Cartographic symbolization Cartographic symbolization is based on a systematic approach for selecting the graphic symbols to use on a map Symbolization is the process of creating graphic symbols
S. Rinzivillo DATA VISUALIZATION AND VISUAL ANALYTICS
 S. Rinzivillo rinzivillo@isti.cnr.it DATA VISUALIZATION AND VISUAL ANALYTICS Perception and Cognition vs Game #4 How many 3s? 1258965168765132168943213 5463479654321320354968413 2068798417184529529287149
MODELS AND FRAMEWORKS. Information Visualization Fall 2009 Jinwook Seo SNU CSE
 MODELS AND FRAMEWORKS Information Visualization Fall 2009 Jinwook Seo SNU CSE Wednesday Prof. Hee-Joon Bae, Seoul National University Bundang Hostpital blood pressure and END (early neurologic deterioration)
To make sense of data, you can start by answering the following questions:
 Taken from the Introductory Biology 1, 181 lab manual, Biological Sciences, Copyright NCSU (with appreciation to Dr. Miriam Ferzli--author of this appendix of the lab manual). Appendix : Understanding
IAT 355 Visual Analytics. Animation 2. Lyn Bartram. Many of these slides were borrowed from M. Hearst and J. Heer
 IAT 355 Visual Analytics Animation 2 Lyn Bartram Many of these slides were borrowed from M. Hearst and J. Heer Today A Primer! Things to do when designing your visualization Project concerns Animation
Lecture 5: DATA MAPPING & VISUALIZATION. November 3 rd, Presented by: Anum Masood (TA)
") 1/59 Lecture 5: DATA MAPPING & VISUALIZATION November 3 rd, 2017 Presented by: Anum Masood (TA) 2/59 Recap: Data What is Data Visualization? Data Attributes Visual Attributes Mapping What are data attributes?
1/59 Lecture 5: DATA MAPPING & VISUALIZATION November 3 rd, 2017 Presented by: Anum Masood (TA) 2/59 Recap: Data What is Data Visualization? Data Attributes Visual Attributes Mapping What are data attributes?
1. Data Analysis Yields Numbers & Visualizations. 2. Why Visualize Data? 3. What do Visualizations do? 4. Research on Visualizations
 Data Analysis & Business Intelligence Made Easy with Excel Power Tools Excel Data Analysis Basics = E-DAB Notes for Video: E-DAB-05- Visualizations: Table, Charts, Conditional Formatting & Dashboards Outcomes
Homework # 4. Example: Age in years. Answer: Discrete, quantitative, ratio. a) Year that an event happened, e.g., 1917, 1950, 2000.
 Year that an event happened, e.g., 1917, 1950, 2000.") Homework # 4 1. Attribute Types Classify the following attributes as binary, discrete, or continuous. Further classify the attributes as qualitative (nominal or ordinal) or quantitative (interval or ratio).
Homework # 4 1. Attribute Types Classify the following attributes as binary, discrete, or continuous. Further classify the attributes as qualitative (nominal or ordinal) or quantitative (interval or ratio).
An Introduction to Data Analysis, Statistics, and Graphing
 An Introduction to Data Analysis, Statistics, and Graphing What is a Graph? Present processes, relationships, and changes in a visual format that is easily understandable Attempts to engage viewers by
Multivariate Data & Tables and Graphs. Agenda. Data and its characteristics Tables and graphs Design principles
 Topic Notes Multivariate Data & Tables and Graphs CS 7450 - Information Visualization Aug. 27, 2012 John Stasko Agenda Data and its characteristics Tables and graphs Design principles Fall 2012 CS 7450
The basic arrangement of numeric data is called an ARRAY. Array is the derived data from fundamental data Example :- To store marks of 50 student
 Organizing data Learning Outcome 1. make an array 2. divide the array into class intervals 3. describe the characteristics of a table 4. construct a frequency distribution table 5. constructing a composite
Approaches to Visual Mappings
 Approaches to Visual Mappings CMPT 467/767 Visualization Torsten Möller Weiskopf/Machiraju/Möller Overview Effectiveness of mappings Mapping to positional quantities Mapping to shape Mapping to color Mapping
Chapter 2: Understanding Data Distributions with Tables and Graphs
 Test Bank Chapter 2: Understanding Data with Tables and Graphs Multiple Choice 1. Which of the following would best depict nominal level data? a. pie chart b. line graph c. histogram d. polygon Ans: A
cs6630 September VISUAL ENCODING Miriah Meyer University of Utah
 cs6630 September 9 2014 VISUAL ENCODING Miriah Meyer University of Utah 1 administrivia... 2 - introducing Dr. Josh Levine 3 last time... 4 data abstraction the what part of an analysis that pertains to
Multi-Dimensional Vis
 CSE512 :: 21 Jan 2014 Multi-Dimensional Vis Jeffrey Heer University of Washington 1 Last Time: Exploratory Data Analysis 2 Exposure, the effective laying open of the data to display the unanticipated,
Step 10 Visualisation Carlos Moura
 Step 10 Visualisation Carlos Moura COIN 2017-15th JRC Annual Training on Composite Indicators & Scoreboards 06-08/11/2017, Ispra (IT) Effective communication through visualization Why investing on visual
Multivariate Data More Overview
 Multivariate Data More Overview CS 4460 - Information Visualization Jim Foley Last Revision August 2016 Some Key Concepts Quick Review Data Types Data Marks Basic Data Types N-Nominal (categorical) Equal
Multivariate Data & Tables and Graphs
 Multivariate Data & Tables and Graphs CS 4460/7450 - Information Visualization Jan. 13, 2009 John Stasko Agenda Data and its characteristics Tables and graphs Design principles Spring 2009 CS 4460/7450
Grundlagen methodischen Arbeitens Informationsvisualisierung [WS ] Monika Lanzenberger
![Grundlagen methodischen Arbeitens Informationsvisualisierung [WS ] Monika Lanzenberger](/thumbs/96/126572662.jpg "Grundlagen methodischen Arbeitens Informationsvisualisierung [WS ] Monika Lanzenberger") Grundlagen methodischen Arbeitens Informationsvisualisierung [WS0708 01 ] Monika Lanzenberger lanzenberger@ifs.tuwien.ac.at 17. 10. 2007 Current InfoVis Research Activities: AlViz 2 [Lanzenberger et al.,
Grundlagen methodischen Arbeitens Informationsvisualisierung [WS0708 01 ] Monika Lanzenberger lanzenberger@ifs.tuwien.ac.at 17. 10. 2007 Current InfoVis Research Activities: AlViz 2 [Lanzenberger et al.,
Parallel Coordinates CS 6630 Scientific Visualization
 Parallel Coordinates CS 6630 Scientific Visualization Yang Shen u0879466 Jason Davies Example Jason s parallel coordinates is fairly effective when it comes to interaction. I like the way creating filter
CS-5630 / CS-6630 Visualization for Data Science The Visualization Alphabet: Marks and Channels
 CS-5630 / CS-6630 Visualization for Data Science The Visualization Alphabet: Marks and Channels Alexander Lex alex@sci.utah.edu [xkcd] How can I visually represent two numbers, e.g., 4 and 8 Marks & Channels
The Semiology of Graphics Pat Hanrahan Stanford University Representations
 The Semiology of Graphics 2 Pat Hanrahan Stanford University Representations Page 1 Number Scrabble [Simon] Given: The numbers 1 through 9 Goal: Pick three numbers that sum to 15 Number Scrabble [Simon]
Step-by-step guide to making a simple graph in Google Sheets Mariëlle Hoefnagels, University of Oklahoma
 Step-by-step guide to making a simple graph in Google Sheets Mariëlle Hoefnagels, University of Oklahoma The following tutorial includes bare-bones instructions for using Google Sheets to make two types
Multivariate Data & Tables and Graphs. Agenda. Data and its characteristics Tables and graphs Design principles
 Multivariate Data & Tables and Graphs CS 7450 - Information Visualization Aug. 24, 2015 John Stasko Agenda Data and its characteristics Tables and graphs Design principles Fall 2015 CS 7450 2 1 Data Data
Statistical graphics in analysis Multivariable data in PCP & scatter plot matrix. Paula Ahonen-Rainio Maa Visual Analysis in GIS
 Statistical graphics in analysis Multivariable data in PCP & scatter plot matrix Paula Ahonen-Rainio Maa-123.3530 Visual Analysis in GIS 11.11.2015 Topics today YOUR REPORTS OF A-2 Thematic maps with charts
Why Should We Care? More importantly, it is easy to lie or deceive people with bad plots
 Plots & Graphs Why Should We Care? Everyone uses plots and/or graphs But most people ignore or are unaware of simple principles Default plotting tools (or default settings) are not always the best More
The Science of Data Visualization
 Welcome # T C 1 8 The Science of Data Visualization Larry Silverstein Strategic Sales Consultant Tableau Start Your (Visualization) Engines Agenda The science of data visualization Best practices for building
Making Tables and Graphs with Excel. The Basics
 Making Tables and Graphs with Excel The Basics Where do my IV and DV go? Just like you would create a data table on paper, your IV goes in the leftmost column and your DV goes to the right of the IV Enter
Studying in the Sciences
 Organising data and creating figures (charts and graphs) in Excel What is in this guide Familiarisation with Excel (for beginners) Setting up data sheets Creating a chart (graph) Formatting the chart Creating
CSE Data Visualization. Multidimensional Vis. Jeffrey Heer University of Washington
 CSE 512 - Data Visualization Multidimensional Vis Jeffrey Heer University of Washington Last Time: Exploratory Data Analysis Exposure, the effective laying open of the data to display the unanticipated,
CSAP Achievement Levels Mathematics Grade 6 March, 2006
 Advanced Performance Level 4 (Score range: 589 to 830) Students demonstrate equivalency among fractions decimals, and percents; apply number sense; solve real-world problems using geometric and numeric
CSE Data Visualization. Multidimensional Vis. Jeffrey Heer University of Washington
 CSE 512 - Data Visualization Multidimensional Vis Jeffrey Heer University of Washington Last Time: Exploratory Data Analysis Exposure, the effective laying open of the data to display the unanticipated,
3. Visual Analytics (Part 1: Visual Encoding) Jacobs University Visualization and Computer Graphics Lab
 Jacobs University Visualization and Computer Graphics Lab") 3. Visual Analytics (Part 1: Visual Encoding) 3.1 Introduction Motivation Big Data cannot be analyzed anymore without the help of computers. Computers are good in quickly processing large amounts of data.
3. Visual Analytics (Part 1: Visual Encoding) 3.1 Introduction Motivation Big Data cannot be analyzed anymore without the help of computers. Computers are good in quickly processing large amounts of data.
Table of Contents (As covered from textbook)
") Table of Contents (As covered from textbook) Ch 1 Data and Decisions Ch 2 Displaying and Describing Categorical Data Ch 3 Displaying and Describing Quantitative Data Ch 4 Correlation and Linear Regression
Table of Contents (As covered from textbook) Ch 1 Data and Decisions Ch 2 Displaying and Describing Categorical Data Ch 3 Displaying and Describing Quantitative Data Ch 4 Correlation and Linear Regression
Perception Maneesh Agrawala CS : Visualization Fall 2013 Multidimensional Visualization
 Perception Maneesh Agrawala CS 294-10: Visualization Fall 2013 Multidimensional Visualization 1 Visual Encoding Variables Position Length Area Volume Value Texture Color Orientation Shape ~8 dimensions?
COPYRIGHT & TRADEMARKS... I
 Microsoft Excel XP Level 3 ABOUT VICON... I COPYRIGHT & TRADEMARKS... I DISCLAIMER... I LESSON 1 - WORKING WITH DATABASES...1 Using a Database...2 Creating a Database...2 Modifying a Database...4 Sorting
D&B Market Insight Release Notes. November, 2015
 D&B Market Insight Release Notes November, 2015 Table of Contents Table of Contents... 2 Charting Tool: Add multiple measures to charts... 3 Charting Tool: Additional enhancements to charts... 6 Data Grids:
Data Visualization Principles for Scientific Communication
 Data Visualization Principles for Scientific Communication 8-888 Introduction to Linguistic Data Analysis Using R Jerzy Wieczorek 11//15 Follow along These slides and a summary checklist are at http://www.stat.cmu.edu/~jwieczor/
Data Visualization via Conditional Formatting
 Data Visualization Data visualization - the process of displaying data (often in large quantities) in a meaningful fashion to provide insights that will support better decisions. Data visualization improves
How Do I Choose Which Type of Graph to Use?
 How Do I Choose Which Type of Graph to Use? When to Use...... a Line graph. Line graphs are used to track changes over short and long periods of time. When smaller changes exist, line graphs are better
Animation. Why use motion? Volume rendering [Lacroute 95] Cone Trees [Robertson 91]
![Animation. Why use motion? Volume rendering [Lacroute 95] Cone Trees [Robertson 91]](/thumbs/79/80418208.jpg "Animation. Why use motion? Volume rendering [Lacroute 95] Cone Trees [Robertson 91]") CS448B :: 1 Nov 2011 Animation Why use motion? Visual variable to encode data Direct attention Understand system dynamics (?) Understand state transition Increase engagement Jeffrey Heer Stanford University
CS448B :: 1 Nov 2011 Animation Why use motion? Visual variable to encode data Direct attention Understand system dynamics (?) Understand state transition Increase engagement Jeffrey Heer Stanford University
Scottish Improvement Skills
 Scottish Improvement Skills Creating a run chart on MS Excel 2007 Create and save a new Excel worksheet. Some of the details of steps given below may vary slightly depending on how Excel has been used
CS 664 Segmentation. Daniel Huttenlocher
 CS 664 Segmentation Daniel Huttenlocher Grouping Perceptual Organization Structural relationships between tokens Parallelism, symmetry, alignment Similarity of token properties Often strong psychophysical
THINKING VISUALLY: AN INTRODUCTION TO DATA & INFORMATION VISUALIZATION
 THINKING VISUALLY: AN INTRODUCTION TO DATA & INFORMATION VISUALIZATION Learning Event for CES Ontario Li Ka Shing Knowledge Institute June 22, 2016 Jesse Carliner ACTING COMMUNICATIONS & REFERENCE LIBRARIAN
Small Handbook of Information Design: 16 Principles for Better Data Visualizations
 Pino Trogu Small Handbook of Information Design: 16 Principles for Better Data Visualizations Every graphic is an ad hoc construction, therefore these rules can be broken depending on the context. However
Glyphs. Presentation Overview. What is a Glyph!? Cont. What is a Glyph!? Glyph Fundamentals. Goal of Paper. Presented by Bertrand Low
 Presentation Overview Glyphs Presented by Bertrand Low A Taxonomy of Glyph Placement Strategies for Multidimensional Data Visualization Matthew O. Ward, Information Visualization Journal, Palmgrave,, Volume
Projected Message Design Principles
 Projected Message Design Principles General Message Display Guidelines [G] G1. Screen display should follow the horizontal-vertical and left-right organization that is common to the culture of the intended
Problems With Using Microsoft Excel for Statistics
 Problems With Using Microsoft Excel for Statistics Jonathan D. Cryer (Jon-Cryer@uiowa.edu) Department of Statistics and Actuarial Science University of Iowa, Iowa City, Iowa Joint Statistical Meetings
Excel Manual X Axis Labels Below Chart 2010 Scatter
 Excel Manual X Axis Labels Below Chart 2010 Scatter Of course, I want the chart itself to remain the same, so, the x values of dots are in row "b(o/c)", their y values are in "a(h/c)" row, and their respective
Basic concepts and terms
 CHAPTER ONE Basic concepts and terms I. Key concepts Test usefulness Reliability Construct validity Authenticity Interactiveness Impact Practicality Assessment Measurement Test Evaluation Grading/marking
Marks. Marks can be classified according to the number of dimensions required for their representation: Zero: points. One: lines.
 Marks and channels Definitions Marks are basic geometric elements that depict items or links. Channels control the appearance of the marks. This way you can describe the design space of visual encodings
Chapter Two: Descriptive Methods 1/50
 Chapter Two: Descriptive Methods 1/50 2.1 Introduction 2/50 2.1 Introduction We previously said that descriptive statistics is made up of various techniques used to summarize the information contained
Chapter 2: From Graphics to Visualization
 Exercises for Chapter 2: From Graphics to Visualization 1 EXERCISE 1 Consider the simple visualization example of plotting a graph of a two-variable scalar function z = f (x, y), which is discussed in
Charts in Excel 2003
 Charts in Excel 2003 Contents Introduction Charts in Excel 2003...1 Part 1: Generating a Basic Chart...1 Part 2: Adding Another Data Series...3 Part 3: Other Handy Options...5 Introduction Charts in Excel
Few s Design Guidance
 Few s Design Guidance CS 4460 Intro. to Information Visualization September 9, 2014 John Stasko Today s Agenda Stephen Few & Perceptual Edge Fall 2014 CS 4460 2 1 Stephen Few s Guidance Excellent advice
What are we working with? Data Abstractions. Week 4 Lecture A IAT 814 Lyn Bartram
 What are we working with? Data Abstractions Week 4 Lecture A IAT 814 Lyn Bartram Munzner s What-Why-How What are we working with? DATA abstractions, statistical methods Why are we doing it? Task abstractions
Visual Computing. Lecture 2 Visualization, Data, and Process
 Visual Computing Lecture 2 Visualization, Data, and Process Pipeline 1 High Level Visualization Process 1. 2. 3. 4. 5. Data Modeling Data Selection Data to Visual Mappings Scene Parameter Settings (View
How to Remove the Pulp from Your Data Presentations. Jordan Erickson
 How to Remove the Pulp from Your Data Presentations Jordan Erickson jordan.erickson@optum.com Crown of Leadership Source: http://scienceblog.cancerresearchuk.org/2011/12/07/the-causes-of-cancer-you-can-control/
Office Excel. Charts
 Office 2007 Excel Charts October 2007 CONTENTS INTRODUCTION... 1 Bold text... 2 CHART TYPES... 3 CHOOSING A CHART... 4 CREATING A COLUMN CHART... 5 FORMATTING A COLUMN CHART... 8 Changing the chart style...
An Introduction to Content Based Image Retrieval
 CHAPTER -1 An Introduction to Content Based Image Retrieval 1.1 Introduction With the advancement in internet and multimedia technologies, a huge amount of multimedia data in the form of audio, video and
Excel for Data Visualization
 Introduction to Excel for Data Visualization CHEAT SHEET CONTENT Basic data cleaning troubleshooting... 04 Three useful excel formulas... 05 INDEX MATCH VLOOKUP COUNTIF Why use INDEX MATCH?... 06 Why use
Here is the data collected.
 Introduction to Scientific Analysis of Data Using Spreadsheets. Computer spreadsheets are very powerful tools that are widely used in Business, Science, and Engineering to perform calculations and record,
Creating and Modifying Charts
 Creating and Modifying Charts Introduction When you re ready to share data with others, a worksheet might not be the most effective way to present the information. A page full of numbers, even if formatted
The first thing we ll need is some numbers. I m going to use the set of times and drug concentration levels in a patient s bloodstream given below.
 Graphing in Excel featuring Excel 2007 1 A spreadsheet can be a powerful tool for analyzing and graphing data, but it works completely differently from the graphing calculator that you re used to. If you
Information Visualization. Overview. What is Information Visualization? SMD157 Human-Computer Interaction Fall 2003
 INSTITUTIONEN FÖR SYSTEMTEKNIK LULEÅ TEKNISKA UNIVERSITET Information Visualization SMD157 Human-Computer Interaction Fall 2003 Dec-1-03 SMD157, Information Visualization 1 L Overview What is information
EXCEL DASHBOARD AND REPORTS BASIC SKILLS
 Let s Reach For Excellence! TAN DUC INFORMATION TECHNOLOGY SCHOOL JSC Address: 103 Pasteur, Dist.1, HCMC Tel: 08 38245819; 38239761 Email: traincert@tdt-tanduc.com Website: www.tdt-tanduc.com; www.tanducits.com
Working with Charts Stratum.Viewer 6
 Working with Charts Stratum.Viewer 6 Getting Started Tasks Additional Information Access to Charts Introduction to Charts Overview of Chart Types Quick Start - Adding a Chart to a View Create a Chart with
Grade 8 Unit 1 Congruence and Similarity (4 Weeks)
") Grade 8 Unit Congruence and Similarity (4 Weeks) Stage Desired Results Established Goals Unit Description In this unit, students will explore and describe the effects of translations, rotations, reflections
Grade 8 Unit Congruence and Similarity (4 Weeks) Stage Desired Results Established Goals Unit Description In this unit, students will explore and describe the effects of translations, rotations, reflections
Mascot Insight is a new application designed to help you to organise and manage your Mascot search and quantitation results. Mascot Insight provides
 1 Mascot Insight is a new application designed to help you to organise and manage your Mascot search and quantitation results. Mascot Insight provides ways to flexibly merge your Mascot search and quantitation
Data Visualization Principles for Dashboard Design
 Data Visualization Principles for Dashboard Design Olin College, Data Dashboard Design Jerzy Wieczorek 11/10/15 1 / 70 Follow along These slides and a summary checklist are at http://www.stat.cmu.edu/~jwieczor/
DATA ABSTRACTION & INTRO TO TABLEAU
 cs6630 September 4 2014 DATA ABSTRACTION & INTRO TO TABLEAU Miriah Meyer University of Utah 1 administrivia... 2 - design critiques due tonight - first assignment out today - there *might* be 3 seats available
CSE Data Visualization. Animation. Jeffrey Heer University of Washington
 CSE 512 - Data Visualization Animation Jeffrey Heer University of Washington Why Use Motion? Visual variable to encode data Direct attention Understand system dynamics Understand state transition Increase
Visualization as an Analysis Tool: Presentation Supplement
 Visualization as an Analysis Tool: Presentation Supplement This document is a supplement to the presentation Visualization as an Analysis Tool given by Phil Groce and Jeff Janies on January 9, 2008 as
CSE512 :: 4 Feb Animation. Jeffrey Heer University of Washington
 CSE512 :: 4 Feb 2014 Animation Jeffrey Heer University of Washington 1 Why use motion? Visual variable to encode data Direct attention Understand system dynamics Understand state transition Increase engagement
Data+Dataset Types/Semantics Tasks
 Data+Dataset Types/Semantics Tasks Visualization Michael Sedlmair Reading Munzner, Visualization Analysis and Design : Chapter 2+3 (Why+What+How) Shneiderman, The Eyes Have It: A Task by Data Type Taxonomy
4. Basic Mapping Techniques
 4. Basic Mapping Techniques Mapping from (filtered) data to renderable representation Most important part of visualization Possible visual representations: Position Size Orientation Shape Brightness Color
CP SC 8810 Data Visualization. Joshua Levine
 CP SC 8810 Data Visualization Joshua Levine levinej@clemson.edu Lecture 15 Text and Sets Oct. 14, 2014 Agenda Lab 02 Grades! Lab 03 due in 1 week Lab 2 Summary Preferences on x-axis label separation 10
Counting shapes 1.4.6
 GRADE R_TERM 1 WEEK TOPIC CONTENT CAMI KEYSTROKE CAMI Program Count in ones 1.1.1.1; 1.1.1.2; 1.1.1.3 1.1.1.4 Cami Math Count pictures 1.1.3.1; 1.1.3.2; 1 & 2 Counting 1.1.3.3; 1.1.3.4; Counting in units
EDWARD TUFTE. The Visual Display of Quantitative Information. Envisioning Information. Edward Tufte
 EDWARD TUFTE The Leonardo da Vinci of data. -The New York Times The Visual Display of Quantitative Information Envisioning Information Edward Tufte Edward Tufte Background Info Visual Display of Quantitative
Grade Level Expectations for the Sunshine State Standards
 for the Sunshine State Standards FLORIDA DEPARTMENT OF EDUCATION http://www.myfloridaeducation.com/ The seventh grade student: Number Sense, Concepts, and Operations knows word names and standard numerals
Prentice Hall Mathematics: Geometry 2007 Correlated to: Arizona Academic Standards for Mathematics (Grades 9-12)
") Strand 1: Number Sense and Operations Every student should understand and use all concepts and skills from the previous grade levels. The standards are designed so that new learning builds on preceding
Strand 1: Number Sense and Operations Every student should understand and use all concepts and skills from the previous grade levels. The standards are designed so that new learning builds on preceding
Information Visualization - Introduction
 Information Visualization - Introduction Institute of Computer Graphics and Algorithms Information Visualization The use of computer-supported, interactive, visual representations of abstract data to amplify
University of Florida CISE department Gator Engineering. Visualization
 Visualization Dr. Sanjay Ranka Professor Computer and Information Science and Engineering University of Florida What is visualization? Visualization is the process of converting data (information) in to
Statistical Package for the Social Sciences INTRODUCTION TO SPSS SPSS for Windows Version 16.0: Its first version in 1968 In 1975.
 Statistical Package for the Social Sciences INTRODUCTION TO SPSS SPSS for Windows Version 16.0: Its first version in 1968 In 1975. SPSS Statistics were designed INTRODUCTION TO SPSS Objective About the
PLANNING. CAEL Networked Worlds WEEK 2
 PLANNING CAEL5045 - Networked Worlds WEEK 2 WEEK 2 CHOOSING COLOURS CHOOSING FONTS COLLECTING CONTENT PLANNING STRUCTURE WIREFRAMES + MOCKUPS Every colour, including black and white, has implications for
7 th Grade HONORS Year at a Glance
 These skills will be incorporated into at least 75% of the test questions in reporting categories 1 5 and will be identified along with content standards. 7.13A identify and apply mathematics to everyday
Test Bank for Privitera, Statistics for the Behavioral Sciences
 1. A simple frequency distribution A) can be used to summarize grouped data B) can be used to summarize ungrouped data C) summarizes the frequency of scores in a given category or range 2. To determine
Pacing Guide. Seventh Grade Math. Shelburne Middle School Staunton City Schools Staunton, Virginia June 2010
 2010 2011 Pacing Guide Seventh Grade Math Shelburne Middle School Staunton City Schools Staunton, Virginia June 2010 2010 2011 Pacing Overview Dates (2001 SOLs) SOL (2009 SOLs) Topics Aug. 18 - Aug. 20
Frequency Distributions
 Displaying Data Frequency Distributions After collecting data, the first task for a researcher is to organize and summarize the data so that it is possible to get a general overview of the results. Remember,
Week 7 Picturing Network. Vahe and Bethany
 Week 7 Picturing Network Vahe and Bethany Freeman (2005) - Graphic Techniques for Exploring Social Network Data The two main goals of analyzing social network data are identification of cohesive groups