Visualization Re-Design
|
|
|
- Prosper Higgins
- 6 years ago
- Views:
Transcription


 Trees (hierarchies) Networks (graphs) Are there others?")
1 CS448B :: 28 Sep 2010 Visualization Re-Design Last Time: Data and Image Models Jeffrey Heer Stanford University The Big Picture Taxonomy task data physical type int, float, etc. abstract type nominal, ordinal, etc. domain metadata semantics conceptual model processing algorithms mapping visual encoding visual metaphor image visual channel perception 1D (sets and sequences) Temporal 2D (maps) 3D (shapes) nd (relational) Trees (hierarchies) Networks (graphs) Are there others? The eyes have it: A task by data type taxonomy for information visualization [Shneiderman 96] 1
 Operations: =,, <, >, -, ¹ Can measure ratios or proportions Visual Encoding Variables Position Si")
2 Nominal, Ordinal and Quantitative N - Nominal (labels) Operations: =, O - Ordered (rank-ordered, sorted) Operations: =,, <, > Q - Interval (location of zero arbitrary) Operations: =,, <, >, - Can measure distances or spans Q - Ratio (zero fixed) Operations: =,, <, >, -, ¹ Can measure ratios or proportions Visual Encoding Variables Position Size Value Texture Color Orientation Shape Others? S. S. Stevens, On the theory of scales of measurements, 1946 Design Criteria (Mackinlay) Mackinlay s Ranking Expressiveness A set of facts is expressible in a visual language if the sentences (i.e. the visualizations) in the language express all the facts in the set of data, and only the facts in the data. Effectiveness A visualization is more effective than another visualization if the information conveyed by one visualization is more readily perceived than the information in the other visualization. Conjectured effectiveness of the encoding 2
3 Design Considerations Visualization Re-Design Assignment 1 Review Title, labels, legend, captions, source! Expressiveness and Effectiveness Avoid unexpressive marks (lines? bars? gradients?) Use perceptually effective encodings Don t distract: faint gridlines, pastel highlights/fills The elimination diet approach start minimal Support comparison and pattern perception Between elements, to a reference line, or to totals Design Considerations Group / sort data by meaningful dimensions Transform data (e.g., invert, normalize) Reduce cognitive overhead Reduce memory and calculation burden Minimize visual search (e.g., legend lookups) Be consistent! Visual inferences should consistently support data inferences Design Rubric Expressiveness Prioritizes important information / Avoids false inferences Consistent visual mappings (e.g., respect color mappings) If possible, make encodings meaningful rather than arbitrary Effectiveness Facilitates accurate decoding / Minimizes cognitive overhead Highlight elements of primary interest Grouping / Sorting Data Transformation Non-Data Elements Descriptive: Title, Label, Caption, Data Source, Annotations Reference: Gridlines, Legend 3

, Highlighting None, Normalize (in year, to year), By year, by OS, by sales rank")
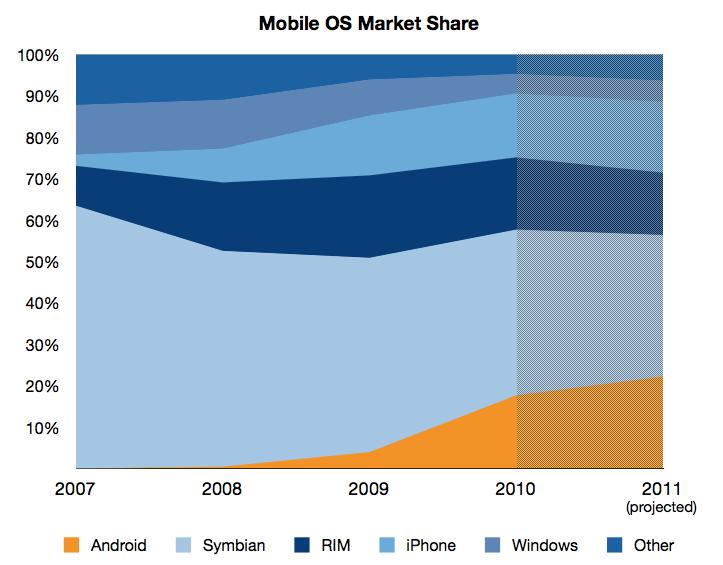
4 Design Space of A1 Submissions Spatial Encoding Color Encoding Data Transformation Sorting Labeling Stacked Area, Line, Bar, Pie, Bump Multiple charts, Hybrid charts Nominal, (Ordinal?), Highlighting None, Normalize (in year, to year), By year, by OS, by sales rank Title, Caption, Axis labels Annotation, Projected years Area Charts (Normalized) 4


5 5


6 6


7 7


8 Area Chart (Normalized) + Small Multiples 8


9 9


10 Area Charts (Not Normalized) 10


11 11

12 Stacked Graph Line Charts 12

13 13

14 14


15 Data Transformations 15


16 Pie Charts 16


17 17


18 Bar Charts 18


19 19


20 20

21 Bump Charts 21
22 In-Class Design Exercise Visualization Re-Design In-Class Exercise Task: Analyze and Re-design visualization Identify data variables (n,o,q) and encodings Critique the design: what works, what doesn t Sketch a re-design to improve communication Let Vadim photo your sketch OR it to us Present result to the class on Thursday Break into groups (~5 people per group) Re-Design Presentation (3 min) Mackinlay s Ranking 1. Describe the data and visualization (<1 min) 2. Present your critiques 3. Briefly describe your re-design ideas We will batch together the groups who redesigned the same visualization. Each group member should speak! Introduce yourself: name, department, etc Conjectured effectiveness of the encoding 22
 Number of")


23 Source: The Atlantic 300 no. 2 (September 2007) Number of Classified U.S. Documents Source: Good Magazine Washington Dulles Airport Map Source: United Airlines Hemispheres Source: National Geographic, September, 2008, p. 22. Silver, Mark. "High School Give-and-Take." 23


24 Source: Business Week, June 18, 2007 Source: India Today Preparing for a Pandemic Source: Scientific American, 293(5). November, 2005, p. 50 Source: Wired Magazine, September 2008 Edition Music: Super Cuts (page 92) 24
Last Time: Data and Image Models
 CS448B :: 2 Oct 2012 Visualization Design Last Time: Data and Image Models Jeffrey Heer Stanford University The Big Picture Nominal, Ordinal and Quantitative task questions & hypotheses intended audience
Project II. argument/reasoning based on the dataset)
") Project II Hive: Simple queries (join, aggregation, group by) Hive: Advanced queries (text extraction, link prediction and graph analysis) Tableau: Visualizations (mutidimensional, interactive, support
Project II Hive: Simple queries (join, aggregation, group by) Hive: Advanced queries (text extraction, link prediction and graph analysis) Tableau: Visualizations (mutidimensional, interactive, support
Visual Encoding Design
 CSE 442 - Data Visualization Visual Encoding Design Jeffrey Heer University of Washington Last Time: Data & Image Models The Big Picture task questions, goals assumptions data physical data type conceptual
We will start at 2:05 pm! Thanks for coming early!
 We will start at 2:05 pm! Thanks for coming early! Yesterday Fundamental 1. Value of visualization 2. Design principles 3. Graphical perception Record Information Support Analytical Reasoning Communicate
Data and Image Models
 CSE 512 - Data Visualization Data and Image Models Jeffrey Heer University of Washington Last Time: Value of Visualization The Value of Visualization Record information Blueprints, photographs, seismographs,
Last Time: Value of Visualization
 CS448B :: 29 Sep 2011 Data and Image Models Last Time: Value of Visualization Jeffrey Heer Stanford University The Value of Visualization Record information Blueprints, photographs, seismographs, Analyze
Data and Image Models
 CSE 442 - Data Visualization Data and Image Models Jeffrey Heer University of Washington Last Week: Value of Visualization The Value of Visualization Record information Blueprints, photographs, seismographs,
Data and Image Models
 CSE 442 - Data Visualization Data and Image Models Jeffrey Heer University of Washington Last Time: Value of Visualization The Value of Visualization Record information Blueprints, photographs, seismographs,
CIS 4930/6930 Spring 2014 Introduction to Data Science /Data Intensive Computing. University of Florida, CISE Department Prof.
 CIS 4930/6930 Spring 2014 Introduction to Data Science /Data Intensive Computing University of Florida, CISE Department Prof. Daisy Zhe Wang Data Visualization Value of Visualization Data And Image Models
Visual Encoding Design
 CSE 442 - Data Visualization Visual Encoding Design Jeffrey Heer University of Washington Review: Expressiveness & Effectiveness / APT Choosing Visual Encodings Assume k visual encodings and n data attributes.
Lecture 5: DATA MAPPING & VISUALIZATION. November 3 rd, Presented by: Anum Masood (TA)
") 1/59 Lecture 5: DATA MAPPING & VISUALIZATION November 3 rd, 2017 Presented by: Anum Masood (TA) 2/59 Recap: Data What is Data Visualization? Data Attributes Visual Attributes Mapping What are data attributes?
1/59 Lecture 5: DATA MAPPING & VISUALIZATION November 3 rd, 2017 Presented by: Anum Masood (TA) 2/59 Recap: Data What is Data Visualization? Data Attributes Visual Attributes Mapping What are data attributes?
S. Rinzivillo DATA VISUALIZATION AND VISUAL ANALYTICS
 S. Rinzivillo rinzivillo@isti.cnr.it DATA VISUALIZATION AND VISUAL ANALYTICS Perception and Cognition vs Game #4 How many 3s? 1258965168765132168943213 5463479654321320354968413 2068798417184529529287149
Cartographic symbolization
 Symbology Cartographic symbolization Cartographic symbolization is based on a systematic approach for selecting the graphic symbols to use on a map Symbolization is the process of creating graphic symbols
cs6630 September VISUAL ENCODING Miriah Meyer University of Utah
 cs6630 September 9 2014 VISUAL ENCODING Miriah Meyer University of Utah 1 administrivia... 2 - introducing Dr. Josh Levine 3 last time... 4 data abstraction the what part of an analysis that pertains to
Grundlagen methodischen Arbeitens Informationsvisualisierung [WS ] Monika Lanzenberger
![Grundlagen methodischen Arbeitens Informationsvisualisierung [WS ] Monika Lanzenberger](/thumbs/96/126572662.jpg "Grundlagen methodischen Arbeitens Informationsvisualisierung [WS ] Monika Lanzenberger") Grundlagen methodischen Arbeitens Informationsvisualisierung [WS0708 01 ] Monika Lanzenberger lanzenberger@ifs.tuwien.ac.at 17. 10. 2007 Current InfoVis Research Activities: AlViz 2 [Lanzenberger et al.,
Grundlagen methodischen Arbeitens Informationsvisualisierung [WS0708 01 ] Monika Lanzenberger lanzenberger@ifs.tuwien.ac.at 17. 10. 2007 Current InfoVis Research Activities: AlViz 2 [Lanzenberger et al.,
MODELS AND FRAMEWORKS. Information Visualization Fall 2009 Jinwook Seo SNU CSE
 MODELS AND FRAMEWORKS Information Visualization Fall 2009 Jinwook Seo SNU CSE Wednesday Prof. Hee-Joon Bae, Seoul National University Bundang Hostpital blood pressure and END (early neurologic deterioration)
INFORMATION VISUALIZATION
 CSE 557A Sep 26, 2016 INFORMATION VISUALIZATION Alvitta Ottley Washington University in St. Louis Slide Credits: Mariah Meyer, University of Utah Remco Chang, Tufts University HEIDELBERG LAUREATE FORUM
To make sense of data, you can start by answering the following questions:
 Taken from the Introductory Biology 1, 181 lab manual, Biological Sciences, Copyright NCSU (with appreciation to Dr. Miriam Ferzli--author of this appendix of the lab manual). Appendix : Understanding
Glyphs. Presentation Overview. What is a Glyph!? Cont. What is a Glyph!? Glyph Fundamentals. Goal of Paper. Presented by Bertrand Low
 Presentation Overview Glyphs Presented by Bertrand Low A Taxonomy of Glyph Placement Strategies for Multidimensional Data Visualization Matthew O. Ward, Information Visualization Journal, Palmgrave,, Volume
Data+Dataset Types/Semantics Tasks
 Data+Dataset Types/Semantics Tasks Visualization Michael Sedlmair Reading Munzner, Visualization Analysis and Design : Chapter 2+3 (Why+What+How) Shneiderman, The Eyes Have It: A Task by Data Type Taxonomy
Multivariate Data & Tables and Graphs
 Multivariate Data & Tables and Graphs CS 4460/7450 - Information Visualization Jan. 13, 2009 John Stasko Agenda Data and its characteristics Tables and graphs Design principles Spring 2009 CS 4460/7450
IAT 355 Visual Analytics. Animation 2. Lyn Bartram. Many of these slides were borrowed from M. Hearst and J. Heer
 IAT 355 Visual Analytics Animation 2 Lyn Bartram Many of these slides were borrowed from M. Hearst and J. Heer Today A Primer! Things to do when designing your visualization Project concerns Animation
ADD A 3-D PIE CHART TO THE WORKBOOK
 ADD A 3-D PIE CHART TO THE WORKBOOK A pie chart is an easy way to show the relationship of items to the whole. In this exercise, you will be creating a Pie Chart that will show the relationship between
Multivariate Data & Tables and Graphs. Agenda. Data and its characteristics Tables and graphs Design principles
 Topic Notes Multivariate Data & Tables and Graphs CS 7450 - Information Visualization Aug. 27, 2012 John Stasko Agenda Data and its characteristics Tables and graphs Design principles Fall 2012 CS 7450
Information Visualization. SWE 432, Fall 2016 Design and Implementation of Software for the Web
 Information Visualization SWE 432, Fall 2016 Design and Implementation of Software for the Web Today What types of information visualization are there? Which one should you choose? What does usability
Parallel Coordinates CS 6630 Scientific Visualization
 Parallel Coordinates CS 6630 Scientific Visualization Yang Shen u0879466 Jason Davies Example Jason s parallel coordinates is fairly effective when it comes to interaction. I like the way creating filter
CS-5630 / CS-6630 Visualization for Data Science The Visualization Alphabet: Marks and Channels
 CS-5630 / CS-6630 Visualization for Data Science The Visualization Alphabet: Marks and Channels Alexander Lex alex@sci.utah.edu [xkcd] How can I visually represent two numbers, e.g., 4 and 8 Marks & Channels
Multivariate Data More Overview
 Multivariate Data More Overview CS 4460 - Information Visualization Jim Foley Last Revision August 2016 Some Key Concepts Quick Review Data Types Data Marks Basic Data Types N-Nominal (categorical) Equal
Multi-Dimensional Vis
 CSE512 :: 21 Jan 2014 Multi-Dimensional Vis Jeffrey Heer University of Washington 1 Last Time: Exploratory Data Analysis 2 Exposure, the effective laying open of the data to display the unanticipated,
Animation. Why use motion? Volume rendering [Lacroute 95] Cone Trees [Robertson 91]
![Animation. Why use motion? Volume rendering [Lacroute 95] Cone Trees [Robertson 91]](/thumbs/79/80418208.jpg "Animation. Why use motion? Volume rendering [Lacroute 95] Cone Trees [Robertson 91]") CS448B :: 1 Nov 2011 Animation Why use motion? Visual variable to encode data Direct attention Understand system dynamics (?) Understand state transition Increase engagement Jeffrey Heer Stanford University
CS448B :: 1 Nov 2011 Animation Why use motion? Visual variable to encode data Direct attention Understand system dynamics (?) Understand state transition Increase engagement Jeffrey Heer Stanford University
Data Visualization via Conditional Formatting
 Data Visualization Data visualization - the process of displaying data (often in large quantities) in a meaningful fashion to provide insights that will support better decisions. Data visualization improves
Information Visualization. Overview. What is Information Visualization? SMD157 Human-Computer Interaction Fall 2003
 INSTITUTIONEN FÖR SYSTEMTEKNIK LULEÅ TEKNISKA UNIVERSITET Information Visualization SMD157 Human-Computer Interaction Fall 2003 Dec-1-03 SMD157, Information Visualization 1 L Overview What is information
Approaches to Visual Mappings
 Approaches to Visual Mappings CMPT 467/767 Visualization Torsten Möller Weiskopf/Machiraju/Möller Overview Effectiveness of mappings Mapping to positional quantities Mapping to shape Mapping to color Mapping
Perception Maneesh Agrawala CS : Visualization Fall 2013 Multidimensional Visualization
 Perception Maneesh Agrawala CS 294-10: Visualization Fall 2013 Multidimensional Visualization 1 Visual Encoding Variables Position Length Area Volume Value Texture Color Orientation Shape ~8 dimensions?
Homework # 4. Example: Age in years. Answer: Discrete, quantitative, ratio. a) Year that an event happened, e.g., 1917, 1950, 2000.
 Year that an event happened, e.g., 1917, 1950, 2000.") Homework # 4 1. Attribute Types Classify the following attributes as binary, discrete, or continuous. Further classify the attributes as qualitative (nominal or ordinal) or quantitative (interval or ratio).
Homework # 4 1. Attribute Types Classify the following attributes as binary, discrete, or continuous. Further classify the attributes as qualitative (nominal or ordinal) or quantitative (interval or ratio).
COPYRIGHT & TRADEMARKS... I
 Microsoft Excel XP Level 3 ABOUT VICON... I COPYRIGHT & TRADEMARKS... I DISCLAIMER... I LESSON 1 - WORKING WITH DATABASES...1 Using a Database...2 Creating a Database...2 Modifying a Database...4 Sorting
Small Handbook of Information Design: 16 Principles for Better Data Visualizations
 Pino Trogu Small Handbook of Information Design: 16 Principles for Better Data Visualizations Every graphic is an ad hoc construction, therefore these rules can be broken depending on the context. However
Lecture 3: Data Principles
 Lecture 3: Data Principles Information Visualization CPSC 533C, Fall 2011 Tamara Munzner UBC Computer Science Mon, 19 September 2011 1 / 33 Papers Covered Chapter 2: Data Principles Polaris: A System for
Information Visualization - Introduction
 Information Visualization - Introduction Institute of Computer Graphics and Algorithms Information Visualization The use of computer-supported, interactive, visual representations of abstract data to amplify
MICROSOFT EXCEL Working with Charts
 MICROSOFT EXCEL 2010 Working with Charts Introduction to charts WORKING WITH CHARTS Charts basically represent your data graphically. The data here refers to numbers. In Excel, you have various types of
Creating and Modifying Charts
 Creating and Modifying Charts Introduction When you re ready to share data with others, a worksheet might not be the most effective way to present the information. A page full of numbers, even if formatted
Multivariate Data & Tables and Graphs. Agenda. Data and its characteristics Tables and graphs Design principles
 Multivariate Data & Tables and Graphs CS 7450 - Information Visualization Aug. 24, 2015 John Stasko Agenda Data and its characteristics Tables and graphs Design principles Fall 2015 CS 7450 2 1 Data Data
Few s Design Guidance
 Few s Design Guidance CS 4460 Intro. to Information Visualization September 9, 2014 John Stasko Today s Agenda Stephen Few & Perceptual Edge Fall 2014 CS 4460 2 1 Stephen Few s Guidance Excellent advice
1. Data Analysis Yields Numbers & Visualizations. 2. Why Visualize Data? 3. What do Visualizations do? 4. Research on Visualizations
 Data Analysis & Business Intelligence Made Easy with Excel Power Tools Excel Data Analysis Basics = E-DAB Notes for Video: E-DAB-05- Visualizations: Table, Charts, Conditional Formatting & Dashboards Outcomes
STAT1010 cautions on graphics
 3.4 Cautions with Graphics Graphics can be misleading. How do we perceive the graphic? Is the graphic portrayed honestly? Are they comparing apples to apples? Or apples to oranges? Is it a percentage change
Visualization as an Analysis Tool: Presentation Supplement
 Visualization as an Analysis Tool: Presentation Supplement This document is a supplement to the presentation Visualization as an Analysis Tool given by Phil Groce and Jeff Janies on January 9, 2008 as
DATA ABSTRACTION & INTRO TO TABLEAU
 cs6630 September 4 2014 DATA ABSTRACTION & INTRO TO TABLEAU Miriah Meyer University of Utah 1 administrivia... 2 - design critiques due tonight - first assignment out today - there *might* be 3 seats available
The Semiology of Graphics Pat Hanrahan Stanford University Representations
 The Semiology of Graphics 2 Pat Hanrahan Stanford University Representations Page 1 Number Scrabble [Simon] Given: The numbers 1 through 9 Goal: Pick three numbers that sum to 15 Number Scrabble [Simon]
An Introduction to Data Analysis, Statistics, and Graphing
 An Introduction to Data Analysis, Statistics, and Graphing What is a Graph? Present processes, relationships, and changes in a visual format that is easily understandable Attempts to engage viewers by
GCSE CCEA GCSE EXCEL 2010 USER GUIDE. Business and Communication Systems
 GCSE CCEA GCSE EXCEL 2010 USER GUIDE Business and Communication Systems For first teaching from September 2017 Contents Page Define the purpose and uses of a spreadsheet... 3 Define a column, row, and
The basic arrangement of numeric data is called an ARRAY. Array is the derived data from fundamental data Example :- To store marks of 50 student
 Organizing data Learning Outcome 1. make an array 2. divide the array into class intervals 3. describe the characteristics of a table 4. construct a frequency distribution table 5. constructing a composite
Projected Message Design Principles
 Projected Message Design Principles General Message Display Guidelines [G] G1. Screen display should follow the horizontal-vertical and left-right organization that is common to the culture of the intended
Counting shapes 1.4.6
 GRADE R_TERM 1 WEEK TOPIC CONTENT CAMI KEYSTROKE CAMI Program Count in ones 1.1.1.1; 1.1.1.2; 1.1.1.3 1.1.1.4 Cami Math Count pictures 1.1.3.1; 1.1.3.2; 1 & 2 Counting 1.1.3.3; 1.1.3.4; Counting in units
Chapter 2: Understanding Data Distributions with Tables and Graphs
 Test Bank Chapter 2: Understanding Data with Tables and Graphs Multiple Choice 1. Which of the following would best depict nominal level data? a. pie chart b. line graph c. histogram d. polygon Ans: A
Visual Computing. Lecture 2 Visualization, Data, and Process
 Visual Computing Lecture 2 Visualization, Data, and Process Pipeline 1 High Level Visualization Process 1. 2. 3. 4. 5. Data Modeling Data Selection Data to Visual Mappings Scene Parameter Settings (View
4. Basic Mapping Techniques
 4. Basic Mapping Techniques Mapping from (filtered) data to renderable representation Most important part of visualization Possible visual representations: Position Size Orientation Shape Brightness Color
Excel Manual X Axis Labels Below Chart 2010 Scatter
 Excel Manual X Axis Labels Below Chart 2010 Scatter Of course, I want the chart itself to remain the same, so, the x values of dots are in row "b(o/c)", their y values are in "a(h/c)" row, and their respective
1. Click in cell A2, and then drag to cell D5 to select the data in those four rows and columns.
 Training Chart work EXERCISE 1: CREATE A CHART 1. Click in cell A2, and then drag to cell D5 to select the data in those four rows and columns. 2. On the ribbon, click the Insert tab. In the Charts group,
CSE Data Visualization. Multidimensional Vis. Jeffrey Heer University of Washington
 CSE 512 - Data Visualization Multidimensional Vis Jeffrey Heer University of Washington Last Time: Exploratory Data Analysis Exposure, the effective laying open of the data to display the unanticipated,
Table of Contents (As covered from textbook)
") Table of Contents (As covered from textbook) Ch 1 Data and Decisions Ch 2 Displaying and Describing Categorical Data Ch 3 Displaying and Describing Quantitative Data Ch 4 Correlation and Linear Regression
Table of Contents (As covered from textbook) Ch 1 Data and Decisions Ch 2 Displaying and Describing Categorical Data Ch 3 Displaying and Describing Quantitative Data Ch 4 Correlation and Linear Regression
What are we working with? Data Abstractions. Week 4 Lecture A IAT 814 Lyn Bartram
 What are we working with? Data Abstractions Week 4 Lecture A IAT 814 Lyn Bartram Munzner s What-Why-How What are we working with? DATA abstractions, statistical methods Why are we doing it? Task abstractions
Step 10 Visualisation Carlos Moura
 Step 10 Visualisation Carlos Moura COIN 2017-15th JRC Annual Training on Composite Indicators & Scoreboards 06-08/11/2017, Ispra (IT) Effective communication through visualization Why investing on visual
PLANNING. CAEL Networked Worlds WEEK 2
 PLANNING CAEL5045 - Networked Worlds WEEK 2 WEEK 2 CHOOSING COLOURS CHOOSING FONTS COLLECTING CONTENT PLANNING STRUCTURE WIREFRAMES + MOCKUPS Every colour, including black and white, has implications for
Creating a Box-and-Whisker Graph in Excel: Step One: Step Two:
 Creating a Box-and-Whisker Graph in Excel: It s not as simple as selecting Box and Whisker from the Chart Wizard. But if you ve made a few graphs in Excel before, it s not that complicated to convince
CSE Data Visualization. Multidimensional Vis. Jeffrey Heer University of Washington
 CSE 512 - Data Visualization Multidimensional Vis Jeffrey Heer University of Washington Last Time: Exploratory Data Analysis Exposure, the effective laying open of the data to display the unanticipated,
Chapter 2: From Graphics to Visualization
 Exercises for Chapter 2: From Graphics to Visualization 1 EXERCISE 1 Consider the simple visualization example of plotting a graph of a two-variable scalar function z = f (x, y), which is discussed in
How to Remove the Pulp from Your Data Presentations. Jordan Erickson
 How to Remove the Pulp from Your Data Presentations Jordan Erickson jordan.erickson@optum.com Crown of Leadership Source: http://scienceblog.cancerresearchuk.org/2011/12/07/the-causes-of-cancer-you-can-control/
Today s Hall of Fame and Shame is a comparison of two generations of Google Advanced Search. This is the old interface.
 1 Today s Hall of Fame and Shame is a comparison of two generations of Google Advanced Search. This is the old interface. 2 And this is the new interface. (If you can t read the image, go to http://www.google.com/advanced_search.)
An Introduction to Content Based Image Retrieval
 CHAPTER -1 An Introduction to Content Based Image Retrieval 1.1 Introduction With the advancement in internet and multimedia technologies, a huge amount of multimedia data in the form of audio, video and
3. Visual Analytics (Part 1: Visual Encoding) Jacobs University Visualization and Computer Graphics Lab
 Jacobs University Visualization and Computer Graphics Lab") 3. Visual Analytics (Part 1: Visual Encoding) 3.1 Introduction Motivation Big Data cannot be analyzed anymore without the help of computers. Computers are good in quickly processing large amounts of data.
3. Visual Analytics (Part 1: Visual Encoding) 3.1 Introduction Motivation Big Data cannot be analyzed anymore without the help of computers. Computers are good in quickly processing large amounts of data.
extended abtract submitted to CMC-95 { International Conference on Multimodal Communication Massimo Fasciano Guy Lapalme
 Automatic generation of statistical graphics extended abtract submitted to CMC-95 { International Conference on Multimodal Communication Massimo Fasciano Guy Lapalme Departement d'informatique et de recherche
Visualization Tools. Interaction. How do people create visualizations? Jeffrey Heer Stanford University
 CS448B :: 20 Oct 2011 Interaction Visualization Tools Jeffrey Heer Stanford University How do people create visualizations? Today's first task is not to invent wholly new [graphical] techniques, though
Lecture 6: Statistical Graphics
 Lecture 6: Statistical Graphics Information Visualization CPSC 533C, Fall 2009 Tamara Munzner UBC Computer Science Mon, 28 September 2009 1 / 34 Readings Covered Multi-Scale Banking to 45 Degrees. Jeffrey
06 Visualizing Information
 Professor Shoemaker 06-VisualizingInformation.xlsx 1 It can be sometimes difficult to uncover meaning in data that s presented in a table or list Especially if the table has many rows and/or columns But
Data Visualization Principles for Scientific Communication
 Data Visualization Principles for Scientific Communication 8-888 Introduction to Linguistic Data Analysis Using R Jerzy Wieczorek 11//15 Follow along These slides and a summary checklist are at http://www.stat.cmu.edu/~jwieczor/
Introduction to CS graphs and plots in Excel Jacek Wiślicki, Laurent Babout,
 MS Excel 2010 offers a large set of graphs and plots for data visualization. For those who are familiar with older version of Excel, the layout is completely different. The following exercises demonstrate
Nobody uploads till yesterday, difficult?
 Survey Result 1 Assignment II! Nobody uploads till yesterday, difficult? 2 Last Week: Text Visualization 3 Interaction IV Course Spring 14 Graduate Course of UCAS April 4th, 2014 4 InfoVis Pipeline Visualization
Book 5. Chapter 1: Slides with SmartArt & Pictures... 1 Working with SmartArt Formatting Pictures Adjust Group Buttons Picture Styles Group Buttons
 Chapter 1: Slides with SmartArt & Pictures... 1 Working with SmartArt Formatting Pictures Adjust Group Buttons Picture Styles Group Buttons Chapter 2: Slides with Charts & Shapes... 12 Working with Charts
Select Cases. Select Cases GRAPHS. The Select Cases command excludes from further. selection criteria. Select Use filter variables
 Select Cases GRAPHS The Select Cases command excludes from further analysis all those cases that do not meet specified selection criteria. Select Cases For a subset of the datafile, use Select Cases. In
visualization of time-oriented data
 visualization of time-oriented data introduction Wolfgang Aigner aigner@ifs.tuwien.ac.at http://ieg.ifs.tuwien.ac.at/~aigner/ wolfgang.aigner@donau-uni.ac.at http://ike.donau-uni.ac.at/~aigner/ Version
Why Should We Care? More importantly, it is easy to lie or deceive people with bad plots
 Plots & Graphs Why Should We Care? Everyone uses plots and/or graphs But most people ignore or are unaware of simple principles Default plotting tools (or default settings) are not always the best More
Intellicus Enterprise Reporting and BI Platform
 Designing Adhoc Reports Intellicus Enterprise Reporting and BI Platform Intellicus Technologies info@intellicus.com www.intellicus.com Designing Adhoc Reports i Copyright 2012 Intellicus Technologies This
How Do I Choose Which Type of Graph to Use?
 How Do I Choose Which Type of Graph to Use? When to Use...... a Line graph. Line graphs are used to track changes over short and long periods of time. When smaller changes exist, line graphs are better
CP SC 8810 Data Visualization. Joshua Levine
 CP SC 8810 Data Visualization Joshua Levine levinej@clemson.edu Lecture 05 Visual Encoding Sept. 9, 2014 Agenda Programming Lab 01 Questions? Continuing from Lec04 Attribute Types no implicit ordering
Sections Graphical Displays and Measures of Center. Brian Habing Department of Statistics University of South Carolina.
 STAT 515 Statistical Methods I Sections 2.1-2.3 Graphical Displays and Measures of Center Brian Habing Department of Statistics University of South Carolina Redistribution of these slides without permission
Construction Change Order analysis CPSC 533C Analysis Project
 Construction Change Order analysis CPSC 533C Analysis Project Presented by Chiu, Chao-Ying Department of Civil Engineering University of British Columbia Problems of Using Construction Data Hybrid of physical
THINKING VISUALLY: AN INTRODUCTION TO DATA & INFORMATION VISUALIZATION
 THINKING VISUALLY: AN INTRODUCTION TO DATA & INFORMATION VISUALIZATION Learning Event for CES Ontario Li Ka Shing Knowledge Institute June 22, 2016 Jesse Carliner ACTING COMMUNICATIONS & REFERENCE LIBRARIAN
CS 216 Fall 2007 Final Exam Page 1 of 10 Name: ID:
 Page 1 of 10 Name: Email ID: You MUST write your name and e-mail ID on EACH page and bubble in your userid at the bottom of EACH page including this page. If you do not do this, you will receive a zero
INDEX UNIT 4 PPT SLIDES
 INDEX UNIT 4 PPT SLIDES S.NO. TOPIC 1. 2. Screen designing Screen planning and purpose arganizing screen elements 3. 4. screen navigation and flow Visually pleasing composition 5. 6. 7. 8. focus and emphasis
CSE512 :: 4 Feb Animation. Jeffrey Heer University of Washington
 CSE512 :: 4 Feb 2014 Animation Jeffrey Heer University of Washington 1 Why use motion? Visual variable to encode data Direct attention Understand system dynamics Understand state transition Increase engagement
Analysis of Image and Video Using Color, Texture and Shape Features for Object Identification
 IOSR Journal of Computer Engineering (IOSR-JCE) e-issn: 2278-0661,p-ISSN: 2278-8727, Volume 16, Issue 6, Ver. VI (Nov Dec. 2014), PP 29-33 Analysis of Image and Video Using Color, Texture and Shape Features
Modelling Languages: (mostly) Concrete (Visual) Syntax. Hans Vangheluwe
 Concrete (Visual) Syntax. Hans Vangheluwe") Modelling Languages: (mostly) Concrete (Visual) Syntax Hans Vangheluwe Antwerp 26 August 2014 2 3 4 5 6 Causal Block Diagrams (syntax) 7 Causal Block Diagrams (semantics) 8 Operational Semantics 9 Causal
Modelling Languages: (mostly) Concrete (Visual) Syntax Hans Vangheluwe Antwerp 26 August 2014 2 3 4 5 6 Causal Block Diagrams (syntax) 7 Causal Block Diagrams (semantics) 8 Operational Semantics 9 Causal
Why Choose Nevron Chart for SQL Server Reporting Services
 Why Choose Nevron Chart for SSRS Page 1 of 8 Why Choose Nevron Chart for SQL Server Reporting Services Why Choose Nevron Chart for SQL Server Reporting Services... 1 Charting Types... 2 Advanced Axes Features...
Understanding Geospatial Data Models
 Understanding Geospatial Data Models 1 A geospatial data model is a formal means of representing spatially referenced information. It is a simplified view of physical entities and a conceptualization of
Problems With Using Microsoft Excel for Statistics
 Problems With Using Microsoft Excel for Statistics Jonathan D. Cryer (Jon-Cryer@uiowa.edu) Department of Statistics and Actuarial Science University of Iowa, Iowa City, Iowa Joint Statistical Meetings
Working with Charts Stratum.Viewer 6
 Working with Charts Stratum.Viewer 6 Getting Started Tasks Additional Information Access to Charts Introduction to Charts Overview of Chart Types Quick Start - Adding a Chart to a View Create a Chart with
Organisation and Presentation of Data in Medical Research Dr K Saji.MD(Hom)
") Organisation and Presentation of Data in Medical Research Dr K Saji.MD(Hom) Any data collected by a research or reference also known as raw data are always in an unorganized form and need to be organized
Organisation and Presentation of Data in Medical Research Dr K Saji.MD(Hom) Any data collected by a research or reference also known as raw data are always in an unorganized form and need to be organized
3 Visualizing quantitative Information
 Elective in Software and Services (Complementi di software e servizi per la società dell'informazione) Section Information Visualization Numbers of credit : 3 Giuseppe Santucci 3 Visualizing quantitative
Key Terms. Symbology. Categorical attributes. Style. Layer file
 Key Terms Symbology Categorical attributes Style Layer file Review Questions POP-RANGE is a string field of the Cities feature class with the following entries: 0-9,999, 10,000-49,999, 50,000-99,000 This
PAGE LAYOUT IN GRAPHIC DESIGN Where do you start when you want to create an attractive and effective design?
 PAGE LAYOUT IN GRAPHIC DESIGN Where do you start when you want to create an attractive and effective design? Aims & Outcomes for this week: Aims: To understand the three main page layout conventions used