DATA ABSTRACTION & INTRO TO TABLEAU
|
|
|
- Samantha Jones
- 6 years ago
- Views:
Transcription


1 cs6630 September DATA ABSTRACTION & INTRO TO TABLEAU Miriah Meyer University of Utah 1
2 administrivia... 2
3 - design critiques due tonight - first assignment out today - there *might* be 3 seats available - I will be teaching again next fall! 3
4 last time... 4


5 120 million rods 5-6 million cones 5 Wandell, Foundations of Vision (left) David R. Williams, Univ. of Rochester (right)

6 Cone Response 6 HyperPhysics, Georgia State University
7 7 Ware 2010
8 Takeaway Our visual system sees differences, not absolute values, and is attracted to edges.! Maximize the contrast with the background if the outlines of shapes are important.


9 on-center off-center retinal ganglion cells source: wikipedia
10 Cornsweet Illusion D. Purves and R. B. Lotto

11 Cornsweet Illusion D. Purves and R. B. Lotto
12 WEBER S LAW we judge based on relative, not absolute, differences 12

13 INTERACTION OF COLOR 13 Wong 2010
14 BASIC POPOUT CHANNELS 14 Ware 2008
15 Takeaway We can easily see objects that are different in color and shape, or that are in motion.! Use color and shape sparingly to make the important information pop out.
16 Gestalt principles - similarity: things that look like each other (size, color, shape) are related - proximity: things that are visually close to each other are related - connection: things that are visually connected are related - continuity: we complete hidden objects into simple, familiar shapes - closure: we see incomplete shapes as complete - figure / ground: elements are perceived as either figures or background - common fate: elements with the same moving direction are perceived as a unit
17 - data abstraction - intro to Tableau (by Alex) 17
18 data abstraction the what part of an analysis that pertains to the data translation of domain-specific terms into words that are as generic as possible 18
19 type vs semantics 19
20 data types
21 dataset types
22 attribute Field item cell 22
23 dataset types
24 dataset types
25 dataset types
26
27


28
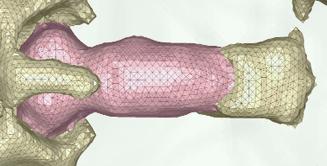
29 grid types uniform rectilinear structured unstructured
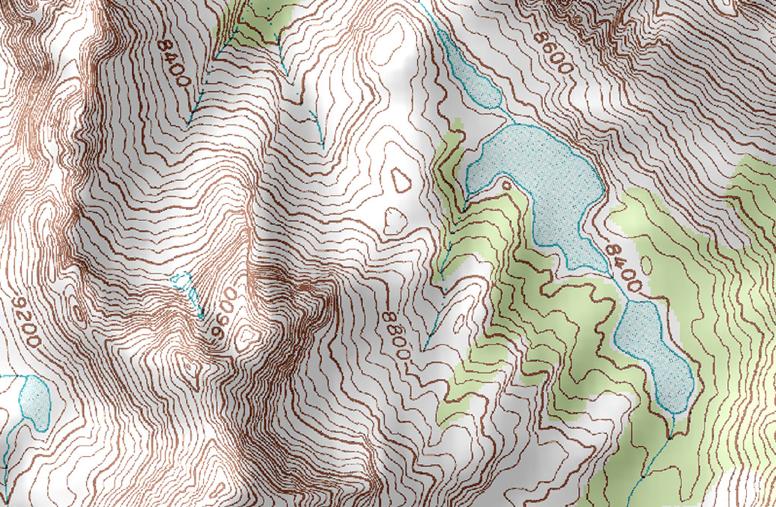
30 grid choices impact how continuous data is interpreted two key considerations: sampling, or the choice of where attributes are measured interpolation, or how to model the attributes in the rest of space
31 grid choices impact how continuous data is interpreted two key considerations: sampling, or the choice of where attributes are measured interpolation, or how to model the attributes in the rest of space Interpolate Here Interpolate Here Interpolate Here
32 dataset types
33 dataset types scalar
34 dataset types vector scalar


35 dataset types tensor vector scalar
36 dataset types


37 [Bronson 2014]
38 dataset types
39 attribute types
40 attribute types no implicit ordering
41 attribute types no implicit ordering
42 attribute types no implicit ordering
43 attribute types no implicit ordering meaningful magnitude, can do arithmetic
44 attribute types no implicit ordering meaningful magnitude, can do arithmetic
45 attribute types no implicit ordering meaningful magnitude, can do arithmetic
46 1 = Quantitative quantitative 35 2 = Nominal ordinal 3 = Ordinal categorical


47 1 = Quantitative quantitative 36 2 = Nominal ordinal 3 = Ordinal categorical

48 attribute types no implicit ordering meaningful magnitude, can do arithmetic Hierarchical

49
50 special attribute semantics key vs value
51 special attribute semantics key vs value flat tables multidimensional

52 special attribute semantics key vs value flat tables multidimensional fields
53 special attribute semantics temporal what makes time special?
54 abstraction exercise... 41

55 42
56 DERIVED ATTRIBUTES - derived attribute: compute from originals - simple change of type - acquire additional data - complex transformation - transformation is abstraction choice 43
57 DATA MODEL vs CONCEPTUAL MODEL - data model: mathematical abstraction (data abstraction) - set with operations, eg. floats with * / - +! - conceptual model: mental construction (semantics) - includes semantics, supports reasoning! - conceptual model motivates derived data (data abstraction choices) 44
58 EXAMPLE - from data model , 54.06, ,... (floats) - using conceptual model... - temperature - to new data abstraction. - continuous to 2 significant figures (Q) - hot, warm, cold (O) - above freezing, below freezing (C) 45
59 another abstraction exercise... 46


60 47
61 L5. Visual Encodings REQUIRED READING 48

62 49

63 50

64 51
65 Intro to Tableau 52
cs6630 September VISUAL ENCODING Miriah Meyer University of Utah
 cs6630 September 9 2014 VISUAL ENCODING Miriah Meyer University of Utah 1 administrivia... 2 - introducing Dr. Josh Levine 3 last time... 4 data abstraction the what part of an analysis that pertains to
CP SC 8810 Data Visualization. Joshua Levine
 CP SC 8810 Data Visualization Joshua Levine levinej@clemson.edu Lecture 05 Visual Encoding Sept. 9, 2014 Agenda Programming Lab 01 Questions? Continuing from Lec04 Attribute Types no implicit ordering
Data Visualization (CIS/DSC 468)
") Data Visualization (CIS/DSC 468) Data & Tasks Dr. David Koop Programmatic SVG Example Draw a horizontal bar chart - var a = [6, 2, 6, 10, 7, 18, 0, 17, 20, 6]; Steps: - Programmatically create SVG - Create
Data Visualization (CIS/DSC 468) Data & Tasks Dr. David Koop Programmatic SVG Example Draw a horizontal bar chart - var a = [6, 2, 6, 10, 7, 18, 0, 17, 20, 6]; Steps: - Programmatically create SVG - Create
Lecture 3: Data Principles
 Lecture 3: Data Principles Information Visualization CPSC 533C, Fall 2011 Tamara Munzner UBC Computer Science Mon, 19 September 2011 1 / 33 Papers Covered Chapter 2: Data Principles Polaris: A System for
S. Rinzivillo DATA VISUALIZATION AND VISUAL ANALYTICS
 S. Rinzivillo rinzivillo@isti.cnr.it DATA VISUALIZATION AND VISUAL ANALYTICS Perception and Cognition vs Game #4 How many 3s? 1258965168765132168943213 5463479654321320354968413 2068798417184529529287149
Visual Computing. Lecture 2 Visualization, Data, and Process
 Visual Computing Lecture 2 Visualization, Data, and Process Pipeline 1 High Level Visualization Process 1. 2. 3. 4. 5. Data Modeling Data Selection Data to Visual Mappings Scene Parameter Settings (View
Glyphs. Presentation Overview. What is a Glyph!? Cont. What is a Glyph!? Glyph Fundamentals. Goal of Paper. Presented by Bertrand Low
 Presentation Overview Glyphs Presented by Bertrand Low A Taxonomy of Glyph Placement Strategies for Multidimensional Data Visualization Matthew O. Ward, Information Visualization Journal, Palmgrave,, Volume
3.Data Abstraction. Prof. Tulasi Prasad Sariki SCSE, VIT, Chennai 1 / 26
 3.Data Abstraction Prof. Tulasi Prasad Sariki SCSE, VIT, Chennai www.learnersdesk.weebly.com 1 / 26 Outline What can be visualized? Why Do Data Semantics and Types Matter? Data Types Items, Attributes,
Data+Dataset Types/Semantics Tasks
 Data+Dataset Types/Semantics Tasks Visualization Michael Sedlmair Reading Munzner, Visualization Analysis and Design : Chapter 2+3 (Why+What+How) Shneiderman, The Eyes Have It: A Task by Data Type Taxonomy
We will start at 2:05 pm! Thanks for coming early!
 We will start at 2:05 pm! Thanks for coming early! Yesterday Fundamental 1. Value of visualization 2. Design principles 3. Graphical perception Record Information Support Analytical Reasoning Communicate
Information Visualization. Overview. What is Information Visualization? SMD157 Human-Computer Interaction Fall 2003
 INSTITUTIONEN FÖR SYSTEMTEKNIK LULEÅ TEKNISKA UNIVERSITET Information Visualization SMD157 Human-Computer Interaction Fall 2003 Dec-1-03 SMD157, Information Visualization 1 L Overview What is information
Data Visualization (DSC 530/CIS )
") Data Visualization (DSC 530/CIS 602-01) Data Dr. David Koop HTML and CSS HTML: Tags define the boundaries of the structures of the content this is cool. What about this?
Data Visualization (DSC 530/CIS 602-01) Data Dr. David Koop HTML and CSS HTML: Tags define the boundaries of the structures of the content this is cool. What about this?
INFORMATION VISUALIZATION
 CSE 557A Sep 26, 2016 INFORMATION VISUALIZATION Alvitta Ottley Washington University in St. Louis Slide Credits: Mariah Meyer, University of Utah Remco Chang, Tufts University HEIDELBERG LAUREATE FORUM
Perception Maneesh Agrawala CS : Visualization Fall 2013 Multidimensional Visualization
 Perception Maneesh Agrawala CS 294-10: Visualization Fall 2013 Multidimensional Visualization 1 Visual Encoding Variables Position Length Area Volume Value Texture Color Orientation Shape ~8 dimensions?
CS 556: Computer Vision. Lecture 18
 CS 556: Computer Vision Lecture 18 Prof. Sinisa Todorovic sinisa@eecs.oregonstate.edu 1 Color 2 Perception of Color The sensation of color is caused by the brain Strongly affected by: Other nearby colors
ACGV 2008, Lecture 1 Tuesday January 22, 2008
 Advanced Computer Graphics and Visualization Spring 2008 Ch 1: Introduction Ch 4: The Visualization Pipeline Ch 5: Basic Data Representation Organization, Spring 2008 Stefan Seipel Filip Malmberg Mats
Scientific Visualization
 Scientific Visualization Dr. Ronald Peikert Summer 2007 Ronald Peikert SciVis 2007 - Introduction 1-1 Introduction to Scientific Visualization Ronald Peikert SciVis 2007 - Introduction 1-2 What is Scientific
Data Visualization. Fall 2016
 Data Visualization Fall 2016 Information Visualization Upon now, we dealt with scientific visualization (scivis) Scivisincludes visualization of physical simulations, engineering, medical imaging, Earth
What is Computer Vision?
 Perceptual Grouping in Computer Vision Gérard Medioni University of Southern California What is Computer Vision? Computer Vision Attempt to emulate Human Visual System Perceive visual stimuli with cameras
Thanks to Chris Bregler. COS 429: Computer Vision
 Thanks to Chris Bregler COS 429: Computer Vision COS 429: Computer Vision Instructor: Szymon Rusinkiewicz TA: Linjie Luo smr@cs.princeton.edu linjiel@cs.princeton.edu Course web page http://www.cs.princeton.edu/courses/archive/fall09/cos429/
Last Time: Value of Visualization
 CS448B :: 29 Sep 2011 Data and Image Models Last Time: Value of Visualization Jeffrey Heer Stanford University The Value of Visualization Record information Blueprints, photographs, seismographs, Analyze
Step 10 Visualisation Carlos Moura
 Step 10 Visualisation Carlos Moura COIN 2017-15th JRC Annual Training on Composite Indicators & Scoreboards 06-08/11/2017, Ispra (IT) Effective communication through visualization Why investing on visual
Marks. Marks can be classified according to the number of dimensions required for their representation: Zero: points. One: lines.
 Marks and channels Definitions Marks are basic geometric elements that depict items or links. Channels control the appearance of the marks. This way you can describe the design space of visual encodings
Visualization Re-Design
 CS448B :: 28 Sep 2010 Visualization Re-Design Last Time: Data and Image Models Jeffrey Heer Stanford University The Big Picture Taxonomy task data physical type int, float, etc. abstract type nominal,
Data Representation in Visualisation
 Data Representation in Visualisation Visualisation Lecture 4 Taku Komura Institute for Perception, Action & Behaviour School of Informatics Taku Komura Data Representation 1 Data Representation We have
University of Florida CISE department Gator Engineering. Visualization
 Visualization Dr. Sanjay Ranka Professor Computer and Information Science and Engineering University of Florida What is visualization? Visualization is the process of converting data (information) in to
ECG782: Multidimensional Digital Signal Processing
 Professor Brendan Morris, SEB 3216, brendan.morris@unlv.edu ECG782: Multidimensional Digital Signal Processing Lecture 01 Introduction http://www.ee.unlv.edu/~b1morris/ecg782/ 2 Outline Computer Vision
What are we working with? Data Abstractions. Week 4 Lecture A IAT 814 Lyn Bartram
 What are we working with? Data Abstractions Week 4 Lecture A IAT 814 Lyn Bartram Munzner s What-Why-How What are we working with? DATA abstractions, statistical methods Why are we doing it? Task abstractions
cs6964 March TREES & GRAPHS Miriah Meyer University of Utah
 cs6964 March 1 2012 TREES & GRAPHS Miriah Meyer University of Utah cs6964 March 1 2012 TREES & GRAPHS Miriah Meyer University of Utah slide acknowledgements: Hanspeter Pfister, Harvard University Jeff
Visual Design. Simplicity, Gestalt Principles, Organization/Structure
 Visual Design Simplicity, Gestalt Principles, Organization/Structure Many examples are from Universal Principles of Design, Lidwell, Holden, and Butler Why discuss visual design? You need to present the
Data and Image Models
 CSE 512 - Data Visualization Data and Image Models Jeffrey Heer University of Washington Last Time: Value of Visualization The Value of Visualization Record information Blueprints, photographs, seismographs,
Communication Design and Visualising Information May 5, 2016 Centre for Internet and Society, Bangalore
 Communication Design and Visualising Information May 5, 2016 Centre for Internet and Society, Bangalore Presented at the Workshop on Research Methods for Internet Policy in South and Southeast Asia, held
CIS 467/602-01: Data Visualization
 CIS 467/602-01: Data Visualization Vector Field Visualization Dr. David Koop Fields Tables Networks & Trees Fields Geometry Clusters, Sets, Lists Items Items (nodes) Grids Items Items Attributes Links
Visualization Stages, Sensory vs. Arbitrary symbols, Data Characteristics, Visualization Goals. Trajectory Reminder
 Visualization Stages, Sensory vs. Arbitrary symbols, Data Characteristics, Visualization Goals Russell M. Taylor II Slide 1 Trajectory Reminder Where we ve been recently Seen nm system that displays 2D-in-3D
Last Time: Data and Image Models
 CS448B :: 2 Oct 2012 Visualization Design Last Time: Data and Image Models Jeffrey Heer Stanford University The Big Picture Nominal, Ordinal and Quantitative task questions & hypotheses intended audience
CIS 4930/6930 Spring 2014 Introduction to Data Science /Data Intensive Computing. University of Florida, CISE Department Prof.
 CIS 4930/6930 Spring 2014 Introduction to Data Science /Data Intensive Computing University of Florida, CISE Department Prof. Daisy Zhe Wang Data Visualization Value of Visualization Data And Image Models
CS 534: Computer Vision Segmentation and Perceptual Grouping
 CS 534: Computer Vision Segmentation and Perceptual Grouping Spring 2005 Ahmed Elgammal Dept of Computer Science CS 534 Segmentation - 1 Where are we? Image Formation Human vision Cameras Geometric Camera
Advanced Visualization
 320581 Advanced Visualization Prof. Lars Linsen Fall 2011 0 Introduction 0.1 Syllabus and Organization Course Website Link in CampusNet: http://www.faculty.jacobsuniversity.de/llinsen/teaching/320581.htm
Perception Maneesh Agrawala CS 448B: Visualization Fall 2017 Last Time: Exploratory Data Analysis
 Perception Maneesh Agrawala CS 448B: Visualization Fall 2017 Last Time: Exploratory Data Analysis 1 Will Burtin, 1951 How do the drugs compare? How do the bacteria group with respect to antibiotic resistance?
Understanding Geospatial Data Models
 Understanding Geospatial Data Models 1 A geospatial data model is a formal means of representing spatially referenced information. It is a simplified view of physical entities and a conceptualization of
cs6964 February TABULAR DATA Miriah Meyer University of Utah
 cs6964 February 23 2012 TABULAR DATA Miriah Meyer University of Utah cs6964 February 23 2012 TABULAR DATA Miriah Meyer University of Utah slide acknowledgements: John Stasko, Georgia Tech Tamara Munzner,
Data Visualization Tools & Techniques
 Data Visualization Tools & Techniques John Brosz Research Data & Visualization Coordinator Renée Reaume Digital Media & Technical Services Director http://bit.ly/tfdlvis Plan for Today 9:00 Intro 9:30
Data Visualization (DSC 530/CIS )
") Data Visualization (DSC 530/CIS 60-0) Isosurfaces & Volume Rendering Dr. David Koop Fields & Grids Fields: - Values come from a continuous domain, infinitely many values - Sampled at certain positions
Data Visualization (DSC 530/CIS 60-0) Isosurfaces & Volume Rendering Dr. David Koop Fields & Grids Fields: - Values come from a continuous domain, infinitely many values - Sampled at certain positions
MODELS AND FRAMEWORKS. Information Visualization Fall 2009 Jinwook Seo SNU CSE
 MODELS AND FRAMEWORKS Information Visualization Fall 2009 Jinwook Seo SNU CSE Wednesday Prof. Hee-Joon Bae, Seoul National University Bundang Hostpital blood pressure and END (early neurologic deterioration)
Data and Image Models
 CSE 442 - Data Visualization Data and Image Models Jeffrey Heer University of Washington Last Week: Value of Visualization The Value of Visualization Record information Blueprints, photographs, seismographs,
+ = Spatial Analysis of Raster Data. 2 =Fault in shale 3 = Fault in limestone 4 = no Fault, shale 5 = no Fault, limestone. 2 = fault 4 = no fault
 Spatial Analysis of Raster Data 0 0 1 1 0 0 1 1 1 0 1 1 1 1 1 1 2 4 4 4 2 4 5 5 4 2 4 4 4 2 5 5 4 4 2 4 5 4 3 5 4 4 4 2 5 5 5 3 + = 0 = shale 1 = limestone 2 = fault 4 = no fault 2 =Fault in shale 3 =
Lecture overview. Visualisatie BMT. Fundamental algorithms. Visualization pipeline. Structural classification - 1. Structural classification - 2
 Visualisatie BMT Fundamental algorithms Arjan Kok a.j.f.kok@tue.nl Lecture overview Classification of algorithms Scalar algorithms Vector algorithms Tensor algorithms Modeling algorithms 1 2 Visualization
Measurement. Joseph Spring. Based on Software Metrics by Fenton and Pfleeger
 Measurement Joseph Spring Based on Software Metrics by Fenton and Pfleeger Discussion Measurement Direct and Indirect Measurement Measurements met so far Measurement Scales and Types of Scale Measurement
Data Visualization. What is the goal? A generalized environment for manipulation and visualization of multidimensional data
 Data Visualization NIH-NSF NSF BBSI: Simulation and Computer Visualization of Biological Systems at Multiple Scales Joel R. Stiles, MD, PhD What is real? Examples of some mind-bending optical illusions
Data and Image Models
 CSE 442 - Data Visualization Data and Image Models Jeffrey Heer University of Washington Last Time: Value of Visualization The Value of Visualization Record information Blueprints, photographs, seismographs,
CS443: Digital Imaging and Multimedia Perceptual Grouping Detecting Lines and Simple Curves
 CS443: Digital Imaging and Multimedia Perceptual Grouping Detecting Lines and Simple Curves Spring 2008 Ahmed Elgammal Dept. of Computer Science Rutgers University Outlines Perceptual Grouping and Segmentation
Map Analysis of Raster Data I 3/8/2018
 Map Analysis of Raster Data I /8/8 Spatial Analysis of Raster Data What is Spatial Analysis? = shale = limestone 4 4 4 4 5 5 4 4 4 4 5 5 4 4 4 5 4 5 4 4 4 5 5 5 + = = fault =Fault in shale 4 = no fault
Data Visualization. What is the goal? A generalized environment for manipulation and visualization of multidimensional data
 Data Visualization NIH-NSF NSF BBSI: Simulation and Computer Visualization of Biological Systems at Multiple Scales June 2-4, 2 2004 Joel R. Stiles, MD, PhD What is the goal? A generalized environment
Overview of 3D Object Representations
 Overview of 3D Object Representations Thomas Funkhouser Princeton University C0S 426, Fall 2000 Course Syllabus I. Image processing II. Rendering III. Modeling IV. Animation Image Processing (Rusty Coleman,
Scientific Visualization Example exam questions with commented answers
 Scientific Visualization Example exam questions with commented answers The theoretical part of this course is evaluated by means of a multiple- choice exam. The questions cover the material mentioned during
Spatial Data Models. Raster uses individual cells in a matrix, or grid, format to represent real world entities
 Spatial Data Models Raster uses individual cells in a matrix, or grid, format to represent real world entities Vector uses coordinates to store the shape of spatial data objects David Tenenbaum GEOG 7
Solid Modeling. Michael Kazhdan ( /657) HB , FvDFH 12.1, 12.2, 12.6, 12.7 Marching Cubes, Lorensen et al.
 HB , FvDFH 12.1, 12.2, 12.6, 12.7 Marching Cubes, Lorensen et al.") Solid Modeling Michael Kazhdan (601.457/657) HB 10.15 10.17, 10.22 FvDFH 12.1, 12.2, 12.6, 12.7 Marching Cubes, Lorensen et al. 1987 Announcement OpenGL review session: When: Today @ 9:00 PM Where: Malone
Solid Modeling Michael Kazhdan (601.457/657) HB 10.15 10.17, 10.22 FvDFH 12.1, 12.2, 12.6, 12.7 Marching Cubes, Lorensen et al. 1987 Announcement OpenGL review session: When: Today @ 9:00 PM Where: Malone
Correlation of Ontario Mathematics 2005 Curriculum to. Addison Wesley Mathematics Makes Sense
 Correlation of Ontario Mathematics 2005 Curriculum to Addison Wesley Math Makes Sense 3 Number Sense and Numeration Overall Expectations By the end of Grade 3, students will: read, represent, compare,
Keywords Clustering, Goals of clustering, clustering techniques, clustering algorithms.
 Volume 3, Issue 5, May 2013 ISSN: 2277 128X International Journal of Advanced Research in Computer Science and Software Engineering Research Paper Available online at: www.ijarcsse.com A Survey of Clustering
Flow Visualisation - Background. CITS4241 Visualisation Lectures 20 and 21
 CITS4241 Visualisation Lectures 20 and 21 Flow Visualisation Flow visualisation is important in both science and engineering From a "theoretical" study of o turbulence or o a fusion reactor plasma, to
Data Visualization (DSC 530/CIS )
") Data Visualization (DSC 530/CIS 60-01) Scalar Visualization Dr. David Koop Online JavaScript Resources http://learnjsdata.com/ Good coverage of data wrangling using JavaScript Fields in Visualization Scalar
Data Visualization (DSC 530/CIS 60-01) Scalar Visualization Dr. David Koop Online JavaScript Resources http://learnjsdata.com/ Good coverage of data wrangling using JavaScript Fields in Visualization Scalar
8. Visual Analytics. Prof. Tulasi Prasad Sariki SCSE, VIT, Chennai
 8. Visual Analytics Prof. Tulasi Prasad Sariki SCSE, VIT, Chennai www.learnersdesk.weebly.com Graphs & Trees Graph Vertex/node with one or more edges connecting it to another node. Cyclic or acyclic Edge
Introduction to ANSYS DesignXplorer
 Lecture 4 14. 5 Release Introduction to ANSYS DesignXplorer 1 2013 ANSYS, Inc. September 27, 2013 s are functions of different nature where the output parameters are described in terms of the input parameters
cs6964 March TOOLKITS Miriah Meyer University of Utah
 cs6964 March 8 2012 TOOLKITS Miriah Meyer University of Utah administrivia 2 feb 14-23 : proposal meetings march 7 : presentation topics due march 9 : proposals due march 27-april 3 : project updates april
Lecture 6 of 41. Scan Conversion 1 of 2: Midpoint Algorithm for Lines and Ellipses
 Scan Conversion 1 of 2: Midpoint Algorithm for Lines and Ellipses William H. Hsu Department of Computing and Information Sciences, KSU KSOL course pages: http://bit.ly/hgvxlh / http://bit.ly/evizre Public
Lecture 6 of 41. Scan Conversion 1 of 2: Midpoint Algorithm for Lines and Ellipses
 Scan Conversion 1 of 2: Midpoint Algorithm for Lines and Ellipses William H. Hsu Department of Computing and Information Sciences, KSU KSOL course pages: http://bit.ly/hgvxlh / http://bit.ly/evizre Public
Visual Encoding Design
 CSE 442 - Data Visualization Visual Encoding Design Jeffrey Heer University of Washington Last Time: Data & Image Models The Big Picture task questions, goals assumptions data physical data type conceptual
Data Visualization (CIS/DSC 468)
") Data Visualization (CIS/DSC 468) Tabular Data Dr. David Koop Channel Considerations Discriminability Separability Visual Popout Weber's Law Luminance Perception 2 Separability Cannot treat all channels
Data Visualization (CIS/DSC 468) Tabular Data Dr. David Koop Channel Considerations Discriminability Separability Visual Popout Weber's Law Luminance Perception 2 Separability Cannot treat all channels
Multivariate Data More Overview
 Multivariate Data More Overview CS 4460 - Information Visualization Jim Foley Last Revision August 2016 Some Key Concepts Quick Review Data Types Data Marks Basic Data Types N-Nominal (categorical) Equal
CS513-Data Mining. Lecture 2: Understanding the Data. Waheed Noor
 CS513-Data Mining Lecture 2: Understanding the Data Waheed Noor Computer Science and Information Technology, University of Balochistan, Quetta, Pakistan Waheed Noor (CS&IT, UoB, Quetta) CS513-Data Mining
Intro to R. Fall Fall 2017 CS130 - Intro to R 1
 Intro to R Fall 2017 Fall 2017 CS130 - Intro to R 1 Intro to R R is a language and environment that allows: Data management Graphs and tables Statistical analyses You will need: some basic statistics We
Designing Usable Apps
 This is a free sample excerpt from the book: Designing Usable Apps An agile approach to User Experience design Author: Kevin Matz 264 pages (softcover edition) Print edition ISBN: 978-0-9869109-0-6 E-book
Overview of 3D Object Representations
 Overview of 3D Object Representations Thomas Funkhouser Princeton University C0S 597D, Fall 2003 3D Object Representations What makes a good 3D object representation? Stanford and Hearn & Baker 1 3D Object
What is visualization? Why is it important?
 What is visualization? Why is it important? What does visualization do? What is the difference between scientific data and information data Cycle of Visualization Storage De noising/filtering Down sampling
Visualization Toolkit(VTK) Atul Kumar MD MMST PhD IRCAD-Taiwan
 Atul Kumar MD MMST PhD IRCAD-Taiwan") Visualization Toolkit(VTK) Atul Kumar MD MMST PhD IRCAD-Taiwan Visualization What is visualization?: Informally, it is the transformation of data or information into pictures.(scientific, Data, Information)
Visualization Toolkit(VTK) Atul Kumar MD MMST PhD IRCAD-Taiwan Visualization What is visualization?: Informally, it is the transformation of data or information into pictures.(scientific, Data, Information)
Computational Perception. Visual Coding 3
 Computational Perception 15-485/785 February 21, 2008 Visual Coding 3 A gap in the theory? - - + - - from Hubel, 1995 2 Eye anatomy from Hubel, 1995 Photoreceptors: rods (night vision) and cones (day vision)
Scalar Visualization
 Scalar Visualization 5-1 Motivation Visualizing scalar data is frequently encountered in science, engineering, and medicine, but also in daily life. Recalling from earlier, scalar datasets, or scalar fields,
Visualization Analysis & Design Full-Day Tutorial Session 1
 Visualization Analysis & Design Full-Day Tutorial Session 1 Tamara Munzner Department of Computer Science University of British Columbia Sanger Institute / European Bioinformatics Institute June 2014,
Data Mining. Part 1. Introduction. 1.3 Input. Fall Instructor: Dr. Masoud Yaghini. Input
 Data Mining Part 1. Introduction 1.3 Fall 2009 Instructor: Dr. Masoud Yaghini Outline Instances Attributes References Instances Instance: Instances Individual, independent example of the concept to be
DSC 201: Data Analysis & Visualization
 DSC 201: Data Analysis & Visualization Python and Notebooks Dr. David Koop Computer-based visualization systems provide visual representations of datasets designed to help people carry out tasks more effectively.
Color Vision. Spectral Distributions Various Light Sources
 Color Vision Light enters the eye Absorbed by cones Transmitted to brain Interpreted to perceive color Foundations of Vision Brian Wandell Spectral Distributions Various Light Sources Cones and Rods Cones:
DSC 201: Data Analysis & Visualization
 DSC 201: Data Analysis & Visualization Visualization Design Dr. David Koop Definition Computer-based visualization systems provide visual representations of datasets designed to help people carry out tasks
Intelligent Cutting of the Bird Shoulder Joint
 Intelligent Cutting of the Bird Shoulder Joint Ai-Ping Hu, Sergio Grullon, Debao Zhou, Jonathan Holmes, Wiley Holcombe, Wayne Daley and Gary McMurray Food Processing Technology Division, ATAS Laboratory,
Pre-Requisites: CS2510. NU Core Designations: AD
 DS4100: Data Collection, Integration and Analysis Teaches how to collect data from multiple sources and integrate them into consistent data sets. Explains how to use semi-automated and automated classification
Approaches to Visual Mappings
 Approaches to Visual Mappings CMPT 467/767 Visualization Torsten Möller Weiskopf/Machiraju/Möller Overview Effectiveness of mappings Mapping to positional quantities Mapping to shape Mapping to color Mapping
Week 6: Networks, Stories, Vis in the Newsroom
 Week 6: Networks, Stories, Vis in the Newsroom Tamara Munzner Department of Computer Science University of British Columbia JRNL 520H, Special Topics in Contemporary Journalism: Data Visualization Week
Neighbourhood Operations Specific Theory
 Neighbourhood Operations Specific Theory Neighbourhood operations are a method of analysing data in a GIS environment. They are especially important when a situation requires the analysis of relationships
Descriptive Statistics Descriptive statistics & pictorial representations of experimental data.
 Psychology 312: Lecture 7 Descriptive Statistics Slide #1 Descriptive Statistics Descriptive statistics & pictorial representations of experimental data. In this lecture we will discuss descriptive statistics.
Agile Mind Mathematics 6 Scope and Sequence, Indiana Academic Standards for Mathematics
 In the three years prior Grade 6, students acquired a strong foundation in numbers and operations, geometry, measurement, and data. Students are fluent in multiplication of multi-digit whole numbers and
Scientific Visualization. CSC 7443: Scientific Information Visualization
 Scientific Visualization Scientific Datasets Gaining insight into scientific data by representing the data by computer graphics Scientific data sources Computation Real material simulation/modeling (e.g.,
CPSC 535 Assignment 1: Introduction to Matlab and Octave
 CPSC 535 Assignment 1: Introduction to Matlab and Octave The goal of this assignment is to become familiar with Matlab and Octave as tools for scientific investigation. Matlab, a product of Mathworks,
Basic concepts and terms
 CHAPTER ONE Basic concepts and terms I. Key concepts Test usefulness Reliability Construct validity Authenticity Interactiveness Impact Practicality Assessment Measurement Test Evaluation Grading/marking
Course of study- Algebra Introduction: Algebra 1-2 is a course offered in the Mathematics Department. The course will be primarily taken by
 Course of study- Algebra 1-2 1. Introduction: Algebra 1-2 is a course offered in the Mathematics Department. The course will be primarily taken by students in Grades 9 and 10, but since all students must
Key Learning for Grade 3
 Key Learning for Grade 3 The Ontario Curriculum: Mathematics (2005) Number Sense and Numeration Read, represent, compare and order whole numbers to 1000, and use concrete materials to investigate fractions
Chapter 2: From Graphics to Visualization
 Exercises for Chapter 2: From Graphics to Visualization 1 EXERCISE 1 Consider the simple visualization example of plotting a graph of a two-variable scalar function z = f (x, y), which is discussed in
Data III & Integers I
 Data III & Integers I CSE 351 Spring 2017 Instructor: Ruth Anderson Teaching Assistants: Dylan Johnson Kevin Bi Linxing Preston Jiang Cody Ohlsen Yufang Sun Joshua Curtis Administrivia Everyone has VM
CS-5630 / CS-6630 Visualization for Data Science The Visualization Alphabet: Marks and Channels
 CS-5630 / CS-6630 Visualization for Data Science The Visualization Alphabet: Marks and Channels Alexander Lex alex@sci.utah.edu [xkcd] How can I visually represent two numbers, e.g., 4 and 8 Marks & Channels
Scalable Data Analysis (CIS )
") Scalable Data Analysis (CIS 602-01) Introduction Dr. David Koop NYC Taxi Data [Analyzing 1.1 Billion NYC Taxi and Uber Trips, with a Vengeance, T. W. Schneider] 2 What are your questions about this data?
Scalable Data Analysis (CIS 602-01) Introduction Dr. David Koop NYC Taxi Data [Analyzing 1.1 Billion NYC Taxi and Uber Trips, with a Vengeance, T. W. Schneider] 2 What are your questions about this data?
DATA ANALYSIS I. Types of Attributes Sparse, Incomplete, Inaccurate Data
 DATA ANALYSIS I Types of Attributes Sparse, Incomplete, Inaccurate Data Sources Bramer, M. (2013). Principles of data mining. Springer. [12-21] Witten, I. H., Frank, E. (2011). Data Mining: Practical machine
Knowledge Discovery and Data Mining
 Knowledge Discovery and Data Mining Unit # 2 Sajjad Haider Spring 2010 1 Structured vs. Non-Structured Data Most business databases contain structured data consisting of well-defined fields with numeric