Cartographic symbolization
|
|
|
- Natalie Little
- 5 years ago
- Views:
Transcription
1 Symbology
2 Cartographic symbolization Cartographic symbolization is based on a systematic approach for selecting the graphic symbols to use on a map Symbolization is the process of creating graphic symbols to represent feature attributes values


3 The four components of symbolization feature dimensionality + level of measurement + graphic + mark visual variables = symbolization mapping method
4 The four components of symbolization FEATURE REPRESENTATION ATTRIBUTE REPRESENTATION feature dimensionality + level of measurement + graphic + mark visual variables = ` symbolization mapping method
5 The four components of symbolization FEATURE ATTRIBUTE FEATURE REPRESENTATION ATTRIBUTE REPRESENTATION feature dimensionality + level of measurement + graphic + mark visual variables = ` symbolization mapping method
6 The four components of symbolization FEATURE ATTRIBUTE FEATURE REPRESENTATION ATTRIBUTE REPRESENTATION feature dimensionality + level of measurement + graphic + mark visual variables = ` symbolization mapping method
7 The four components of symbolization feature dimensionality + level of measurement + graphic + mark visual variables = symbolization mapping method
8 Symbolization requires 1. FEATURE Feature dimensionality -- conceptualizing the feature that is to be portrayed in terms of the extent of the phenomena 2. ATTRIBUTE Level of measurement -- selecting (and maybe changing) the level of measurement of the original data values
9 Four initial levels of measurement Nominal level -- class differences Ordinal level -- class differences and rank within class Interval level -- class differences and numerical values with an arbitrary zero value Ratio level -- class differences and numerical values with the zero value denoting absence of a feature
10 Reduced to Qualitative / Quantitative Nominal level = qualitative data / information Ordinal, interval, ratio level = quantitative or numerical data / information

")
11 Levels of measurement for cartography Nominal qualitative Ordinal, interval, ratio quantitative (numerical) Extensions not in this class
12 Feature dimensionality (the geographic FEATURE) 0 to 3 dimensions Point (0-D) Line (1-D) Area (2-D) Surface (2-½) Volume (3-D)

13 Feature dimensionality -> spatial data models Discrete phenomena Continuous phenomena Let s look at this from Jenks point of view
14
15
16
17

18

19
20
21 Graphic marks (feature representation) Point Line Polygon (Pixels, facets, etc.)

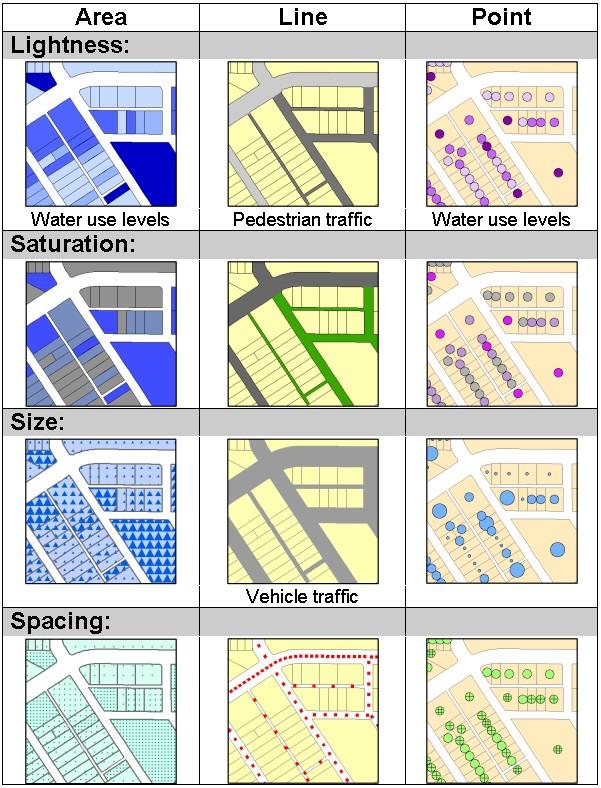
22 Visual variables
23 A reduction Qualitative Hue Orientation Shape Arrangement Quantitative Value (Lightness) Chroma (Saturation) Spacing (Texture) Size (includes Perspective Height)
24 Color variables Hue Value / lightness Saturation / chroma


25 Hue, value, saturation Hue is the most obvious characteristic of a color Saturation is the purity of a color High saturation colors look rich and full Low saturation colors look dull and grayish Sometimes saturation is called chroma Value is the lightness or darkness of a color Hue Chroma Value

26 Hue

27 Value


28 Size

29 Shape

30 Orientation of a point
31 Orientation of a polygon

32 Size Quantitative
33 Arrangement
34 The Symbol Selection Process Major factors underlying the symbol selection process Level of measurement of data describing each feature of information about the feature that we want to communicate to the map reader Spatial dimension point, line, area, surface, volume Graphic marks point, line, area, surface (pixels, facets, etc.) Visual variables for the different graphic marks for the different conceived spatial structures and for the different levels of measurement
35 Mapping Methods Choropleth maps Proportional symbol maps Isopleth maps Dot maps Dasymetric maps Prism maps Flow maps Cartograms

36

37

38
39


40

41

42

43
Geography 281 Map Making with GIS Project Three: Viewing Data Spatially
 Geography 281 Map Making with GIS Project Three: Viewing Data Spatially This activity introduces three of the most common thematic maps: Choropleth maps Dot density maps Graduated symbol maps You will
Class #2. Data Models: maps as models of reality, geographical and attribute measurement & vector and raster (and other) data structures
 data structures") Class #2 Data Models: maps as models of reality, geographical and attribute measurement & vector and raster (and other) data structures Role of a Data Model Levels of Data Model Abstraction GIS as Digital
Class #2 Data Models: maps as models of reality, geographical and attribute measurement & vector and raster (and other) data structures Role of a Data Model Levels of Data Model Abstraction GIS as Digital
Chapter 2: Understanding Data Distributions with Tables and Graphs
 Test Bank Chapter 2: Understanding Data with Tables and Graphs Multiple Choice 1. Which of the following would best depict nominal level data? a. pie chart b. line graph c. histogram d. polygon Ans: A
Frequency Distributions
 Displaying Data Frequency Distributions After collecting data, the first task for a researcher is to organize and summarize the data so that it is possible to get a general overview of the results. Remember,
SYMBOLISATION. Generalisation: which / how many features we display.. Symbolisation: how to display them?
 Generalisation: which / how many features we display.. Symbolisation: how to display them? SYMBOLISATION General Goal: easy and effective communication based on design principles and common sense as much
S. Rinzivillo DATA VISUALIZATION AND VISUAL ANALYTICS
 S. Rinzivillo rinzivillo@isti.cnr.it DATA VISUALIZATION AND VISUAL ANALYTICS Perception and Cognition vs Game #4 How many 3s? 1258965168765132168943213 5463479654321320354968413 2068798417184529529287149
Geography 222 Quantitative Color for GIS Mike Pesses, Antelope Valley College
 Geography 222 Quantitative Color for GIS Mike Pesses, Antelope Valley College Introduction Building off of the previous color theory work, a cartographer must also understand how to tell a story with data
SYMBOLISATION. Generalisation: which / how many features we display.. Symbolisation: how to display them?
 Generalisation: which / how many features we display.. Symbolisation: how to display them? SYMBOLISATION General Goal: easy and effective communication based on design principles and common sense as much
Last Time: Data and Image Models
 CS448B :: 2 Oct 2012 Visualization Design Last Time: Data and Image Models Jeffrey Heer Stanford University The Big Picture Nominal, Ordinal and Quantitative task questions & hypotheses intended audience
Introduction to Geospatial Analysis
 Introduction to Geospatial Analysis Introduction to Geospatial Analysis 1 Descriptive Statistics Descriptive statistics. 2 What and Why? Descriptive Statistics Quantitative description of data Why? Allow
STAT 1291: Data Science Lecture 4 - Data Visualization: Composing/dissecting Data Graphics Sungkyu Jung
 STAT 1291: Data Science Lecture 4 - Data Visualization: Composing/dissecting Data Graphics Sungkyu Jung Where are we? What is Data Science? How do we learn Data Science? Data visualization: What is a good
BUSINESS DECISION MAKING. Topic 1 Introduction to Statistical Thinking and Business Decision Making Process; Data Collection and Presentation
 BUSINESS DECISION MAKING Topic 1 Introduction to Statistical Thinking and Business Decision Making Process; Data Collection and Presentation (Chap 1 The Nature of Probability and Statistics) (Chap 2 Frequency
CS-5630 / CS-6630 Visualization for Data Science The Visualization Alphabet: Marks and Channels
 CS-5630 / CS-6630 Visualization for Data Science The Visualization Alphabet: Marks and Channels Alexander Lex alex@sci.utah.edu [xkcd] How can I visually represent two numbers, e.g., 4 and 8 Marks & Channels
Visualization Re-Design
 CS448B :: 28 Sep 2010 Visualization Re-Design Last Time: Data and Image Models Jeffrey Heer Stanford University The Big Picture Taxonomy task data physical type int, float, etc. abstract type nominal,
We will start at 2:05 pm! Thanks for coming early!
 We will start at 2:05 pm! Thanks for coming early! Yesterday Fundamental 1. Value of visualization 2. Design principles 3. Graphical perception Record Information Support Analytical Reasoning Communicate
Neighbourhood Operations Specific Theory
 Neighbourhood Operations Specific Theory Neighbourhood operations are a method of analysing data in a GIS environment. They are especially important when a situation requires the analysis of relationships
Beautifying GIS: A Refresher on Cartography. Christopher Morgan
 Beautifying GIS: A Refresher on Cartography Christopher Morgan Outline Message Audience Medium THEN Labels Symbology Colors Visual Hierarchy Your Message Reflect on what you re trying to convey Consider
Attribute Accuracy. Quantitative accuracy refers to the level of bias in estimating the values assigned such as estimated values of ph in a soil map.
 Attribute Accuracy Objectives (Entry) This basic concept of attribute accuracy has been introduced in the unit of quality and coverage. This unit will teach a basic technique to quantify the attribute
Chapter Two: Descriptive Methods 1/50
 Chapter Two: Descriptive Methods 1/50 2.1 Introduction 2/50 2.1 Introduction We previously said that descriptive statistics is made up of various techniques used to summarize the information contained
Data can be in the form of numbers, words, measurements, observations or even just descriptions of things.
 + What is Data? Data is a collection of facts. Data can be in the form of numbers, words, measurements, observations or even just descriptions of things. In most cases, data needs to be interpreted and
Review of Cartographic Data Types and Data Models
 Review of Cartographic Data Types and Data Models GIS Data Models Raster Versus Vector in GIS Analysis Fundamental element used to represent spatial features: Raster: pixel or grid cell. Vector: x,y coordinate
Organisation and Presentation of Data in Medical Research Dr K Saji.MD(Hom)
") Organisation and Presentation of Data in Medical Research Dr K Saji.MD(Hom) Any data collected by a research or reference also known as raw data are always in an unorganized form and need to be organized
Organisation and Presentation of Data in Medical Research Dr K Saji.MD(Hom) Any data collected by a research or reference also known as raw data are always in an unorganized form and need to be organized
The basic arrangement of numeric data is called an ARRAY. Array is the derived data from fundamental data Example :- To store marks of 50 student
 Organizing data Learning Outcome 1. make an array 2. divide the array into class intervals 3. describe the characteristics of a table 4. construct a frequency distribution table 5. constructing a composite
Homework # 4. Example: Age in years. Answer: Discrete, quantitative, ratio. a) Year that an event happened, e.g., 1917, 1950, 2000.
 Year that an event happened, e.g., 1917, 1950, 2000.") Homework # 4 1. Attribute Types Classify the following attributes as binary, discrete, or continuous. Further classify the attributes as qualitative (nominal or ordinal) or quantitative (interval or ratio).
Homework # 4 1. Attribute Types Classify the following attributes as binary, discrete, or continuous. Further classify the attributes as qualitative (nominal or ordinal) or quantitative (interval or ratio).
Key Terms. Symbology. Categorical attributes. Style. Layer file
 Key Terms Symbology Categorical attributes Style Layer file Review Questions POP-RANGE is a string field of the Cities feature class with the following entries: 0-9,999, 10,000-49,999, 50,000-99,000 This
Topic 3: GIS Models 10/2/2017. What is a Model? What is a GIS Model. Geography 38/42:477 Advanced Geomatics
 Geography 38/42:477 Advanced Geomatics Topic 3: GIS Models What is a Model? Simplified representation of real world Physical, Schematic, Mathematical Map GIS database Reduce complexity and help us understand
Session 3: Cartography in ArcGIS. Mapping population data
 Exercise 3: Cartography in ArcGIS Mapping population data Background GIS is well known for its ability to produce high quality maps. ArcGIS provides useful tools that allow you to do this. It is important
Visual Representation from Semiology of Graphics by J. Bertin
 Visual Representation from Semiology of Graphics by J. Bertin From a communication perspective Communication is too often taken for granted when it should be taken to pieces. (Fiske 91) Two basic schools
Applied Statistics for the Behavioral Sciences
 Applied Statistics for the Behavioral Sciences Chapter 2 Frequency Distributions and Graphs Chapter 2 Outline Organization of Data Simple Frequency Distributions Grouped Frequency Distributions Graphs
Understanding Geospatial Data Models
 Understanding Geospatial Data Models 1 A geospatial data model is a formal means of representing spatially referenced information. It is a simplified view of physical entities and a conceptualization of
B. Graphing Representation of Data
 B Graphing Representation of Data The second way of displaying data is by use of graphs Although such visual aids are even easier to read than tables, they often do not give the same detail It is essential
MAT 155. Chapter 1 Introduction to Statistics. sample. population. parameter. statistic
 MAT 155 Dr. Claude Moore Cape Fear Community College Chapter 1 Introduction to Statistics 1 1Review and Preview 1 2Statistical Thinking 1 3Types of Data 1 4Critical Thinking 1 5Collecting Sample Data Key
Approaches to Visual Mappings
 Approaches to Visual Mappings CMPT 467/767 Visualization Torsten Möller Weiskopf/Machiraju/Möller Overview Effectiveness of mappings Mapping to positional quantities Mapping to shape Mapping to color Mapping
West Linn-Wilsonville School District Mathematics Curriculum Content Standards Grades K-5. Kindergarten
 Mathematics Curriculum s Kindergarten K.1 Number and Operations and Algebra: Represent, compare, and order whole numbers, and join and separate sets. Read and write whole numbers to 10. Connect numbers,
statistical mapping outline
 sara irina fabrikant statistical mapping volumetric data outline volumetric data areas: choropleth classification to class or not to class? evaluate classification solution design issues legend color 2
Visual Encoding Design
 CSE 442 - Data Visualization Visual Encoding Design Jeffrey Heer University of Washington Last Time: Data & Image Models The Big Picture task questions, goals assumptions data physical data type conceptual
Courtesy :
 STATISTICS The Nature of Statistics Introduction Statistics is the science of data Statistics is the science of conducting studies to collect, organize, summarize, analyze, and draw conclusions from data.
Chapter 1 Introduction to Statistics
 Corresponds to ELEMENTARY STATISTICS USING THE TI 83/84 PLUS CALCULATOR 3rd ed. Lecture Slides Elementary Statistics Eleventh Edition and the Triola Statistics Series by Mario F. Triola Chapter 1 Introduction
COLOR HUE AS A VISUAL VARIABLE IN 3D INTERACTIVE MAPS
 COLOR HUE AS A VISUAL VARIABLE IN 3D INTERACTIVE MAPS Fosse, J. M., Veiga, L. A. K. and Sluter, C. R. Federal University of Paraná (UFPR) Brazil Phone: 55 (41) 3361-3153 Fax: 55 (41) 3361-3161 E-mail:
Trigonometric Ratios
 Geometry, Quarter 3, Unit 3.1 Trigonometric Ratios Overview Number of instructional days: 10 (1 day = 45 minutes) Content to be learned Make and defend conjectures to solve problems using trigonometric
Graphical Presentation for Statistical Data (Relevant to AAT Examination Paper 4: Business Economics and Financial Mathematics) Introduction
 Introduction") Graphical Presentation for Statistical Data (Relevant to AAT Examination Paper 4: Business Economics and Financial Mathematics) Y O Lam, SCOPE, City University of Hong Kong Introduction The most convenient
Graphical Presentation for Statistical Data (Relevant to AAT Examination Paper 4: Business Economics and Financial Mathematics) Y O Lam, SCOPE, City University of Hong Kong Introduction The most convenient
ArcCatalog or the ArcCatalog tab in ArcMap ArcCatalog or the ArcCatalog tab in ArcMap ArcCatalog or the ArcCatalog tab in ArcMap
 ArcGIS Procedures NUMBER OPERATION APPLICATION: TOOLBAR 1 Import interchange file to coverage 2 Create a new 3 Create a new feature dataset 4 Import Rasters into a 5 Import tables into a PROCEDURE Coverage
ABSTRACT INTRODUCTION
 VISULIZING RTOGRPHI GENERLIZTION Robert. McMaster and Howard Veregin epartment of Geography 414 Social Science uilding University of Minnesota Minneapolis, MN 55455 STRT Map generalization is a complicated
MATH 117 Statistical Methods for Management I Chapter Two
 Jubail University College MATH 117 Statistical Methods for Management I Chapter Two There are a wide variety of ways to summarize, organize, and present data: I. Tables 1. Distribution Table (Categorical
3D graphics, raster and colors CS312 Fall 2010
 Computer Graphics 3D graphics, raster and colors CS312 Fall 2010 Shift in CG Application Markets 1989-2000 2000 1989 3D Graphics Object description 3D graphics model Visualization 2D projection that simulates
DSC 201: Data Analysis & Visualization
 DSC 201: Data Analysis & Visualization Exploratory Data Analysis Dr. David Koop What is Exploratory Data Analysis? "Detective work" to summarize and explore datasets Includes: - Data acquisition and input
Visualization Stages, Sensory vs. Arbitrary symbols, Data Characteristics, Visualization Goals. Trajectory Reminder
 Visualization Stages, Sensory vs. Arbitrary symbols, Data Characteristics, Visualization Goals Russell M. Taylor II Slide 1 Trajectory Reminder Where we ve been recently Seen nm system that displays 2D-in-3D
Map Making Tutorial Jennifer Ailshire June 25, Adding Data to the Map and Saving the Map
 Map Making Tutorial Jennifer Ailshire June 25, 2008 Adding Data to the Map and Saving the Map Click on the Add Data button, browse to the appropriate directory and select the desired file(s). After you
LESSON 3: CENTRAL TENDENCY
 LESSON 3: CENTRAL TENDENCY Outline Arithmetic mean, median and mode Ungrouped data Grouped data Percentiles, fractiles, and quartiles Ungrouped data Grouped data 1 MEAN Mean is defined as follows: Sum
Figure 1: Workflow of object-based classification
 Technical Specifications Object Analyst Object Analyst is an add-on package for Geomatica that provides tools for segmentation, classification, and feature extraction. Object Analyst includes an all-in-one
Mathematics K-8 Content Standards
 Mathematics K-8 Content Standards Kindergarten K.1 Number and Operations and Algebra: Represent, compare, and order whole numbers, and join and separate sets. K.1.1 Read and write whole numbers to 10.
Guidance for the management and use of geospatial data and technologies in health
 Guidance for the management and use of geospatial data and technologies in health Part 2 - Implementing the geospatial data management cycle: 2.6 Distributing, using, and updating the data 2.6.1 Creating
Atmospheric Sciences
 GIS Tutorial for Atmospheric Sciences J. Greg Dobson, University of North Carolina at Asheville Jennifer Boehnert, National Center for Atmospheric Research 2015 UCAR and UNC-Asheville. This is an open
+ = Spatial Analysis of Raster Data. 2 =Fault in shale 3 = Fault in limestone 4 = no Fault, shale 5 = no Fault, limestone. 2 = fault 4 = no fault
 Spatial Analysis of Raster Data 0 0 1 1 0 0 1 1 1 0 1 1 1 1 1 1 2 4 4 4 2 4 5 5 4 2 4 4 4 2 5 5 4 4 2 4 5 4 3 5 4 4 4 2 5 5 5 3 + = 0 = shale 1 = limestone 2 = fault 4 = no fault 2 =Fault in shale 3 =
Enterprise Graphic Design
 Enterprise Graphic Design Courses Overview Color Theory Fundamentals of Design Visualization The Principles of Web Graphic Design Photography Consolidated (Photo Composition) Web Design with Adobe Photoshop
Announcements. Data Sources a list of data files and their sources, an example of what I am looking for:
 Data Announcements Data Sources a list of data files and their sources, an example of what I am looking for: Source Map of Bangor MEGIS NG911 road file for Bangor MEGIS Tax maps for Bangor City Hall, may
Unit Maps: Grade 7 Math
 Rational Number Representations and Operations 7.4 Number and operations. The student adds, subtracts, multiplies, and divides rationale numbers while solving problems and justifying solutions. Solving
Data Classification 1
 Data Classification 1 Data Classification The idea of classification is to group together items that are alike The objective of classification is to group data in such a manner that not only are the observations
Perception Maneesh Agrawala CS 448B: Visualization Fall 2017 Last Time: Exploratory Data Analysis
 Perception Maneesh Agrawala CS 448B: Visualization Fall 2017 Last Time: Exploratory Data Analysis 1 Will Burtin, 1951 How do the drugs compare? How do the bacteria group with respect to antibiotic resistance?
Section 2-2 Frequency Distributions. Copyright 2010, 2007, 2004 Pearson Education, Inc
 Section 2-2 Frequency Distributions Copyright 2010, 2007, 2004 Pearson Education, Inc. 2.1-1 Frequency Distribution Frequency Distribution (or Frequency Table) It shows how a data set is partitioned among
CIS 4930/6930 Spring 2014 Introduction to Data Science /Data Intensive Computing. University of Florida, CISE Department Prof.
 CIS 4930/6930 Spring 2014 Introduction to Data Science /Data Intensive Computing University of Florida, CISE Department Prof. Daisy Zhe Wang Data Visualization Value of Visualization Data And Image Models
Map Analysis of Raster Data I 3/8/2018
 Map Analysis of Raster Data I /8/8 Spatial Analysis of Raster Data What is Spatial Analysis? = shale = limestone 4 4 4 4 5 5 4 4 4 4 5 5 4 4 4 5 4 5 4 4 4 5 5 5 + = = fault =Fault in shale 4 = no fault
Downloaded from
 UNIT 2 WHAT IS STATISTICS? Researchers deal with a large amount of data and have to draw dependable conclusions on the basis of data collected for the purpose. Statistics help the researchers in making
Geographical Information Systems Institute. Center for Geographic Analysis, Harvard University. LAB EXERCISE 1: Basic Mapping in ArcMap
 Harvard University Introduction to ArcMap Geographical Information Systems Institute Center for Geographic Analysis, Harvard University LAB EXERCISE 1: Basic Mapping in ArcMap Individual files (lab instructions,
Graphic Display of Vector Object
 What is GIS? GIS stands for Geographic Information Systems, although the term Geographic Information Science is gaining popularity. A GIS is a software platform for storing, organizing, viewing, querying,
ArcGIS Desktop: Fundamentals of Cartography
 ArcGIS Desktop: Fundamentals of Cartography Outline Symbology Style Files -.style Layer files -.lyr Labeling Label Classes Label Expressions Map Document files -.mxd Map Template files -.mxt Map Elements
Lecture 2 Map design. Dr. Zhang Spring, 2017
 Lecture 2 Map design Dr. Zhang Spring, 2017 Model of the course Using and making maps Navigating GIS maps Map design Working with spatial data Geoprocessing Spatial data infrastructure Digitizing File
Interactive Math Glossary Terms and Definitions
 Terms and Definitions Absolute Value the magnitude of a number, or the distance from 0 on a real number line Addend any number or quantity being added addend + addend = sum Additive Property of Area the
Terms and definitions * keep definitions of processes and terms that may be useful for tests, assignments
 Lecture 1 Core of GIS Thematic layers Terms and definitions * keep definitions of processes and terms that may be useful for tests, assignments Lecture 2 What is GIS? Info: value added data Data to solve
Practical Image and Video Processing Using MATLAB
 Practical Image and Video Processing Using MATLAB Chapter 18 Feature extraction and representation What will we learn? What is feature extraction and why is it a critical step in most computer vision and
Basic concepts and terms
 CHAPTER ONE Basic concepts and terms I. Key concepts Test usefulness Reliability Construct validity Authenticity Interactiveness Impact Practicality Assessment Measurement Test Evaluation Grading/marking
Longley Chapter 3. Representations
 Longley Chapter 3 Digital Geographic Data Representation Geographic Data Type Data Models Representing Spatial and Temporal Data Attributes The Nature of Geographic Data Representations Are needed to convey
LECTURE 4: FEATURE EXTRACTION DR. OUIEM BCHIR
 LECTURE 4: FEATURE EXTRACTION DR. OUIEM BCHIR RGB COLOR HISTOGRAM HSV COLOR MOMENTS hsv_image = rgb2hsv(rgb_image) converts the RGB image to the equivalent HSV image. RGB is an m-by-n-by-3 image array
4. Basic Mapping Techniques
 4. Basic Mapping Techniques Mapping from (filtered) data to renderable representation Most important part of visualization Possible visual representations: Position Size Orientation Shape Brightness Color
Ms Nurazrin Jupri. Frequency Distributions
 Frequency Distributions Frequency Distributions After collecting data, the first task for a researcher is to organize and simplify the data so that it is possible to get a general overview of the results.
DSC 201: Data Analysis & Visualization
 DSC 201: Data Analysis & Visualization Visualization Design Dr. David Koop Definition Computer-based visualization systems provide visual representations of datasets designed to help people carry out tasks
03 Vector Graphics. Multimedia Systems. 2D and 3D Graphics, Transformations
 Multimedia Systems 03 Vector Graphics 2D and 3D Graphics, Transformations Imran Ihsan Assistant Professor, Department of Computer Science Air University, Islamabad, Pakistan www.imranihsan.com Lectures
Geographic Information Systems. using QGIS
 Geographic Information Systems using QGIS 1 - INTRODUCTION Generalities A GIS (Geographic Information System) consists of: -Computer hardware -Computer software - Digital Data Generalities GIS softwares
Example Videos. Administrative 1/26/2012. UNC-CH Comp/Phys/Mtsc 715. Vis 2006: ritter.avi. Vis2006: krueger.avi. Vis2011: Palke: ttg s.
 UNC-CH Comp/Phys/Mtsc 715 2D Scalar: Color, Contour, Height Fields, (Glyphs), Textures, and Transparency 2D Visualization Comp/Phys/Mtsc 715 Taylor 1 Example Videos Vis 2006: ritter.avi Displaying vascular
M. Andrea Rodríguez-Tastets. I Semester 2008
 M. -Tastets Universidad de Concepción,Chile andrea@udec.cl I Semester 2008 Outline refers to data with a location on the Earth s surface. Examples Census data Administrative boundaries of a country, state
Chapter 2 - Graphical Summaries of Data
 Chapter 2 - Graphical Summaries of Data Data recorded in the sequence in which they are collected and before they are processed or ranked are called raw data. Raw data is often difficult to make sense
Chapter 3: Data Mining:
 Chapter 3: Data Mining: 3.1 What is Data Mining? Data Mining is the process of automatically discovering useful information in large repository. Why do we need Data mining? Conventional database systems
Unit Maps: Grade 7 Math
 Rational Number Representations and Operations 7.4 Number and operations. The student adds, subtracts, multiplies, and divides rationale numbers while solving problems and justifying solutions. Solving
CSAP Achievement Levels Mathematics Grade 6 March, 2006
 Advanced Performance Level 4 (Score range: 589 to 830) Students demonstrate equivalency among fractions decimals, and percents; apply number sense; solve real-world problems using geometric and numeric
Predict Outcomes and Reveal Relationships in Categorical Data
 PASW Categories 18 Specifications Predict Outcomes and Reveal Relationships in Categorical Data Unleash the full potential of your data through predictive analysis, statistical learning, perceptual mapping,
Designing and Using Basemaps. Jennifer Hughey
 Designing and Using Basemaps Jennifer Hughey Agenda The ArcGIS System Basemaps are a key component of your system Cartographic design considerations Using basemap layers in ArcMap Best practices for designing
InfoVis: a semiotic perspective
 InfoVis: a semiotic perspective p based on Semiology of Graphics by J. Bertin Infovis is composed of Representation a mapping from raw data to a visible representation Presentation organizing this visible
CARTODB: VISUALIZE SPATIAL DATA ON THE WEB Thematic Mapping of Enschede socio-economic data
 CARTODB: VISUALIZE SPATIAL DATA ON THE WEB Thematic Mapping of Enschede socio-economic data Barend Köbben Version 2.1 [Enschede] November 7, 2014 Contents 1 The CartoDB web application 1 2 Mapping socio-economic
Chapter 2: Frequency Distributions
 Chapter 2: Frequency Distributions Chapter Outline 2.1 Introduction to Frequency Distributions 2.2 Frequency Distribution Tables Obtaining ΣX from a Frequency Distribution Table Proportions and Percentages
Example Videos. Administrative 1/28/2014. UNC-CH Comp/Phys/Apsc 715. Vis 2006: ritter.avi. Vis2006: krueger.avi
 UNC-CH Comp/Phys/Apsc 715 2D Scalar: Color, Contour, Height Fields, (Glyphs), Textures, and Transparency 2D Visualization Comp/Phys/Apsc 715 Taylor 1 Example Videos Vis 2006: ritter.avi Displaying vascular
To make sense of data, you can start by answering the following questions:
 Taken from the Introductory Biology 1, 181 lab manual, Biological Sciences, Copyright NCSU (with appreciation to Dr. Miriam Ferzli--author of this appendix of the lab manual). Appendix : Understanding
Data and Image Models
 CSE 512 - Data Visualization Data and Image Models Jeffrey Heer University of Washington Last Time: Value of Visualization The Value of Visualization Record information Blueprints, photographs, seismographs,
Marks. Marks can be classified according to the number of dimensions required for their representation: Zero: points. One: lines.
 Marks and channels Definitions Marks are basic geometric elements that depict items or links. Channels control the appearance of the marks. This way you can describe the design space of visual encodings
Data Statistics Population. Census Sample Correlation... Statistical & Practical Significance. Qualitative Data Discrete Data Continuous Data
 Data Statistics Population Census Sample Correlation... Voluntary Response Sample Statistical & Practical Significance Quantitative Data Qualitative Data Discrete Data Continuous Data Fewer vs Less Ratio
Digital Image Processing. Introduction
 Digital Image Processing Introduction Digital Image Definition An image can be defined as a twodimensional function f(x,y) x,y: Spatial coordinate F: the amplitude of any pair of coordinate x,y, which
2.1: Frequency Distributions
 2.1: Frequency Distributions Frequency Distribution: organization of data into groups called. A: Categorical Frequency Distribution used for and level qualitative data that can be put into categories.
UNIT 15 GRAPHICAL PRESENTATION OF DATA-I
 UNIT 15 GRAPHICAL PRESENTATION OF DATA-I Graphical Presentation of Data-I Structure 15.1 Introduction Objectives 15.2 Graphical Presentation 15.3 Types of Graphs Histogram Frequency Polygon Frequency Curve
University of Florida CISE department Gator Engineering. Visualization
 Visualization Dr. Sanjay Ranka Professor Computer and Information Science and Engineering University of Florida What is visualization? Visualization is the process of converting data (information) in to
Data Has Shape. Did you know? Data has Shape! Examples. My Data What do you think the shape of height data for this class looks like?
 L01 Data Has Shape Did you know? Data has Shape! Examples My Data What do you think the shape of height data for this class looks like? Data From you Calculate your height in inches From the shape of the
Information Visualization. Overview. What is Information Visualization? SMD157 Human-Computer Interaction Fall 2003
 INSTITUTIONEN FÖR SYSTEMTEKNIK LULEÅ TEKNISKA UNIVERSITET Information Visualization SMD157 Human-Computer Interaction Fall 2003 Dec-1-03 SMD157, Information Visualization 1 L Overview What is information