STRATEGIC INFORMATION AND BUSINESS INTELLIGENCE DASHBOARD AND REPORT PORTAL TRAINING
|
|
|
- Jody Wilcox
- 6 years ago
- Views:
Transcription
1 STRATEGIC INFORMATION AND BUSINESS INTELLIGENCE DASHBOARD AND REPORT PORTAL TRAINING CONTENTS: 1.0 IE Settings for Cognos Access 2.0 Cognos Login 3.0 Strategic Information and Business Intelligence Dashboard and Report Portal 4.0 Basic Excel functions 5.0 Helpful Information STRATEGIC INFORMATION AND BUSINESS INTELLIGENCE WRIGHT STATE UNIVERSITY

2 1.0 IE Settings for Cognos Access 1) Popup Blocker Settings Tools > Internet Options > Privacy a. Check the box Turn on Pop-up Blocker and click on Settings Note: Cognos also supports Firefox Web Browser to execute and view the reports. However, Chrome Web Browser support is limited in functionality 1

3 b. Type *.wright.edu in the Address of websites to allow: text box and click on Add button c. Click on Close button d. Click on Apply and OK button 2

4 2) Security settings Tools > Internet Options > Security a. Click Custom Level button 3

5 b. Scroll down till you reach the Downloads section c. Set Automatic prompting for file downloads to Enable. d. Click on OK button e. Click on OK button f. If IE version 9 or higher, you do not see Automatic prompting for file downloads option (to check IE version, go to Help and select About Internet Explorer 4


6 3) Scripting settings Tools > Internet Options > Security > Custom Level a. Continue to scroll down till you reach the Scripting section b. Set Allow Programmatic clipboard access to Enable c. Continue to scroll down a little and set Enable XSS filter to Disable d. Click on OK button e. Click on OK button 5

7 4) Compatibility settings Tools > compatibility view a. For IE version 9 and higher, select Compatibility View and make sure the check mark is on b. For IE version < 9, select Compatibility View Settings 6

8 c. Type wright.edu in the Add this website: and click on Add button d. Click on Close button 7
9 2.0 Cognos Login 1) Log into Cognos a. Open Internet Explorer (IE) browser and type in cognos.wright.edu in the address bar or click on COGNOS link under the Employee tab in Wings b. Type in your User ID (WID) and Password and click on OK 8

10 c. Click on My Home 9


11 d. Click on Dashboard and Report Portal Proposed Layout (Thoughts?) 10
 Current Reports Compare Reports Contact")
12 3.0 Dashboard and Report Portal Home Glossary Focus Areas Key Performance Indicators (KPI) Current Reports Compare Reports Contact Information 11
13 Dashboard and Report Portal (Best Known Practices) 1. Open Current Reports - Right mouse click and select Open in New Tab - Opens up the Active Report in a new tab. An additional tab will be opened. A click on the additional tab shows a dialog box asking Do you want to close the tab. Click on Yes and close the tab. 2. Open Compare Reports - Right mouse click and select Open in New Tab - Select the required prompts from the prompt page and click on Finish - A dialog box opens with options Open, Save, and Save As. You can choose any options but it is recommended to choose Save As option to save the report. An additional tab will be opened. Click on the additional tab shows a dialog box asking Do you want to close the tab. Click on Yes and close the tab 3. Open Cube - Right mouse click and select Open in New Tab - The Cube as a separate window. (Note: need additional license to access Cube). An additional Window IBM Cognos Software will be opened. Click on X and close the tab 12
14 Dashboard and Report Portal (Navigation) Current Reports Compare Reports 13


15 1) Current Reports Enrollment Student > Enrollment > Current Reports > University Level a. Click on Registered link to open Enrollment University Registered/Eligible Detail Report Filters Tabbed pane Drill-through Date & time CANNOT save the report 14

16 2) Current Reports Enrollment Student > Enrollment > Current Reports > University Level > Registered Selected values Additional details Date & time CAN save the report 15
17 3) Current Reports Enrollment Student > Enrollment > Current Reports > University Level > Graduate a. Click on Graduate link to open Enrollment Detail Report Selected values Additional details Date & time CAN save the report 16

18 4) Compare Reports Enrollment Student > Enrollment > Compare Reports > Registered/Eligible (Prompt Page) a. After selection, click on Finish button to open Enrollment Comparison Registered/Eligible Report Required prompts Optional prompts 17

19 5) Compare Reports Enrollment Student > Enrollment > Compare Reports > Registered/Eligible Selected values Comparison Date & time CAN save the report 18

20 6) Compare Reports Graduation (General) Student > Graduation (General and Cohort) > Compare Reports > Cube (General) Can download the report Filters User generated report Drill through CAN save the report Note: need advanced user license to access 19
21 7) Compare Reports Graduation by College (Cohort) Student > Graduation (General and Cohort) > Compare Reports > Graduation by College (Cohort) (Prompt Page) Required prompts Optional prompts 20
 Selected values Student movement Date & time CAN save the")
22 8) Compare Reports Graduation by College (Cohort) Student > Graduation (General and Cohort) > Compare Reports > Graduation by College (Cohort) Selected values Student movement Date & time CAN save the report 21
 c.")
23 4.0 Basic Excel Functions 1) Filter Data a. Right mouse click and highlight the header row b. On the Data tab, in the Sort & Filter group, click on the Filter icon. (Note drop down arrows appear in each column header and the Filter icon is highlighted) c. Selecting one or more variables from one or more column headers can filter your list to a select list of records that meet your filtering criteria d. To stop filtering, click the Filter icon. (Note the drop down arrows in each column header will disappear and the Filter icon will no longer be highlighted) 22


24 2) Sort data A. Remove Cognos report header and footers a. Select all of the rows that appear above the row the contains the column headers b. Right mouse click and click Delete c. Scroll to the bottom of your data file and select and delete any rows that appear below your data d. Right mouse click and click Delete Remove header Remove footer 23

25 e. On the Data tab, in the Sort & Filter group, click on the Sort icon. (Note a Sort dialogue box will open) f. In the Sort dialogue box select the column header you would like to sort by from the Sort by drop down box g. For the column you ve chosen, select the order you would like to sort the data from the Order drop down box h. Click OK 24
 d.")
26 3) Create PivotTable a. On the Insert tab, in the Tables group, click on the PivotTable icon to open PivotTable dialogue box b. In the Create PivotTable dialogue box, click OK. (Note a new worksheet will be created) d. In the new worksheet you can drag and drop your column headers in either Report Filter, Column Labels, Row Labels, or Values to view your data file in different ways 25
 c. Find a data file you want add to another file.")
27 4) Merge reports into one report a. Users can run the same report multiple times using different parameters. Each time the report is run, a new Excel file is created. These files can be combined into one Excel file. b. First, screen each data file (see pp above) c. Find a data file you want add to another file. In the Name Box, enter the range of cells that include all of the data, excluding the header row, and then hit the Enter key. Note all of the data in your first file, excluding the header row will be highlighted. 26
, scroll down to the last")
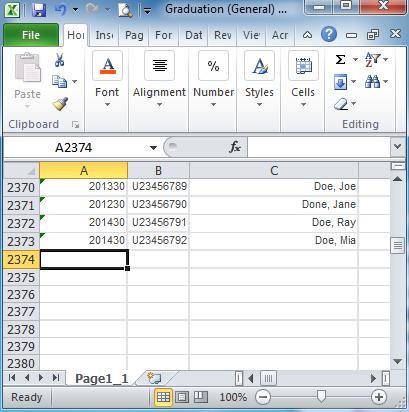
28 d. Right click and select Copy e. In the second data file (i.e., the one you want to add the data to), scroll down to the last row of data and select the next empty cell in column A f. Right click and select Paste 27
29 28
30 5.0 Helpful Information Cognos Access Request Form Cognos Support and Project Request Form Security Best Practices Contact Information: Computing and Telecommunications Services (CATS) 025 Library Annex Phone: Toll-free Number:
Navigate to Cognos Cognos Analytics supports all browsers with the exception of Microsoft Edge.
 IBM Cognos Analytics Create a List The following instructions cover how to create a list report in IBM Cognos Analytics. A list is a report type in Cognos that displays a series of data columns listing
The following instructions cover how to edit an existing report in IBM Cognos Analytics.
 IBM Cognos Analytics Edit a Report The following instructions cover how to edit an existing report in IBM Cognos Analytics. Navigate to Cognos Cognos Analytics supports all browsers with the exception
Creating Automated Dashboard Excel 2013 Contents
 Creating Automated Dashboard Excel 2013 Contents Summarize Data Using Pivot Table... 2 Constructing Report Summary... 2 Create a PivotTable from worksheet data... 2 Add fields to a PivotTable... 2 Grouping
How to Export a Report in Cognos Analytics
 IBM Cognos Analytics How to Export a Report in Cognos Analytics Reports viewed in IBM Cognos Analytics can be exported in many formats including Excel. Some of the steps for exporting are different depending
Admissions & Intro to Report Editing Participants Guide
 IBM Cognos Analytics Admissions & Intro to Report Editing Participants Guide Welcome to Cognos - Admissions and Introduction to Report Editing! Today s objectives include: Gain a Basic Understanding of
OBIEE. Oracle Business Intelligence Enterprise Edition. Rensselaer Business Intelligence Finance Author Training
 OBIEE Oracle Business Intelligence Enterprise Edition Rensselaer Business Intelligence Finance Author Training TABLE OF CONTENTS INTRODUCTION... 1 USER INTERFACE... 1 HOW TO LAUNCH OBIEE... 1 TERMINOLOGY...
IPEDS Human Resources Survey
 IPEDS Human Resources Survey - 2018 User Guide For Reports Version 5 November 2018 Table of Contents Overview... 3 Log in Procedure... 4 Running Reports... 6 Export Reports to Excel... 9 Drill Down to
EDITING AN EXISTING REPORT
 Report Writing in NMU Cognos Administrative Reporting 1 This guide assumes that you have had basic report writing training for Cognos. It is simple guide for the new upgrade. Basic usage of report running
Records and Enrollment Participants Guide
 IBM Cognos Analytics Welcome to Cognos Records and Enrollment Training! Today s objectives include: Gain a Basic Understanding of Cognos Understand University policies on data security including FERPA
Getting Started with IBM Cognos 10 Reports
 UNIVERSITY OF SUSSEX Getting Started with IBM Cognos 10 Reports ITS CIS 9/2/2015 Introduction to some of the features in the Cognos Connection reporting portal. Guides users through initial configuration
Introduction to Cognos Participants Guide. Table of Contents: Guided Instruction Overview of Welcome Screen 2
 IBM Cognos Analytics Welcome to Introduction to Cognos! Today s objectives include: Gain a Basic Understanding of Cognos View a Report Modify a Report View a Dashboard Request Access to Cognos Table of
OBIEE. Oracle Business Intelligence Enterprise Edition. Rensselaer Business Intelligence Admissions, Undergraduate
 OBIEE Oracle Business Intelligence Enterprise Edition Rensselaer Business Intelligence Admissions, Undergraduate TABLE OF CONTENTS INTRODUCTION... 1 USER INTERFACE... 1 HOW TO LAUNCH OBIEE... 1 HOW TO
Records and Enrollment Participants Guide
 IBM Cognos Analytics Welcome to Cognos Records and Enrollment Training! Today s objectives include: Understand University policies on data security including FERPA Understand which package/report to use
1. Right-click the worksheet tab you want to rename. The worksheet menu appears. 2. Select Rename.
 Excel 2010 Worksheet Basics Introduction Page 1 Every Excel workbook contains at least one or more worksheets. If you are working with a large amount of related data, you can use worksheets to help organize
Discoverer Viewer. User Manual. for SDS
 Discoverer Viewer User Manual for SDS saskatchewan.ca 2017 Table of Contents Introduction... 3 How to Get Started... 3 Logging In... 3 First Time Logging In Preferences Changes... 4 Worksheet List... 5
Navigate to Cognos Cognos Analytics supports all browsers with the exception of Microsoft Edge.
 IBM Cognos Analytics Create a Crosstab The following instructions cover how to create a crosstab report in IBM Cognos Analytics. A crosstab is a report type in Cognos that displays an analytical look at
OBIEE. Oracle Business Intelligence Enterprise Edition. Rensselaer Business Intelligence Position Control
 OBIEE Oracle Business Intelligence Enterprise Edition Rensselaer Business Intelligence Position Control TABLE OF CONTENTS INTRODUCTION... 1 USER INTERFACE... 1 HOW TO LAUNCH OBIEE... 1 HOW TO NAVIGATE...
An Introduction to Google Chrome
 An Introduction to Google Chrome Box is an online file sharing and cloud content management service and it provides features such as: Getting Google Chrome 1. To get started with Google Chrome, you have
Sort, Filter, Pivot Table
 Sort, Filter, Pivot Table Sort A common database task is to rearrange the information based on a header/field or headers/fields. This is called Sorting or Filtering. Sorting rearranges all of the information
Website Administration Manual, Part One
 Website Administration Manual, Part One A Guide to the CMS & Widgets Curry School of Education Website http://curry.virginia.edu The Curry Website Administrators Manual - Part One 2 The CMS The content
This quick reference guide is designed for consumers of the Program Dashboard and provides details on how to: Log in
 This quick reference guide is designed for consumers of the Program Dashboard and provides details on how to: Log in Filter data using input controls Access the Dashboard Access Collibra/ Definitions Glossary
Insert Subtotals in Excel and Link Data to a Word Document
 CHAPTER 1 Integrated Projects More Skills 11 Insert Subtotals in Excel and Link Data to a Word Document In Excel, summary statistics such as totals and averages can be calculated for groups of data by
User Guide. Web Intelligence Rich Client. Business Objects 4.1
 User Guide Web Intelligence Rich Client Business Objects 4.1 2 P a g e Web Intelligence 4.1 User Guide Web Intelligence 4.1 User Guide Contents Getting Started in Web Intelligence 4.1... 5 Log into EDDIE...
Using Edusoft and Excel to Extract SLO Data for the BPSD Growth Target Calculator Spreadsheet by Granger Meador
 Using Edusoft and Excel to Extract SLO Data for the BPSD Growth Target Calculator Spreadsheet by Granger Meador CREATING AND GIVING PRE-TEST: 1. Create separate assessment(s) in Edusoft for your pre-test
Student Manual. Cognos Analytics
 Student Manual Cognos Analytics Add a Prompt to a Filter Add a prompt to a filter to add interactivity to the report. Prompts allow you to change filter criteria when the report is run. NAVIGATION: My
INSTRUCTOR SELF SERVICE USER GUIDE
 INSTRUCTOR SELF SERVICE USER GUIDE Page 1 of 38 Instructor Self Service Table of Contents Introduction... 3 Overview... 3 Access... 3 Sign in to Bear Tracks... 4 General Navigation... 6 Menu Navigation...
CatPlan End User Guide
 CatPlan End User Guide 10/9/2017 1 P age Table of Contents Supported Browsers...3 Logging in to CatPlan...3 Running Reports...5 Viewing Dashboards...8 Entering Data via Forms... 10 10/9/2017 2 P age Supported
To complete this workbook, you will need the following file:
 CHAPTER 4 Excel More Skills 13 Create PivotTable Reports A PivotTable report is an interactive, cross-tabulated Excel report used to summarize and analyze data. PivotTable reports are used to ask questions
PIVOT TABLES IN MICROSOFT EXCEL 2016
 PIVOT TABLES IN MICROSOFT EXCEL 2016 A pivot table is a powerful tool that allows you to take a long list of data and transform it into a more compact and readable table. In the process, the tool allows
Frequency tables Create a new Frequency Table
 Frequency tables Create a new Frequency Table Contents FREQUENCY TABLES CREATE A NEW FREQUENCY TABLE... 1 Results Table... 2 Calculate Descriptive Statistics for Frequency Tables... 6 Transfer Results
Ministry of Education
 Ministry of Education EFIS 2.0 - User Version 2.0 June 2015 Table of Contents 1 Document History... 4 2 Logon to EFIS 2.0... 5 2.1 Logon through Go Secure... 5 2.2 Bookmarking the Link... 6 3 Planning
View the Advisor Case Load Self Service Report
 IBM Cognos Analytics View the Advisor Case Load Self Service Report The Advisor Case Load Self Service report will give you information about the students in your case load. The following is a guide on
EFIS User Guide Family Support Programs User
 Ministry of Education EFIS 2.0 - User Guide Family Support Programs User Version 2.0 June 2015 Table of Contents 1 Document History... 1 2 Logon to EFIS 2.0... 2 2.1 Logon through Go Secure... 2 2.2 Bookmarking
MicroStrategy reporting uses a browser-independent web interface that includes features like:
 INTRODUCTION TO BUSINESS INTELLIGENCE Business Intelligence (BI) uses methodologies, processes, architectures, and technologies that transform raw data into meaningful and useful information used to enable
eschoolplus+ General Information Training Guide Version 2.4
 eschoolplus+ General Information Training Guide Version 2.4 August 2013 Arkansas Public School Computer Network This page is intentionally left blank 8/23/2013 Page 2 of 29 Table of Contents eschoolplus
Contents. Group 2 Excel Handouts 2010
 Contents Styles... 2 Conditional Formatting... 2 Create a New Rule... 4 Format as Table... 5 Create your own New Table Style... 8 Cell Styles... 9 New Cell Style... 10 Merge Styles... 10 Sparklines...
Excel Tables and Pivot Tables
 A) Why use a table in the first place a. Easy to filter and sort if you only sort or filter by one item b. Automatically fills formulas down c. Can easily add a totals row d. Easy formatting with preformatted
Excel Tables & PivotTables
 Excel Tables & PivotTables A PivotTable is a tool that is used to summarize and reorganize data from an Excel spreadsheet. PivotTables are very useful where there is a lot of data that to analyze. PivotTables
Argos Creating Labels with Word
 Argos Creating Labels with Word This document explains how create mailing labels using Argos. For information about Argos, refer to the document, Argos for Typical Users. There are two (2) basic steps
Working with Data in Microsoft Excel 2010
 Working with Data in Microsoft Excel 2010 This document provides instructions for using the sorting and filtering features in Microsoft Excel, as well as working with multiple worksheets in the same workbook
Service Line Export and Pivot Table Report (Windows Excel 2010)
") Service Line Export and Pivot Table Report (Windows Excel 2010) In this tutorial, we will take the Service Lines of the Active Students only and only the most recent record to take a snapshot look at approximate
Service Line Export and Pivot Table Report (Windows Excel 2010) In this tutorial, we will take the Service Lines of the Active Students only and only the most recent record to take a snapshot look at approximate
Labour Market Programs Support. System. Position Description Questionnaire. Computer Compatibility Guide
 System Labour Market Programs Support Position Description Questionnaire Computer Compatibility Guide Table of Contents 1. Introduction... 1 1.1 PDQ Overview... 1 1.2 Document Purpose... 1 1.3 Computer
A guide to reporting in evision. Version 3.8
 A guide to reporting in evision Version 3.8 Table of Contents Table of Contents 1 Introduction... 4 1.1 Intended Audience... 4 1.2 Pre-requisites... 4 1.3 Objectives... 4 1.4 Conventions... 4 2 Accessing
An Introduction to Oracle Business Intelligence
 Table of Contents Introduction... 2 What is OBI...2 What is a Dashboard?...2 Accessing OBI... 3 Viewing Data via Dashboards... 4 Using Favorites... 5 Filtering Data... 6 Changing the way data is displayed...
Marquette University Time and Attendance
 2016 Marquette University Time and Attendance TM01 Student Employee Time and Attendance This guide helps you learn the most commonly used student employee functions in EmpCenter Time and Attendance. The
Microsoft Excel Pivot Tables & Pivot Table Charts
 Microsoft Excel 2013 Pivot Tables & Pivot Table Charts A pivot table report allows you to analyze and summarize a million rows of data in Excel 2013 without entering a single formula. Pivot Tables let
UNIT ONE: The Worksheet. Workbook Window Excel Worksheet Fill handle Automatic fill Column widths Opening a file Saving a file
 UNIT ONE: The Worksheet T o p i c s : Workbook Window Excel Worksheet Fill handle Automatic fill Column widths Opening a file Saving a file I. Start Excel: 1. Click the Start button in the lower-left corner
SPREADSHEET (Excel 2007)
") SPREADSHEET (Excel 2007) 1 U N I T 0 4 BY I F T I K H A R H U S S A I N B A B U R Spreadsheet Microsoft Office Excel 2007 (or Excel) is a computer program used to enter, analyze, and present quantitative
SPREADSHEET (Excel 2007) 1 U N I T 0 4 BY I F T I K H A R H U S S A I N B A B U R Spreadsheet Microsoft Office Excel 2007 (or Excel) is a computer program used to enter, analyze, and present quantitative
Lesson 19 Organizing and Enhancing Worksheets
 Organizing and Enhancing Worksheets Computer Literacy BASICS: A Comprehensive Guide to IC 3, 5 th Edition 1 Objectives Hide, show, and freeze columns and rows. Create, rename, and delete worksheets. Change
COGNOS Multiple Queries
 COGNOS Multiple Queries In Cognos Report Studio, it is possible to include multiple queries on a report. In the Applicants report below, we will add a query for Admissions information. Page 1 of 21 Follow
ADVANCED INQUIRIES IN ALBEDO: PART 2 EXCEL DATA PROCESSING INSTRUCTIONS
 ADVANCED INQUIRIES IN ALBEDO: PART 2 EXCEL DATA PROCESSING INSTRUCTIONS Once you have downloaded a MODIS subset, there are a few steps you must take before you begin analyzing the data. Directions for
Logging in from Home. Follow these steps:
 Accessing from outside the PeaceHealth network Logging in from Home Quick Tips for a successful access! You must have administrator privileges on the computer you are using to be able to install the required
Wesleyan University. PeopleSoft - Configuring Web Browser Settings
 PeopleSoft - Configuring Web Browser Settings In order to use the PeopleSoft applications, your web browser must be configured to allow certain settings related to popups, security and clearing your cache.
StudentTracker for High Schools Making the Data Local
 StudentTracker for High Schools Making the Data Local Presented by Joshua Leake-Campbell, StudentTracker Specialist 2013 National Student Clearinghouse. All Rights Reserved. Today s Agenda What is StudentTracker?
Up-To-Date Class Rosters can be accessed through the My UW Madison portal in the Faculty Center
 INSTRUCTOR ACCESS TO CLASS ROSTERS Up-To-Date Class Rosters can be accessed through the My UW Madison portal http://my.wisc.edu in the Faculty Center You will use your NetID and Password to access My UW
INSERT SUBTOTALS Database Exercise Sort the Data Department Department Data Tab Sort and Filter Group
 INSERT SUBTOTALS Subtotals are used to summarize data in a range of data. This command offers many kinds of summary information, including counts, sums, averages, minimums, and maximums. When this feature
Business Warehouse reports Running and manipulating reports. Newcastle University Andy Proctor 9 th March 2017
 Business Warehouse reports Running and manipulating reports Newcastle University Andy Proctor 9 th March 2017 Table of Contents Running a business warehouse report... 2 Adding a characteristic... 4 Drag
More Skills 12 Create Web Queries and Clear Hyperlinks
 CHAPTER 9 Excel More Skills 12 Create Web Queries and Clear Hyperlinks Web queries are requests that are sent to web pages to retrieve and display data in Excel workbooks. Web queries work best when retrieving
Scorebook Navigator. Stage 1 Independent Review User Manual Version
 Scorebook Navigator Stage 1 Independent Review User Manual Version 11.2013 TABLE OF CONTENTS Getting Started... 1 Browser Requirements... 1 Scorebook Navigator Browser Compatability... 1 Logging in...
Using Modules in Canvas
 Using Modules in Canvas Modules in Canvas are used to organize the course content. Each module can contain files, discussions, assignments, quizzes, and other learning materials. Modules are especially
Quick Guide to TIDE: Adding Users and Students
 Quick Guide to TIDE: Adding Users and Students Test Coordinators use TIDE to add and manage user accounts and to add students participating in the South Carolina Alternate Assessment. This Quick Guide
Importing from Blackboard Learn Grade Center Data to Banner 9 User Learning Scenarios
 Importing from Blackboard Learn Grade Center Data to Banner 9 User Learning Scenarios Step 1: Make sure Final Grade Column Displays Letter Grade Ensure your final grade column in Grade Center has letter
Visual Analytics User s Guide
 Visual Analytics User s Guide Question Page How do I log on to the system? 2 How do I navigate the reports? 3 How do I view an object that does not fit on the screen? 3 How do I change the column width
KASBO Fall 2014 Session 4T Excel for Munis Accounts Payable and Purchase Orders (Lab) Presenter: Sheila Miller, KDE Business Analyst
 Presenter: Sheila Miller, KDE Business Analyst") KASBO Fall 2014 Session 4T Excel for Munis Accounts Payable and Purchase Orders (Lab) Presenter: Sheila Miller, KDE Business Analyst Session Prerequisites 1. You will be accessing Munis so make sure you
KASBO Fall 2014 Session 4T Excel for Munis Accounts Payable and Purchase Orders (Lab) Presenter: Sheila Miller, KDE Business Analyst Session Prerequisites 1. You will be accessing Munis so make sure you
1 Course Tallies and Lists with Designations
 1 Course Tallies and Lists with Designations 1.1 Quick Reports The following Quick Reports are available to assist with looking at class composition: Course Requests by Course with Designations: Build
A Brief Introduction to the ProClarity Enrollment Reports
 ACCESS TO THE REPORTS First Step: Open the recommended browser, Internet Explorer, go to the Compatibility View Settings on the Tools menu & select the Display all websites in Compatibility View checkbox.
Mathematical Operators for Excel
 EXCEL ADVANCED 1 Mathematical Operators for Excel < > = >=
ADMINISTRATOR USER GUIDE NYC REPORTING TOOL
 NYC REPORTING TOOL An Online Business Intelligence Tool for School Administrators to Access Achievement Data at the Board, School and Student Level ADMINISTRATOR USER GUIDE December 2008 T A B L E O F
PowerScheduler Course Tally Worksheet instructions.
 PowerScheduler Course Tally Worksheet instructions. This document will describe the process of copying course request information from PowerSchool into an Excel Course Tally Worksheet. Once the information
What s New in Cognos. Cognos Analytics Participant s Guide
 What s New in Cognos Cognos Analytics Participant s Guide Welcome to What s New in Cognos! Illinois State University has undergone a version upgrade of IBM Cognos to Cognos Analytics. All functionality
Tivoli Common Reporting V Cognos report in a Tivoli Integrated Portal dashboard
 Tivoli Common Reporting V2.1.1 Cognos report in a Tivoli Integrated Portal dashboard Preethi C Mohan IBM India Ltd. India Software Labs, Bangalore +91 80 40255077 preethi.mohan@in.ibm.com Copyright IBM
COMMISSION OF TEXAS MAY
 GIS Viewer RAILROAD COMMISSION OF TEXAS MAY 2017 Table of Contents GIS Viewer Basics... 1 Basics... 1 Screen Overview... 2 Tools... 5 Visibility... 5 Measure Tool... 7 Identify Tool... 10 Coordinates Tool...
Overlap Checker & ENC Coverage User Manual
 Overlap Checker & ENC Coverage User Manual Document date: 01.01.2015 Contents Introduction... 3 Access to the VPN Check Overlap Candidates... 3 Coverage... 7 Copyright 2015 ECC AS Page 2 Introduction Overlap
CalPlan. Creating a Unit Plan Navigating CalPlan Workbook 1/25/18
 CalPlan Creating a Unit Plan Workbook 1/25/18 Table of Contents Exercise 1: Log into the Workspace & Run a CalPlan Report... 3 Exercise 2: Launching CalPlan and Setting Your Entity... 10 Exercise 3: Actualized
San Diego Unified School District AT0001-Good Attendance Means Everything
 HOW TO LOGIN TO COGNOS Open Internet Explorer. Type https://cognos.sandi.net as the location. Press the enter key. Type your employee id into the text box next to the words Employee ID. Press the tab key.
Dashboard 8.0. User Guide
 Dashboard 8.0 User Guide Table of Contents Dashboard User Reference Guide Table of Contents...2 Basic Navigation...3 Content Section...3 Filter Frame...4 Table Types...5 The Drilling Process...6 The Metric
User's Manual FOR USING UPDATE PACKAGES
 User's Manual FOR USING UPDATE PACKAGES Page 1/11 INDEX 1 FOREWORD... 3 2 SETTINGS TO ENABLE THE POP-UPS... 5 2.1 If you have Chrome... 5 2.1 If you have Firefox... 7 2.2 If you have Internet Explorer...
Cognos Consumer Navigation Guide
 College of Charleston Cognos Consumer Navigation Guide The How-to Guide for Cognos 10.2 users at the College of Charleston Mary L. Person 7/5/2016 Table of Contents I. Accessing Cognos... 4 MyCharleston...
Managing Document Properties
 PROCEDURES LESSON 20: CHANGING CASE AND MANAGING DOCUMENT PROPERTIES Using Uppercase Mode 1 Press the Caps Lock key 2 Type the desired text in all caps Showing Caps Lock on the Status Bar 1 Right-click
Join Queries in Cognos Analytics Reporting
 Join Queries in Cognos Analytics Reporting Business Intelligence Cross-Join Error A join is a relationship between a field in one query and a field of the same data type in another query. If a report includes
Microsoft How to Series
 Microsoft How to Series Getting Started with EXCEL 2007 A B C D E F Tabs Introduction to the Excel 2007 Interface The Excel 2007 Interface is comprised of several elements, with four main parts: Office
Armatus 2.0 Administrator Procedures
 2015 Armatus 2.0 Administrator Procedures Praesidium 2015. All rights reserved. Armatus 2.0 Administrator Procedures Overview Introduction This guide shows you how to perform tasks in Armatus 2.0 Administrator
Training Quick Steps Internet Explorer (v7) Settings. Adding Your URL as a Trusted Site
 Settings. Adding Your URL as a Trusted Site") Adding Your URL as a Trusted Site In order to access PrognoCIS, you must add your URL as a Trusted Site, which will enable the Security Certificate to allow you to access the secured web site. Refer to
Adding Your URL as a Trusted Site In order to access PrognoCIS, you must add your URL as a Trusted Site, which will enable the Security Certificate to allow you to access the secured web site. Refer to
IBM Cognos Analytics 11 Report User Training Scheduling Reports Job Aid
 IBM Cognos Analytics 11 Report User Training Scheduling Reports Job Aid In this Scheduling Reports Cheat Sheet, we review how to schedule a report to run one time, as well as how to setup a reoccurring
Data. Selecting Data. Sorting Data
 1 of 1 Data Selecting Data To select a large range of cells: Click on the first cell in the area you want to select Scroll down to the last cell and hold down the Shift key while you click on it. This
GETTING STARTED. A Step-by-Step Guide to Using MarketSight
 GETTING STARTED A Step-by-Step Guide to Using MarketSight Analyze any dataset Run crosstabs Test statistical significance Create charts and dashboards Share results online Introduction MarketSight is a
Pivot Tables in Excel Contents. Updated 5/19/2016
 Pivot Tables in Excel 2010 Updated 5/19/2016 Contents Setup a Pivot Table in Excel 2010... 2 General Field List Features... 4 Summing and Counting Together... 6 Grouping Date Data... 7 Grouping Non-Date
Excel 2013 Next Steps
 Excel 2013 Next Steps ADULT SERVICES DEPARTMENT CRYSTAL LAKE PUBLIC LIBRARY 126 W. PADDOCK STREET CRYSTAL LAKE, IL 60014 815-459-1687, X7 WWW.CLPL.ORG Agenda 2 Home Toolbar Alignment Group Number Formats
3. Click the Change Case button. 4. On the menu, click the desired case option. Managing Document Properties
 PROCEDURES LESSON 20: CHANGING CASE AND MANAGING DOCUMENT PROPERTIES Using Uppercase Mode 1 Press the Caps Lock key 2 Type the desired text in all caps Showing Caps Lock on the Status Bar 1 Right-click
Enter your Appserv username and password to sign in to the Website
 Appserv Desktop Access Logging on from a Windows 10 Device Step 1. To sign in to the Appserv Desktop Access website, either enter the following address into the Microsoft Edge browser address bar, or click
Data Grid Utilities - Searching Data Grids
 Data Grid Utilities - Searching Data Grids Step 1 : To search any column on selected data grids begin by right mouse-clicking the column header for the column you want to search. This feature works on
Shopping Cart: Queries, Personalizations, Filters, and Settings
 Shopping Cart: Queries, Personalizations, Filters, and Settings on the Shopping Cart Home Page Use this Job Aid to: Learn how to organize the Shopping Cart home page so that it is easier to use. BEFORE
Excel 2013 Part 2. 2) Creating Different Charts
 Creating Different Charts") Excel 2013 Part 2 1) Create a Chart (review) Open Budget.xlsx from Documents folder. Then highlight the range from C5 to L8. Click on the Insert Tab on the Ribbon. From the Charts click on the dialogue
Excel 2013 Part 2 1) Create a Chart (review) Open Budget.xlsx from Documents folder. Then highlight the range from C5 to L8. Click on the Insert Tab on the Ribbon. From the Charts click on the dialogue
NC User Conference Tips and Tricks for SAS FM June 16, 2009
 NC User Conference Tips and Tricks for SAS FM June 16, 2009 Reporting 1. CDA Formula (Formatted Statement): To switch out the cell reference for the hardcoded member or dim name, you can go into the formula
MS Office 2016 Excel Pivot Tables - notes
 Introduction Why You Should Use a Pivot Table: Organize your data by aggregating the rows into interesting and useful views. Calculate and sum data quickly. Great for finding typos. Create a Pivot Table
Microsoft Excel Lab: Data Analysis
 1 Microsoft Excel Lab: The purpose of this lab is to prepare the student to use Excel as a tool for analyzing data taken in other courses. The example used here comes from a Freshman physics lab with measurements
Microsoft Office Excel 2010: Basic. Course Overview. Course Length: 1 Day. Course Overview
 Microsoft Office Excel 2010: Basic Course Length: 1 Day Course Overview This course teaches the basic functions and features of Excel 2010. After an introduction to spreadsheet terminology and Excel's
Candy is Dandy Project (Project #12)
") Candy is Dandy Project (Project #12) You have been hired to conduct some market research about M&M's. First, you had your team purchase 4 large bags and the results are given for the contents of those
Candy is Dandy Project (Project #12) You have been hired to conduct some market research about M&M's. First, you had your team purchase 4 large bags and the results are given for the contents of those
Excel Level Three. You can also go the Format, Column, Width menu to enter the new width of the column.
 Introduction Excel Level Three This workshop shows you how to change column and rows, insert and delete columns and rows, how and what to print, and setting up to print your documents. Contents Introduction
Connecture Platform Manager
 Connecture Platform Manager 1 P a g e Table of Contents Connecture Platform Manager... 1 Introduction to the Connecture Platform Manager... 3 Getting Started... 3 Login... 3 Dashboard... 3 Connecture Application