How to Define and Use Qapp
|
|
|
- Roderick White
- 5 years ago
- Views:
Transcription
1 How to Define and Use Qapp Updated on June 12, 2015 Prepared by: NetBrain Technologies Inc.
2 Table of Contents 1. INTRODUCTION CREATE YOUR FIRST QAPP Create a new Qapp Define Device Input Define Canvas to retrieve and parse data Define analysis and Alert Save and Run Qapp Summary of Monitor Qapp PARSERS AND VARIABLE Basic Variables and keyword Parser Define Integer variable in Keyword parser Analyze an Integer Variable Paragraph Parser Analyze variables parsed by Paragraph Parser Table Parser Analyze variables parsed by Table Parser Filter Parser Add a child parser for Filter Parser Analyze data parsed by Filter Parser Add Multiple CLI Commands in a Qapp DEFINE ANALYSIS AND ALERT Monitor and Display Variables in Qmap Monitor Device Level Variables Monitor Interface Level Variables Data Chart Define Alert for Variables Basic Alert Change Analysis Alert (Delta) Flapping Alert Advanced Alert Edit and Disable/Enable alert Define Alert for String Variables Use Compound Condition to Monitor Items... 57
3 4.3.1 Merge Display Positions of Multiple Variables Into One Monitor Qapp Execution GENERAL QAPP View Components of a General Qapp Create a General Qapp Define Device Input Define Canvas to retrieve and parse data Analyze Variables and Define Output Save and Run General Qapp Define Advanced Output General Qapp Settings Add Multiple Action Nodes in one Output USING GENERAL QAPP FOR DYNAMIC MAPPING Check Configuration Compliances Create a map for devices with unencrypted passwords Run Change management to fix the issue Map Network Design USING QAPP FOR CHANGE CHECK AND DELTA ANALYSIS Define Loop for Delta Operator Define Delta Operator Define Delta Analysis and Output USING GENERAL QAPP FOR DYNAMIC DOCUMENTATION Create CSV Files for Variables Export Variables to a Global Data Table by Convert Operator Define Action Node to export GDT in CSV file Set Customized Fields USING GENERAL QAPP FOR NEIGHBOR CHECK Build Device Pair in Device Queue Retrieve MTU data of this device Retrieve MTU data of nbr device Neighbor Join Define Analysis and Output for Neighbor Check TROUBLESHOOT CONNECTION PROBLEMS VIA QAPP Ping Command Define Ping Parameters Define Variables and Parser Define ping result analysis and output
4 10.2 Traceroute Command Define Variables and Parser Define Traceroute result analysis and output SNMP Command and Merge Table Operator SNMP Command Merge Table MULTIPLE CANVAS EXECUTION FLOW AND LOOP CONTROL Filter out Devices configured with OSPF Protocol Canvas Execution Flow Call Variables in Global Data Table CANVAS BLOCK AND DIALOGUE Create a Dialog Dialogue Control Components Dialogue Control Push Variable Value to Dialogue Analysis and Output Based on Selection in Dialog USING PREDEFINED TABLES TO ANALYZE NETWORK PROBLEMS Understanding Built-in Data table Use and Analyze Predefined Data Table in Qapp USING QAPP TO ANALYZE DATA OF IMPORTED TABLE Define Table input Define Variables and Parser for Imported Data Analyze Table Data USING QAPP IN MULTI-VENDOR ENVIRONMENT Set Branch Conditions for Different Device Types (Vendors) Define Different Commands for Different Device Types (Vendors) QAPP MANAGEMENT Degug Qapp Qapp Task Management Qapp Recommendation APPENDIX 1. NETBRAIN BUILT-IN VARIABLES APPENDIX 2. NETBRAIN BUILT-IN FUNCTIONS Global functions: General Functions PyMac Member Functions PyIP Member Functions PyInterface Member Functions
5 2.5 PyDevice Member Functions PyTable Member Functions Device/Interface/Module Property attributes Device type ID and name APPENDIX 3 BRIEF INTRODUCTION OF PYTHON SCRIPTING Setting up the Python Environment Python Programming Basics If Conditions Basic Regular Expressions APPENDIX 4 TABLE OPERATORS APPENDIX 5 COMMAND TYPES
6 1. Introduction Troubleshooting a network problem is a challenging task. Each network is different, each problem is different, and the skill set and experience of the engineer involved in a troubleshooting process is different. However, the standard procedures can be followed for many types of network problems. The generic troubleshooting process consists of the following tasks: (1) Define the problem (2) Gather the data (3) Analyze and monitor the data (4) Eliminate the possible problem causes (5) Find the root cause of the problem Many books and papers have been written to analyze the typical actions and decisions that are taken during each of these processes and how these could be planned and implemented via the troubleshooting procedures. However, these procedures are static and the process to gather, analyze and monitor data is still a manual process, which is time-consuming and error-prone. NetBrain Qapps are designed to automate these processes and improve troubleshooting efficiency. The NetBrain Qapp is a standalone application which can be executed from inside the NetBrain Workstation. A Qapp can include the following components: (1) Description of the network problem or best practice (2) Methods to gather the data (parser) (3) The analysis of the data (4) Display the data in the map with the hotspot highlighted (5) Output of possible errors or warnings (6) Create the maps and/or the documents for the results The NetBrain Workstation provides a GUI to create Qapps quickly so that a user without any programming background can write a Qapp. After a Qapp is created, it can be run in any NetBrain Workstation against any network. A well-built Qapp can automatically gather and analyze data. Besides troubleshooting network problems, Qapps can also be used to: (1) Create a map (2) Confirm network compliance or network health (3) Create a customized report 1

7 Qapp General Workflow This document provides detailed instructions to create and run Qapps. You do not need any programming or script background to follow this document. However, it assumes that you are familiar with the NetBrain Workstation. Please send any questions or comments on NetBrain Qapp or this document to 2
 CPU usage in a map. A builtin Qapp, Overall Health Monitor, has implemented the same function via SNMP.")
8 2. Create your first Qapp In this chapter you will create your first Qapp (Qapp1) and learn the basic concepts of a Qapp. We will start with a simple use case: monitor device (Cisco Devices) CPU usage in a map. A builtin Qapp, Overall Health Monitor, has implemented the same function via SNMP. However, we are going to use the CLI command to retrieve the CPU usage. 2.1 Create a new Qapp Click the Qapp tab in your workstation, and then click the New Qapp button within Qapp Operation ribbon. The New Qapp window opens. In the New Qapp window, besides a General Qapp, there are five pre-installed templates for commonly used Qapp -Monitor, Inventory Report, Path Analysis, Highlight Map and Neighbor Check. Click any template to view description about it. Based on any one of these templates, you could create a Qapp rapidly by just modifying some parameters. In the pre-installed Qapp template, Monitor could actually help to finish the task monitor the device CPU usage wonderfully and easily. But to better understand every elements of a Qapp, we select the General Qapp and build our target Qapp step by step. 3
, keyword, author and contact information for this")
 Define the way by which the Qapp obtains devices at execution time in Input block (2) Retrieve and parse data from")
9 Double-click General Qapp or Click General Qapp (Default) OK to open Qapp Editor window. The General Qapp has two blocks-input and Canvas by default. You could click Qapp description icon on the upper left corner and enter a description (such as This Qapp is to monitor a device health by CPU usage), keyword, author and contact information for this Qapp. In the right pane of the description, click Import button to import a sample Qmap or picture to present the Qapp s function Define Device Input To create a monitor Qamp, it typically takes three steps: (1) Define the way by which the Qapp obtains devices at execution time in Input block (2) Retrieve and parse data from the live network in Command of Canvas block (3) Define analysis for the data and output results in Output of Canvas block 4

10 In this step, we handle the Input block that is mainly used to define the way by which the Qapp get devices to run at execution time. There are four types of device imput and you could set input devices based on your actual needs. Here, we leave the device input as default: Device Group with Auto option selected, meaning that the Qapp takes all devices visible in the map and run on thses devices as a group Note: (1) Besides Device Input, Qapp also supports Table Input. It could parse and analyze the data in an imported table and output analysis results. Table Input will be introduced in detail in the chapter Using Qapp to Analyze Data of Imported Table (2) About detailed introduction to Device Input, please refer to Chapter 5 General Qapp Define Canvas to retrieve and parse data In this step, we will introduce the Canvas, a block mainly used to retrieve, parse and analyze data from the live network. Double-click Canvas block to enter Canvas editing window. 5

11 There are five nodes in the Canvas of a general Qapp by default. From left to right, the first node is Device Queue, followed by Device Selector (this), CLI Command, Table and Output. These nodes are logically connected with direction, we need to edit them by this order. (1) Device Queue: Device Queue exists in a form of table and its rows are devices or device interfaces waiting for Qapp to run on. By default, the devices in Device Queue are inherited from devices defined in Input Block and will be referenced by its downstream node- Device Selector By default the device queue includes only one device column (this). However, it can also include a pair of devices, the device (this) and its neighbors (nbr), which will be covered in later section. Since it is unnecessary to include interfaces or neighbors of a device to monitor a device s CPU usage, here we leave the option as default One device per Queue. 6

12 (2) Device Selector: as its name indicates, it is used to select which column (this or its neighbor column if "a pair of device per queue" is enabled)) in its upstream Device Queue table will be run on by the Qapp. By Device Selector, you could also define different CLI commands based on different device vendors or different types from one same vendor, which is very useful to run a Qapp on multi-vendor environment (see the chapter "Using Qapp in Multi-vendor environment" for details) Since we have selected the option One device per Queue in the upstream node, there is only option this here. Just leave this option as default. (3) CLI Command: CLI Command is used to define how to retrieve data of a device and rules to parser the retrieved data. (a) Enter the CLI command show process cpu in command field. (b) Retrieve the sample output. Click the Retrieve Sample button and select a Cisco IOS device. The sample output is shown as follows: 7

13 BJ*POP#show process cpu CPU utilization for five seconds: 11%/7%; one minute: 8%; five minutes: 8% PID Runtime(ms) Invoked usecs 5Sec 1Min 5Min TTY Process % 0.01% 0.00% 0 OSPF Router % 0.43% 0.28% 0 Check heaps % 0.00% 0.00% 0 Pool Manager (c) Define the parser To retrieve the CPU usage data for 1 minute, highlight the value of one minute CPU usage (8% for this sample output) and click the Define Variable option. The keyword Parser window opens with the following fields: Sample: the line matching the value highlighted. Parser: defining keywords and where a variable lies. Here the system automatically creates a keyword parser: minute: $percent:var1; five This keyword parser contains the keywords minute: and ; five which always stay same and a variable $var1 which varies in different devices. A variable always starts with $. By default a variable is a string. To set it as the other type such as int or percent, define it as $<type>:<variable name>, for example, $percent:var1. The parser minute: $percent:var1; five asks the system to find the keyword minute: and assigns the word between minute: and ; five to the variable $var1. In the sample, $var1 is set to the value 8%. Variable: displaying the variables defined in the parser. Quite often you want to change the system auto created variable name such as $var1 to a more meaningful name such as $cpu_1m. To do so, just replace var1 with cpu1_1m. You can edit the variable name here and the system will modify the parser to cooperate your 8
 Highlight the value to be exactly what you want to retrieve and do not include the spaces before and after this value.")
14 change. Result table: displaying the variable, value and type. Click the Save Parser button to save this parser. Hint: (a) Highlight the value to be exactly what you want to retrieve and do not include the spaces before and after this value. For example, if you highlight 5% (the space before this value is also selected), the system will create a parser as follows: regex[$var1]:one minute\:(.+?); five (b) You could also define parser manually to retrieve the variable by Keyword parser (Pattern: one minute: $cpu_1m%;) in the right Define Parser pane. (c) After saving parsers, if you want to modify a variable, you could right-click the variable in the right Define Parser pane and select Edit to modify the variable manually. Similarly you can define the keyword parser for five-minute CPU usage. Highlight the value of 5- minute CPU usage (8% for this sample output) and click the Define Variable option. 9
 Export Retrieved Data: Click the sign to export the variable data retrieved in CLI Command node to the downstream Table node for subsequent analysis.")
 Table: The table node is used to store the data parsed from a device for further analysis.")
15 The system automatically creates a keyword parser: minutes: $percent:var1$ Here $ is a special keyword meaning the end of line. Change the variable name to a meaningful name, $cpu_5m. (4) Export Retrieved Data: Click the sign to export the variable data retrieved in CLI Command node to the downstream Table node for subsequent analysis. (a) Select the variable that you are interested in. (b) Click the export arrow to export the selected variable (c) Click Apply button to finish variable exporting. (5) Table: The table node is used to store the data parsed from a device for further analysis. Clicking this node, you will find that all variables and their sample values that you have exported in the upstream node are listed. 10


16 2.1.3 Define analysis and Alert Through the above two steps, we have obtained the required data for the devices that we are interested in. In this step, based on the data, we will define analysis and output analysis results for the data. Analysis and Alert are defined in Output node. In a General Qapp, its default output type is Basic Output which does not match our monitor task. Delete this default Output node and create a Monitor output node by the following process: Hover mouse pointer on Table icon, drag right as the mouse pointer changes to hand sign, release your mouse and then we select Monitor option in the menu. Note: Monitor Qapp runs periodically, analyzes retrieved data and shows real-time results on map, including live performance data and alert, and Monitor output should be used for this type of Qapp. For a general Qapp, it run one time and therefore retrieve data one time, and Basic Output is used for this type of Qapp. Click the created Output node and the Output editing window will show as follows: 11

 such as an interface status, input error or output error, etc. By default all variables are not displayed in the map.")
17 All variables defined in Table node are displayed in the left pane Select items to monitor. In this case there are two variables, cpu_1m and cpu_5m. Click the variable that you are interested in and click export arrow to export it to Device Items under Monitor items table. Note: there are two options under Monitor items table : Device Items and Interface Items. Device Items is used to import device-level variable (item) such as a device s cpu usage, version number, etc. Interface Items is used to interface-level variable (item) such as an interface status, input error or output error, etc. By default all variables are not displayed in the map. To display the variable in the map, select the variable cpu_1m in Monitor items table, click drop-down menu of Position, select Device Position 1, click Apply button and you will see that the position column of cpu_1m changes to 1. Click the icon to view how the positions of these variables are displayed on a map. 12


18 Similarly select Device Position 2 for the variable cpu_5m. By default all CLI commands of a monitor Qapp are executed every 2 minutes. This frequency can be modified while a Qapp is run. You can modify the default frequency in the Qapp Frequency field on the upper right corner. Now, click Save button to save the Qapp 2.2 Save and Run Qapp After clicking Save button, Save as window will pop up. meaningful name My First Qapp. In the File Name field, enter a Click the option button of Location and select a location for the Qapp. two types of locations: You can add a Qapp to (1) Qapp Center: Built-in Files: contain NetBrain built-in Qapps and we do not recommend modifying any built-in Qapp. Shared Files: contain Qapps shared through NetBrain server. My Files: contain Qapps only accessible by you. (2) Local Disk: save the Qapp to your local computer 13
 to map out a few Cisco IOS devices or open a Qmap.")
19 (a) Here we save to My Files under Qapp Center and click OK to close the location window. (b) Click the drop-down menu of save as type and select Monitor Qapp File (c) Click Save to finish the Qapp. Create a new Qmap (Qmap1) to map out a few Cisco IOS devices or open a Qmap. In the floating menu, click Monitor, select Monitor Qapps and then Monitor window opens and check My First Qapp in the window. 14

20 Click Next, the window will skip to Step 2-Define Input for Monitor. You could click the Frequency button and set Qapp running frequency. Under Device Input tab, you will see that the Qapp has automatically get the devices in the current map. Click Next button and then click Run button in the popped window to run the Qapp. The map turns into monitoring mode. The variables cpu_1m and cpu_2m with their corresponding values are displayed in the specified locations and are refreshed every 2 minutes or according to the frequency you define. The current device or interface data is also displayed as the table format in the left pane under the Qmap. Select a data to view its historical data chart. The chart shows how the variable changes with the time. The time scale can be changed to to Last, 5 minutes, 30 minutes, 1 hour, 6 hours, 12 hours or 1 day. Click the Raw Data link to view the original CLI output. 15


21 The floating Qapp control shows how long the Qapp has been running. Click the Stop button to pause running the Qapp and the Clear button to clear all monitoring data in the map. 2.3 Summary of Monitor Qapp You have successfully created and run the first monitor Qapp, congratulations! Before we move on to create more useful Qapps, let us summarize the Qapp components illustrated in the following figure. A basic Monitor Qapp includes two components: Input and Canvas. The Input defines ways that a Qapp will use to get devices at run time and the Canvas mainly defines the CLI commands used to retrieve the data from the live network, the variables and how the variables are retrieved from the command (Parser) as well as how to display the variables in the map and create alerts when Variables meet certain conditions. Note: (1) A Qapp can include more than one canvas, which will be covered in the Chapter Multiple Canvas Execution Flow and Loop Control. For now you can think that a Qapp has only one canvas. (2) Besides CLI commands, a Canvas can also include other types of commands, such as Configuration commands, etc. 16
22 3. Parsers and Variable The variables are the smallest units of a Qapp. As we have learned at Chapter 2, the variables are defined in the CLI Command and analyzed in the Output node. In this chapter we will learn the different types of variables and how to define them in parsers of CLI command. In Chapter 4, we cover how to analyze the variables. 3.1 Basic Variables and keyword Parser There are several types of basic variables: String, Integer (natural numbers), Double (floating number), Boolean, IP, MAC and Percent. A string variable starts with $ and can be defined via a Keyword parser, <keyword1> $<stringvariablename><keyword2>, such as for $var1 second where for is keyword1, second is keyword2 and var1 is variable. The substring between the keyword1 and keyword2 is set to be the value of $<stringvariablename>. Variable type Description Definition Examples String Can be any string. $var1 V13.1(12a) Integer The natural number $int:var2 0, 1, 2, Double The floating number $double:var Boolean True or false $bool:var4 True, False IP The IP address $IP:var MAC The MAC address $MAC:var6 0019:B585:ACF3 Percent The Percentage $percent:var7 80% Select the value of a variable and click the Define Variable option, NetBrain will set the variable type according to its format. The variable will be defined as $<type>:<name>, where <name> is the variable name and the $<type> is the variable type. For example, if you select to define the variable, NetBrain will set the variable type as IP address- $IP:var1 ; if you select 255 to define the variable, NetBrain will set the variable type as int- $int:var1 In case you want to modify its type set by NetBrain, please manually modify value of <type>. For example, to define an integer variable named cpu for the CPU usage, you need to define it as $int:cpu, as the default type percent cannot be used to in threshold analysis currently. 17
 in the Parser Tree to edit it.")

23 3.1.1 Define Integer variable in Keyword parser To modify the Qapp created earlier, in Qapp Center, right-click the Qapp and select Edit option to open it. Go to CLI Command node in Canvas and double click a variable (or right click and select Edit ) in the Parser Tree to edit it. Since we need to compare the CPU usage against an integer value such as 90, the variables should be defined as an integer type instead of the default string. To do so, modify the pattern as follows: minute: $int:cpu_1m%; five Click the Apply button and confirm that the correct value is retrieved. Here the variable $int:cpu_1m is defined as an integer. You could see in the Parser Tree that the value has changed into an integer and the type has changed into int. 18


24 Instead of editing a variable, you can also delete the old variable and define a new one. Right click the variable cpu_1m in the Procedure Variable tree and select the Delete option to delete it. Highlight the 1-minute CPU usage (number 5 in the sample output; Do not include the space before this number) and click the Define Variable option. The system recognizes the variables is an integer and automatically creates the following parser: minute: $int:var1%; five Change the variable name var1 to be cpu_1m. Click the Save Parser button to save it. Note: After deleting an old variable, you need to re-export variable to the downstream Table node and define variable in the Output node if you give a different name to the new variable. 19

25 3.1.2 Analyze an Integer Variable Under the Output node, Click Create Alert tab and you will see that the variables you have defined in Select Data are listed. Select a variable such as $cpu_1m in the Device Items and you can define an alert related to this variable in the right pane. An alert can be an error or a warning. Check the checkbox Enable for Error and select an operator from the drop-down menu of Select Analysis. There are 4 operators and under each operator there are corresponding judging conditions (The operator types vary based on different variable types, here the variable type is integer). (1) Basic ==,!=, >, >=, <, <=: comparing the variable current value ([now]) against a threshold value. For example, select >= operator and enter 90 as default value for the variable cpu_1m and this means that 1-minute CPU usage is higher than 90%. In range, out of range: checking whether a variable is in or out of a range. For example, we can define a warning alert if the variable cpu_1m is in range of [80,90], which means that its value is equal or greater than 80 AND less than 90%. (2) Delta ==,!=, >, >=, <, <=: comparing the delta value against a threshold. The delta value is the difference between the current value ([now]) and the value in the last polling cycle ([last]). For example, you can use these operators to check whether the interface CRC errors increase with time, which may indicate a bad cable connection. In range, out of range: checking whether the delta value is in or out of a range. (3) Flapping Is flapping: checking whether a variable is flapping. (4) Advance: Advanced: writing the complex conditions if the above scenario does not satisfy your purpose. 20
![For each error or warning condition, you can create an alert message and/or a device note. Here let us select Basic operator and define an Error condition for the variable $cpu_1m as [now] >= 90.](/docs-images/89/99262880/images/26-0.jpg "Check the checkbox of Alert Message and enter an alert message Device is extremely busy! for this condition.")
26 For each error or warning condition, you can create an alert message and/or a device note. Here let us select Basic operator and define an Error condition for the variable $cpu_1m as [now] >= 90. Check the checkbox of Alert Message and enter an alert message Device is extremely busy! for this condition. We also define a warning condition as [now] in range [80,90) and create an alert message High CPU. Additionally, you could also tick the checkbox of Show as Device Note on map and the Qapp will draw a device note attached to problem devices on map if conditions set are reached. Save the modified Qapp and run it on a Qmap. In the step 2 of Run Monitor, click Threshold hyperlink and change threshold value for analysis. For demo s purpose, let us change values of conditions as follow: $cpu1_1m >= 6 and $$cpu_1m In range [4, 6]. The following is a sample result. The $cpu_1m of the device BJ*POP is highlighted in red and a device note is added to BJ*POP since the variable value of $cpu1 is 10, bigger than the threshold value of 6. And For device BJ_core_3550, the $cpu_1m is highlighted in yellow and device note is added to Bos-Core1-Tr since its cpu_1m is 5, in range of (4,6). The number appended to a device icon is the number of alert messages created for this device. 21

 In the right pane, click Device Color tab and select item(s) which will lead to the change of device color. You could select multiple items.")
27 Click the Alert tag at the bottom of the left pane to view all alert messages. The count is the number of times this alert message has been created. You can acknowledge or delete the alert message. Here, you may find that when a condition set is met, only the variable item, such as CPU_1m, turns red, while the device color will not change. If you want to make the device color change as a variable item of the device meets the error or warning condition, you could do as follows: (1) In Output node, click Create Alert tab and then click Device Items in the left pane. (2) In the right pane, click Device Color tab and select item(s) which will lead to the change of device color. You could select multiple items. If Reachability is selected, a device will turn red if the Qapp fails to ping the device at run time. 3.2 Paragraph Parser So far, we have only used the Keyword parser to define basic variables. The Keyword parser is useful for cases in which the data to be retrieved has a single instance, such as the device CPU usage. Often the CLI command output contains multiple instances of data, for example, interface data and CDP table. To retrieve multiple instances of data, we need to define Paragraph parser or Table parser. In this section we are going to create a Qapp to monitor a device s interface status and CLI command show interface will be used to retrieve interface data. In this case, we are going to parser interface data retrieved via Paragraph Parser. The Table Parser will be covered in the next section. 22


28 Click New Qapp in Qapp Operation ribbon under Qapp tab. This time, we use the Netbrain pre-installed Qapp template- Monitor to create this Qapp, so double click Monitor template to enter Monitor Qapp editing window. Under Execution Flow tab, three is a Loop block between Input and Canvas block and this indicates that the Canvas block will be looped periodically to get the real-time data. You could click it to set frequency time for the Qapp to refresh its data. Leave the Device Input setting as default and double-click Canvas block to enter Canvas editing window. In Canvas block, the nodes will be run by this order: Device Queue this (device selector) 23
29 CLI Command Table Output. A node depends on settings or data of its upstream to keep itself working properly, so set these nodes by this order. (1) Click Device Queue and here leave it as default since it is meaningless to include neighbor devices or device interfaces to run the command show interface. (2) Click This (Device Selector) node, this option is selected by default. Here just leave it as default. (3) In CLI command node, we are going to use show interface to monitor different errors occurring in an interface. Click the Retrieve Sample button and select a Cisco IOS device. The output like the following will appear: Bos-Core1-Tr>show interface Vlan1 is up, line protocol is up Hardware is EtherSVI, address is (bia ) MTU 1500 bytes, BW Kbit, DLY 10 usec, reliability 255/255, txload 1/255, rxload 1/255 Encapsulation ARPA, loopback not set Keepalive not supported ARP type: ARPA, ARP Timeout 04:00:00 Last input never, output never, output hang never Last clearing of "show interface" counters never Input queue: 0/75/0/0 (size/max/drops/flushes); Total output drops: 0 Queueing strategy: fifo Output queue: 0/40 (size/max) 5 minute input rate 0 bits/sec, 0 packets/sec 5 minute output rate 0 bits/sec, 0 packets/sec 0 packets input, 0 bytes, 0 no buffer Received 0 broadcasts (0 IP multicasts) 0 runts, 0 giants, 0 throttles 0 input errors, 0 CRC, 0 frame, 0 overrun, 0 ignored 0 packets output, 0 bytes, 0 underruns 0 output errors, 2 interface resets 0 output buffer failures, 0 output buffers swapped out Vlan10 is up, line protocol is up Hardware is EtherSVI, address is (bia ) Internet address is /24 MTU 1500 bytes, BW Kbit, DLY 10 usec, reliability 255/255, txload 1/255, rxload 1/255 Encapsulation ARPA, loopback not set Keepalive not supported ARP type: ARPA, ARP Timeout 04:00:00 Last input 00:00:00, output 00:00:00, output hang never 24


30 Last clearing of "show interface" counters never Input queue: 2/75/0/0 (size/max/drops/flushes); Total output drops: 0 Queueing strategy: fifo The sample output includes multiple interfaces. The output of each interface has identical formatting, beginning with is, line protocol is For the information of every interface, it is like an independent paragraph and for this type of output, Paragraph parser is used. Highlight the value you are interested in, such as 0 before input errors and click the Define Variable option. The keyword Parser window opens. The system automatically creates a keyword parser and finds 58 matched lines for this sample output as displayed under the Sample field. To view the matched lines, click the arrow key next to the Sample field. The sample lines not only include the lines related to the input errors but also the input packets. This can be fixed by modifying the Parser to $int:var1 input errors (adding errors at end of the auto-created parsers). Notice that the number of samples is smaller (31 in this sample output). For a sample output matching a keyword parser multiple times, often you need to define the Paragraph Parser by clicking the link Define Variables Under Paragraphs. The Paragraph Parser window opens, where you can set the Paragraph Identifier and define more Keyword Parsers. 25

31 The Paragraph Identifier is the keyword parser to identify the start of a new paragraph. Highlight the partial start line of each paragraph, Vlan10 is up, line protocol and click the Set Paragraph Identifier option. The selected context is copied to the Paragraph Identifier field. This line includes the keywords which are always same and the sample values which can change. Keep the keywords and replace the sample values with the variable name and so we end up with the following Paragraph Identifier: $name is $status, line protocol is Press the enter key or click the Refresh icon to apply the change. 26

32 The variables and sample values are displayed as a table. The headers are the names of basic variables. Each column of the table is an array of the basic variables. Each row of the table corresponds to a paragraph of CLI command output. To define more variables, highlight the value in the Sample (for example, 0 before output errors ) and select the Define Variable option. To avoid confusion, sometimes you need to modify the auto created keyword parser such as adding errors at the end. Also it is always a good practice to change the variable names $var1 and $var2 to something more meaningful such as $input_err and $output_err. 27

. Click Table node and check the variables and value exported.")
33 Click the Save Variable button. You could see that the parsed variables and their values are listed in the right pane. Click Export, select a variable in the left pane, export the selected variable to the table in the middle pane, and then click Apply. You will see that all exported variables and their values are listed in the table of the right pane (The variables and variable values list here are the same as those in the table of Table node and you could see them as preview data of Table node). Click Table node and check the variables and value exported. Based on data retrieved and parsed, we are going to analyze the data and output analysis results. 28


34 3.2.1 Analyze variables parsed by Paragraph Parser In Output node, you will see all variables listed under Select Data tab. Since these variables items are all about an interface, here we need to export these variables under Interface Items of Monitor items table. Select one variable such as input_err, then click Interface Items and click export arrow button. The Set Key Variable window opens up asking you to select the interface name variable. This interface name variable will be used as the key to find other variables associated with an interface so that the variables can be correctly displayed in the map. So select the variable name here and the variable $name is marked with the key icon Hint: to modify the key variable, just right-click the variable that you want to set as a key and select the option Set as Inteface Index. 29

35 Add variables to monitor items table one by one and then click to set display postions for these variables in a map (Do not forget to click Apply finishing a setting). For example, select Interface Position 1 for status, Interface Position 3 for input_err and Interface Position 7 for output_err. The positions are illustrated in the lower right pane. Hint: Since the interface name on a Qmap is displayed by default, just leave the variable $name not to be displayed. Save and run the Qapp. The interface errors are displayed in the correct postions as defined. The following is a sample result. 3.3 Table Parser When a CLI command output contains the multiple entries, the output is usually formatted as the multiple paragraphs or a table. The Table parser is used to retrieve data from a table-formatted CLI command output. 30
 nodes as default and go to CLI Command. Enter the command show ip eigrp neighbors and select a device to retrieve EIGRP neighbors.")
36 To illustrate how to use a Table parser, let us create a Qapp to monitor the EIGRP neighbors of a router and then create an alert if a neighbor flaps. Create a new monitor Qapp. Leave Input and Canvas Device Queue and this (Device Selector) nodes as default and go to CLI Command. Enter the command show ip eigrp neighbors and select a device to retrieve EIGRP neighbors. A sample output of this command is: LA_Core#show ip eigrp neighbors IP-EIGRP neighbors for process 100 H Address Interface Hold Uptime SRTT RTO Q Seq (sec) (ms) Cnt Num Fa0/ :04: Fa0/1 10 1w3d Et1/0 11 3w1d The output is formatted as a table. It includes headers followed by actual data. Starting from the header, highlight two or multiple lines and click the Define Table option. The Table Parser window opens. The system automatically create a table parser for the table contents. The system automatically replaces the space between fields with the semicolon (;) And each header field will be set as a variable. Please note that the automatically created table header may not parse the data correctly and you need to manually adjust it according to your demand. In this case, as there s only one space between the Hold column and Uptime column, NetBrain sets these two columns as one column and this is not the real case, In order to separate these two columns, add a semilcolon(;) between these two columns. 31

37 You only need to assign interesting fields. Here we are interested with neighbor IP address, interface name and uptime. So we can safely delete all other automatically created variables, click the button at the end of the variable to delete it and only keep the variables you are interested in. Please modify the variable name to a more meaningful name, and it this case, we set Address => nbr_addr and Interface => intf_name. Note that since the Uptime column was defined manually, we need to manually add this filed. Click the button and add Uptime=> uptime. The variable definition follows the same rules as a Keyword parser, for example, you can set the variable type as int by setting the variable type as int. 32


38 After defining these variables correctly, the results for the sample output are displayed in the lower pane of this window in real time. Note the incorrect values in the first row. This is because the header of this table is split into two lines. To fix this issue, click the Advanced link to bring up the Table Advanced window. Setting Description 33

39 Split column method Left Aligned: the fields are aligned to the left side of the header. This is the default split method. Right Aligned: the fields are aligned to the right side of the header. End of table parser Range of characters: the columns are split by a range of word lengths. Enter the character number each column starts with separated by semicolons. For example, 0;5;13, which means that the first column includes characters 0 to 4, the second column 5 to 12 and the third column 13 to the end of the line. Number of words: number of words for each column. Enter the number of words each column has, separated by a semicolon. Enter the keyword to match the end of the table. This can be helpful since a table often has a summary at the end. Skip xx lines from header If column is empty, use previous parsed value Skip the first few lines after the header. If a column is empty, use the value of the last row. For example, in a BGP routing table, one Network has two next hops: Here we skip 1 line from the header. After saving the settings, you can confirm that the first empty row is gone as shown in the figure below: 34
40 Click the Save Variable button. You could see that the parsed variables and their values are listed in the right pane. Click Export, select a variable in the left pane, export the selected variable to the table in the middle pane, and then click Apply. You will see that all exported variables and their values are listed in the table of the right pane (The variables and variable values list here are the same those in the table of Table node and you could see them as preview data of Table node). Click Table node and check the variables and value exported. Based on data retrieved and parsed, we are going to analyze the data and output analysis results Analyze variables parsed by Table Parser In Output node, you will see all variables listed under Select Data tab. Since these variables items are all about an interface, here we need to export these variables under Interface Items of Monitor items table. Select one variable such as uptime, then click Interface Items and click export arrow button. The Set Key Variable window opens up asking you to select the interface index variable. This interface index variable will be used as the key to find other variables associated with an interface so that the variables can be correctly displayed in the map. So select the variable intf_name here and the variable $name is marked with the key icon Add variable to monitor items table one by one and then click to set display postions for these variables in a map (Do not forget to click Apply finishing a setting). In this case we set Interface Position 1 for nbr_addr and Interface Position 3 for uptime. Please note that you don t need to set Interface Position for variable intf_name since the interface name is always displayed in the map by default. Note: if you select the wrong variable as the interface index, you can right click the correct variable and select the Set as Interface Index option to set it correctly. For example, if you select $nbr_addr as the key accidently, you can right click the variable $intf_name and select the Set as Interface Index option. 35
41 Save the Qapp and run the Qapp. Create a Qmap with a few Cisco IOS devices running EIGRP routing protocol. A sample results are shown as follows. For the interfaces not configured to run EIGPR, the variables are set to N/A. 3.4 Filter Parser We already covered the Keyword, Paragraph and Table parsers. In this section, we are going to look into filter parser, which is used to filter interesting data based on the original data. Let us create a Qapp to display the passive interfaces for a routing protocol on a map. Enter the CLI command, show ip protocols and retrieve the sample: NY-WAN-Tr>show ip protocol Routing Protocol is "eigrp 1300" Outgoing update filter list for all interfaces is not set Incoming update filter list for all interfaces is not set Default networks flagged in outgoing updates Default networks accepted from incoming updates EIGRP metric weight K1=1, K2=0, K3=1, K4=0, K5=0 EIGRP maximum hopcount 100 EIGRP maximum metric variance 1 Redistributing: eigrp 1300, bgp Automatic network summarization is not in effect Maximum path: 4 Routing for Networks: / /30 36

42 / / /32 Passive Interface(s): Serial0/0 Serial0/2 Routing Information Sources: Gateway Distance Last Update w1d Distance: internal 90 external 170 Here we are only interested with the passive interfaces. The Filter Parser can be used to filter the contents. Figure out the beginning line and ending line of the contents to be filtered and highlight your interesting contents (highlighted contents should contain beginning line and ending line information. Here we highlight Passive Interface and Routing Information and meanwhile highlight contents between Passive Interface and Routing Information Sources: In the popped menu select Define Filter. Click Advanced hyperlink in the Filter Parser window, uncheck the box of Exclude the ending line and in the Filter Advanced window and Click OK to save the setting. Click Save Variables and the filtered contents are highlighted in the sample: Passive Interface(s): Serial0/0 Serial0/2 How do we retrieve the interface names from the filtered content? Here we need to define another parser under the Filter Parser to further parser the filtered content instead of the whole 37

43 output Add a child parser for Filter Parser Within a Filter parser (parent parser) you can add a new parser (child parser), which can be of any type and is applied to filtered data. To add a child parser, double click a Filter parser in Parser Tree as the parent parser to set it as the current parser. The definitions and rules of child parser are the same as that of a parent parser. In theory, a child parser can have its own child parser, but this is seldom used. Let us add a Table parser to the Filter parser, eigrp. Click the node Fitler($filter1) in Parser Tree and select Table as the parser type. There are only column in the table and enter the header as Passive. Assign the field Passive to variable $name. Click Add Parser button. A node Table($passive) is added under the node Fitler($filter1), meaning that $passive is a child table parser of the Filter Parser $filter1. Hint: 38
 Click to define variable and select Passive from the drop-down menu. You could use default variable name passive. Here give it a meaningful name passive_intf.")

44 you could also add a child parser for a filter parser by the following way: (1) highlight filtered content and select Define Table option (2) In the Table Parser window, replace Passive Interface(s): with Passive in Table Header (3) Click to define variable and select Passive from the drop-down menu. You could use default variable name passive. Here give it a meaningful name passive_intf. (4) Click Save Variable and you will see that the passive interfaces are correctly parsed Analyze data parsed by Filter Parser In Output node, you will see the variable passive_intf listed under Select Data tab. Select the variable, then click Interface Items and click export arrow button. The Set Key Variable window opens up asking you to select the interface index variable. Select the variable passive_intf here and the variable passive_intf is marked with the key icon. click to set display postion for passive_intf in a map (Do not forget to click Apply after finishing a setting). In this case we set Interface Position 1 for passive_intf. Save and run the Qapp against a Qmap of EIGPR devices and you should have an output like the following: 39

45 3.5 Add Multiple CLI Commands in a Qapp Quite often we need to monitor the data from multiple CLI commands in the meantime. For example, to monitor the general health of a network device, we may want to monitor device level data such as CPU and memory usage and interface level data such as input and output errors. Let us edit the Qapp we created in the section 3.2 and create a general Qapp named Monitor Overall Health of Devices to monitor the device CPU usage besides the interface status. To add another CLI command, hover your mouse over this node (Device Selector) in Canvas block, drag right as the mouse pointer changes to hand sign, release your mouse and select CLI Command option in the popped menu. 40
 and the system will give it a default name Table1. Export the variable cpu_1m to Table1.")
46 Enter the CLI command show process cpu, retrieve the sample and define the keyword parser (Name the variable as cpu_1m). Follow the way of creating a CLI command node, drag to create a Table node (Device data table) and the system will give it a default name Table1. Export the variable cpu_1m to Table1. Then following the Table1 node, create an Output node and the system will give it a default name Output1. Click any Output node, you will find that there are two tables under Select Data tab (all variables in a Canvas could be called or used by other nodes within the Canvas). Here we edit the variable cpu_1m in Output1 node. Click plus sign of Canvas.Table1 to extend the variables under it and export the variable cpu_1m to Device Items. Click the variable cpu_1m and set display position for it. Here we set device position 1 for it. Define an alert message for the variable cpu_1m so that the device is red if cpu_1m > 10. Run the Qapp and you can have a monitored Qmap as the follows: 41


47 4. Define Analysis and Alert In Chapter 3 we have learned how to use the Parser to define the variable as well as how to define the basic analysis of a variable. In this chapter we will go over the analysis of the variable and introduce how to create alert in detail. 4.1 Monitor and Display Variables in Qmap Let us review the Qapp Monitor Overall Health of Devices we created in the section 3.5. To better demonstrate the concepts, modify the keyword parser of CLI command- show process cpu-as follows (Highlight a cpu value and add variable one by one until all variables are added): CPU utilization for five seconds: $cpu1/$cpu2; one minute: $int:cpu3%; five minutes: $int:cpu5% 42

48 Also click the CLI command node-show interface and modify the parser of the comamnd CLI1 to add more variables. Highlight the value of CRC, frame, overrun and ignored and select Define Varaible option to define corresponding variables. Following the way we have learned in Chapter 3, export these new variables to Table node and then Export them to Monitor items table in the Output node. Please note that you should add CPU variables under Device Items and interface variables under Interface Items. 43


49 4.1.1 Monitor Device Level Variables The basic variable such as cpu1 under the command show process cpu is defined by the keyword parser and has only one instance for a device. Please note by default the Position of device level variable is set to Not Display, meaning that NetBrain will not display the value of the variable by default. In order to display the value of the variable, you need to explicitly set the position of the variable. You are allowed to analyze up to four variables for Device-Level Analysis, as you are allowed to set up to four positions for device level variable. If you don t want to monitor the current variable, you can simply set the Position of the variable to Not Display. Set the displaying positions of all these device level variable as you like. Run the Qapp and the following is the sample output. Note that variables are displayed in the position defined in the analysis. Note: 44

 Descriptions of all fields are listed in the table as shown below:")
50 When you define displaying position for a variable, you could click Advanced hyperlink display advanced displaying settings of the variable (the displayed fields for device-level variables are different from those for interface-level variables) Descriptions of all fields are listed in the table as shown below: 45
51 Field Display Name Display Prefix Value Unit Display When Description Display Name is extracted from procedure and cannot be modified. Display Prefix is the prefix of the monitor variable to be shown on Qmap during monitor period. Value unit is the unit of the monitor variable to be shown on Qmap during monitor period. Always display on map: The system will always display the value of the monitor item. Only display when it triggers alarm: The system will only display the value of the monitor item if the alarm defined for this variable in step1 was triggered. Display when the condition is true: The system will display the monitor variable if the condition defined here is true. Never display on map(used for intermediate variable) : The system will never define the monitor variable, this is often used when the monitor variable is not the final results you want to monitor and it is just an intermediate variable used to calculate other monitor variables. Display More Show increment/decrement on map like: 81.2% (+5.1%) The system will display incremental/decremented ratio on map compared to [last] value following the current value. Show statistics on map like81.2% (Avg85% Max:92%) The system will display statistics on map if this option is checked. You can select one or more statistics options. And also you can define how many times the statistics is based on (up to 20 times) Monitor Interface Level Variables The variables such as $crc of command show interface has multiple instances for a device. These variables can be only displayed in interface position but not device position. By default the position of interface level variable is also set to Not Display andyou need to explicitly set the position of interface level variable to display the value on Qmap. As explained in Chapter 3, the system needs to know which array variable is used as the key to find the interface associated with a row of the data so that the data can be correctly displayed in the map. The variable is labeled by the key icon. You can right click a variable and select Set as Interface Index option to set it as the key. Set the display positions of all these interface level variables except name as you like. You could click the legend icon to preview the display positions on a map 46


52 Run the Qapp and a sample map is shown as the followings: The variables along the link are displayed exactly as defined in the analysis. Note that the variable $input_err is displayed above the link for the interface s0 of the device BJ*POP while it is displayed under the link for the interface S0/1 of the device BSTX.Core, which is consistent with the positions illustrated in the legend. 47


53 4.1.3 Data Chart By default the system retrieves the data from the live network and displays the values of variables of the current poll cycle in the map. The data of the current cycle is also displayed in the left pane under the Qmap as a table format. Click Device Data or Interface Data tag to see the values of the device level or interface level variables correspondingly. Select one value to see its historical chart in the right pane. The chart is meaningful for an integer or double variable, not for a string variable. The horizontal time scale can be adjusted by selecting to the last point, 5 minutes, 30 minutes, 1 hour, 6 hours, 12 hours and one day. 4.2 Define Alert for Variables For a variable added into the analysis, you can define an alert. Defining an alert for an interface level variable is identical to that for a device level variable. However there are some differences between defining the alert for an integer variable and a string variable. Now, let s first know about how to define an alert for an integer variable. Click Create Alert tab in Output node, select an integer variable and you can find that there are 48
54 4 operators and under each operator there are corresponding judging conditions: (1) Basic ==,!=, >, >=, <, <=: comparing the variable current value ([now]) against a threshold value. For example, select >= operator and enter 90 as default value for the variable cpu_1m and this means that 1-minute CPU usage is higher than 90%. In range, out of range: checking whether a variable is in or out of a range. For example, we can define a warning alert if the variable cpu_1m is in range of [80,90], which means that its value is equal or greater than 80 AND less than 90%. (2) Delta ==,!=, >, >=, <, <=: comparing the delta value against a threshold. The delta value is the difference between the current value ([now]) and the value in the last polling cycle ([last]). For example, you can use these operators to check whether the interface CRC errors increase with time, which may indicate a bad cable connection. In range, out of range: checking whether the delta value is in or out of a range. (3) Flapping Is flapping: checking whether a variable is flapping. (4) Advance: Advanced: writing the complex conditions if the above scenario does not satisfy your purpose. The first two kinds of operators can be categorized into threshold alert. Now let s get details of these four types of operators. Now let s get details of these four types of operators Basic Alert The Basic alert is the most frequently used alert. It is mainly used to compare a variable against one or more threshold value and creates an alert message if the condition is satisfied. For operations of ==,!=, >, >=, <, <=, In range, out of range, you can select one of these operations for the current value [now]. The threshold [threshold] is a value the user can set while running the Qapp. If the user does not set any value, the system will set it to be the default threshold value you enter here. For example, let us select the operation >=, enter the threshold as 6 for the variable $cpu3, enable Alert Message and set the message as CPU usage is high!. 49
![The variable [now] is the value of the variable in the current poll cycle. The variable [threshold] is an integer threshold value the user can set while running the Qapp.](/docs-images/89/99262880/images/55-0.jpg "It will be set as the default value (6 here) if the user does not set it in the run time and this alert is defined as: If the current value of $cpu3 is successfully retrieved and it is equal to or")

55 The variable [now] is the value of the variable in the current poll cycle. The variable [threshold] is an integer threshold value the user can set while running the Qapp. It will be set as the default value (6 here) if the user does not set it in the run time and this alert is defined as: If the current value of $cpu3 is successfully retrieved and it is equal to or greater than the threshold value, create an alert message CPU usage is high!. Hint: By default, when a variable under Device Items will be marked in red on a map if it reaches the error condition you have set. However, the device itself will not change its color as the variable color. If you want to make the device color change as a variable item of the device meets the error or warning condition, you could do as follows: Click Device Items in the left pane. In the right pane, click Device Color tab and select item(s) which will lead to the change of device color. You could select multiple items. If Reachability is selected, a device will turn red if the Qapp fails to ping the device at run time. Save and run Qapp. In the step 3 (Set Threshold value) of Monitor window. All thresholds defined in the Qapp are displayed in the Qapp Input pane. The name of input variable is formatted as $$<variable name> such as $$cpu3. Here $$ means the global variable for the Qapp. Click the default value to set the variable value unless the default threshold is good. 50
 giving alerts Alert Message: including the device name giving the alert and the message itself.")

56 The following is a sample output. An alert is created with five fields: Device: List the device(s) giving alerts Alert Message: including the device name giving the alert and the message itself. Condition: The condition set for giving an alert message First Time: the repeated alert will be treated as one alert. This is the first time when the alert occurs. Last Time: the last time when the alert occurs. Count: how many times the alert occurs. Acknowledged: click the Acknowledge button to acknowledge an alert. This field will be set to Yes and the count is set to 0. The variable and its value related to an alert are also highlighted in the map. 51


57 4.2.2 Change Analysis Alert (Delta) The change analysis is used to check the change of an integer variable between the last and current cycle. For example, it may be fine if the variable $crc is not zero, but the cable connected to the interface may not be in a good condition if this variable increases with time. Therefore an alert should be created in this condition. Click Error tab and check the box of Enable. Select Delta from drop-down menu of Select Analysis, select [Delta]>= as the operation and enter a default threshold value as 1. The change can be calculated by percentage. Enable the checkbox of Alert Message and enter the alert message as Bad cable! This alert is defined as: If the value of $crc is successfully retrieved in the current and last poll cycle and the difference of its values in these two cycles is equal or greater than the threshold value, create an error message Bad cable! Save and run the Qapp. In the Run Monitor window, click Threshold heypper link and you will find that a new $$crc [Delat] is listed in the Qapp Input in the Instant Monitor window. Run the Qapp in your live network to find out any bad cable. 52
![Note: if you select calculating the change of variable by percentage, the system calculate the percentage by ([now] - [last])/[last] and compare the percentage to the threshold.](/docs-images/89/99262880/images/58-0.jpg "The variable [now] is the value of the corresponding variable (in this case $crc) in the current poll cycle. The variable [last] is the value of the corresponding variable in the last poll cycle. 4.2.")
58 Note: if you select calculating the change of variable by percentage, the system calculate the percentage by ([now] - [last])/[last] and compare the percentage to the threshold. The variable [now] is the value of the corresponding variable (in this case $crc) in the current poll cycle. The variable [last] is the value of the corresponding variable in the last poll cycle Flapping Alert The Flapping analysis is used to check how frequently a variable changes or flaps. For example, it may be fine if the input error of an interface is not zero which can be caused by the past network congestions. However if the input error keeps increasing, that may indicate a network problem and an alert should be raised. Create an alert for the variable $input_err. Select flapping as the type of operator. Define the frequency of changes and the alert message. For example, we define the alert for the variable $input_err as follows: If there are 5 changes in last 50 data samples, then create a warning message: The input errors keep increasing! 53


59 4.2.4 Advanced Alert In most time, the three types of alert-basic, Delta and Flapping- could satisfy your need. However, if you want a more complex condition which is beyond the range of the mentioned three types, you can use Advance alert to write a complex condition. For the types of alert-basic, Delta and Flapping, the system transfers the definitions of condition to the Python codes, this is done by the system automatically and you don t need to care about this. For the Advance Alert, you have to write the condition in the Python codes, which the system just executes. Here is an example of the condition definition for the Advance alert: [now]!= None and [last]!= None and [last-1]!= None and ([last]-[last-1])>=1 and ([now]- [last])/([last]-[last-1]) > 1.05 Here [now] is the value of the current poll cycle, [last] is the value of the last poll cycle and [last- 1] is the value of the last last poll cycle. Further [last-n] (n is an integer) is the value retrieved in 54
 and [threshold]. 4.2.")
60 the poll cycle n times before the last one. See the Appendix 3 on how to write the Condition in Python. The variables which can be used in the Condition of Advance alert includes: [now], [last], [last-n] (n is any integer) and [threshold] Edit and Disable/Enable alert To edit an alert, just modify the alert according to your needs. To enable an alert, check the checkbox of Enable. Once the Enable box is checked, you will see that the Alert field in the left pane is marked with a red bar. To disable an alert, uncheck the checkbox of Enable Define Alert for String Variables The way to define an alert for a string variable is similar to an integer variable with some subtle differences. Open the Qapp, monitor eigrp neighbors, created in section 3.4 and go to Output node. Click any string variable under Create Alert tab, you will find that there are three types of operators for the string variable: Basic, Flapping and Advance. Under each operator there are corresponding judging conditions and for Basic type, the conditions are Contains, Does not Contain, Equal to, Not Equal to, Start with, Changed, No Change. Let us create an alert if an EIGPR neighbor flaps. We need to check the variable $uptime against 55
 to the integer variable to measure the uptime in seconds (such as (52*7+1)*24*60*60 seconds).")

61 a certain time. For example, if $uptime is less than one hour, it may be flapping and a warning message is created. In order to do this, we must transfer the string variable $uptime (such as 52w1d ) to the integer variable to measure the uptime in seconds (such as (52*7+1)*24*60*60 seconds). Here, we take a shortcut to check whether the uptime is longer than one day: if the uptime is less than one day, the uptime output will be hh:mm:ss instead of the format 2w5d18h. Therefore to check whether the uptime is less than 24 hours, we just need to check whether the uptime contains a colon : or not. Define an alert for the variable $uptime as the following: Save the Qapp and run it in a Qmap with EIGRP devices to see whether there are any flapping EIGPR neighbor in your network. Let us create another alert if neighbor address changes. Click the variable $nbr_addr and under Basic type select the condition Changed. Here you compare values [now] and [last] and output a warning message if they are not same. 56


62 The definition of Flapping and Advance type of alert for a string variable is identical to an integer variable. The alert definition for a floating variable is identical to an integer variable. And the bool variable is seldom used in the monitor Qapp. 4.3 Use Compound Condition to Monitor Items Up to now, the alerts we have defined are just applicable to a single variable. Sometimes we define a complex condition involving multiple variables. For example, create an alert message if the input error OR output error of an interface increases. A Compound Condition can be created for this purpose. Let us take the Qapp Monitor Overall Health of Devices that we defined in section4.1 for an example. Move to Output node: Click Add Compound Alert button and select Interface. Under the Interface Items, a new item IfCondition1 is created and click it to edit on the right pane. 57
![Click Error tab in the right pane and Check the checkbox Enable. For the expression A, select $$input_err from the drop-down menu and [Delta]> from the second menu and enter 0 as the default value.](/docs-images/89/99262880/images/63-0.jpg "The expression A means that the input errors increase between two poll cycles. Define the expression B similarly for the variable $$output_err.")

63 Click Error tab in the right pane and Check the checkbox Enable. For the expression A, select $$input_err from the drop-down menu and [Delta]> from the second menu and enter 0 as the default value. The expression A means that the input errors increase between two poll cycles. Define the expression B similarly for the variable $$output_err. The system automatically creates a Boolean expression A and B. Modify it to be A or B. Enter The input or output error increase! in the alert message. Define position for the compound alert to display on a map. In this sample, select Interface Position 8. For demo s purpose, follow the same steps to create a warning message under Warning tab if the input error or output error is not equal to 0. If you have defined both Error and Warning, the Alert field of IfCondition1 is marked with in red and yellow mixed color. Save and run the Qapp. A new IfCondition1 is listed in the threshold setting in the Run Monitor window. 58


64 You can see the conditions defined for IfCondition1 and modify the threshold if needed. For demo s purpose, let s just keep this setting. Click the Run button and you will see different color blocks are shown in the interface level positions. Explanation for different color blocks are shown below: Red Color Block : It indicates the "Error" status predefined int the Qapp. Yellow Color Block :It indicates the "Warning" status predefined int the Qapp. Green Color Block :It indicates the "Normal" status predefined int the Qapp. White Color Block :It indicates that it is undetermined due to lack of underlying variable value. You can move mouse to hover on a condition color block in the heat map, an instant monitor chart opens, click icon to pinup the chart on the map. 59

65 You can find the total number of alert messages generated for a device (including messages generated for all its interfaces) are listed at the top left corner of the device icon. In the picture shown below, we can see there are total 30 alert messages generated since the monitor was on. Mouse over this number and you can view alert details. Here we can see these 30 alert messages are generated on interface e1/0, e1/0 and f0/0. And there are 2 alert messages generated by CPU usage. 60


66 At the bottom of the left pane lists the monitored alert types. You can use these two options to decide which types of alert to be counted and displayed within the Qmap Merge Display Positions of Multiple Variables into One In chapter 3.2, we created a Qapp to monitor interface input error and output error and display the corresponding data on the Qmap. Input error data and output error data are displayed in different positions. Actually you could show these two kinds of data within the same interface position. 61

67 Open the Qapp and move to Output node. To display the interface input error and output error altogether within the same position. Use Ctrl to select these two entries in Monitor item s table and right-click to select Merge Items. The window of Display Multiple Monitor Items Together opens. You can select/deselect the variables you want to merge together and enter the Name of the new merged variable. In this case, we put the name as in_err/out_err. Hint: If you want to separate the merged variable into individual variables, click the merged variable and select Merge Display, in the new window uncheck these merged variables and click OK to ungroup these variables. 62


68 Click the merged variable and set the position for it so that it can be shown in interface level position. Save the Qapp and run it, a sample map is shown as the followings: Both input error data and output error data are displayed in the same interface position. These data are separated by /. 4.4 Monitor Qapp Execution When running a Monitor Qapp, you could click the Execution Options hyperlink in Run Qapp window to set data storage and alert . 63

69 Live Data Storage: (1) In Map: check this option and save the live data into the map that the monitor Qapp is run on (2) In Local: check this option and save the live data locally. Export Report Table: export a file to the file folder you specify. You could also set file type for exported file. Settings: fill in the settings for the system to send the alert messages. You could check the checkbox of Set as Default Options to make your settings as default settings. 64

70 5. General Qapp In previous chapters we have learned creation, components and functionality of monitor Qapp. Monitor Qapp runs periodically, analyzes retrieved data and shows real-time results on map, including live performance data and alert. By monitor Qapp, you could grasp your network and network device status in real time and in a visible way and judge and troubleshoot network problems based on real-time data displayed on map. Based on understanding of Monitor Qapp, in this chapter we will look into another type of Qapp, General Qapp. General Qapp is similar to Monitor Qapp in creation and components, but different from 65

71 Monitor Qapp in Output node, running frequency (General Qapp runs once) and functionality. Output node and functionality of General Qapp 5.1 View Components of a General Qapp To understand a General Qapp, it is necessary to create a General Qapp and understand its components first. Click the Qapp tab in your workstation, and then click the New Qapp button within Qapp Operation ribbon. The New Qapp window opens. 66


72 In the New Qapp window, double-click General Qapp (default) and Qapp Editor Window opens. For a general Qapp, it has two blocks under Execution Flow by default: Input and Canvas, which is different from a monitor Qapp since there is a Loop block between Input and Canvas blocks. It indicates that a general Qapp only loops once and is different from a monitor Qapp that loops periodically. 67

73 Input and Canvas nodes in a General Qapp are same with their counterparts in function in a Monitor Qapp: Input node is mainly used to define the way by which the Qapp will obtain devices to run at execution time and Canvas node is mainly used to retrieve and parse data from the live network as well as analyze parsed data. Note: A general Qapp can include more than one canvas, which will be covered in Chapter 11. For now you can think that a general Qapp has only one canvas. Double-click Canvas block to enter Canvas editing window. For Canvas in a general Qapp, it has six elements by default: Device Queue, this (Device Selector), CLI Command, Export and Table and Output 5.2 Create a General Qapp In this section, we will create a General Qapp Show Version to check a device s IOS version 68

 Define the way by which the Qapp will obtain devices at execution time by Input")
74 number and define that the Qapp generates alert message for the devices whose version number reaches the version number we have set. During the creation of this general Qapp, we learn the basic concepts of a Qapp. Click the Qapp tab in your workstation, and then click the New Qapp button within Qapp Operation ribbon. The New Qapp window opens and double-click General Qapp(default) to create a new Qapp Define Device Input Similar to create a monitor Qapp, it generally takes three steps to create a General Qapp: (1) Define the way by which the Qapp will obtain devices at execution time by Input block (2) Retrieve and parse data from the live network by Canvas block (3) Define analysis for the data and output results by Output block Like the Input we have learned in Monitor Qapp, Input here is mainly used to define the way by which the Qapp will obtain devices to run at execution time. Input have two categories: Device Input and Table Input. For Device Input, there are four types of Device Input: (1) Single Device: Define the Qapp to run one device. Two options are under this type: Auto: The Qapp creates devices based on execution environment. For example, if the Qapp runs on a map, it will automatically get all devices from the map. For each device, the Qapp take it as an independent device queue and run independently on each single device. 69

75 Customized: Specify a device for the Qapp. The device is not allowed to be changed at run time. (2) Device Group: Define a group of devices for a Qapp to run on. Four options are under this type: Auto: The Qapp gets all devices and takes them as a group based on execution environment. For example, if the Qapp runs on a map, it will automatically get all device from the map and put them in a group. All devices in the Group as a whole run the Qapp together. Group in workspace: Define a system built-in group such as Device Group, Site, and Device Type. Customized: Specify a device group for the Qapp to run on. The device group is not allowed to be changed at run time. Import from a table which defined in Table Input : Use the devices defined in an imported table as device input. (3) Traffic Path: Selecting this type will a create a Qapp about path analysis and users will be prompted to select a path at run time (4) None: Do not input any device for the Qapp. For Table Input, you could import a table and create a Qapp to parser the data in the imported table and analyze the data. About the Table Input, we will introduce it in detail in Chapter 14. You could define Input based on your needs, and here we leave the Input as default: 70

76 5.2.2 Define Canvas to retrieve and parse data In this step, we will introduce the Canvas, a block mainly used to retrieve, parse and analyze data from the live network. Double-click Canvas block to enter Canvas editing window. There are six components in the Canvas of a general Qapp. From left to right, the first component is Device Queue, followed by Device Selector (this), CLI Command, Export Data, Table and Output. These components are logically connected with direction, we need to edit these components by this order. We have already learned these concepts in Monitor Qapp, here let s review them: Device Queue: Device Queue exists in a form of table and its rows are devices or device interfaces waiting for Qapp to run on. By default, the devices in Device Queue are inherited from devices defined in Input Block and will be referenced by its downstream node- Device Selector. You could build varieties of Device Queues based on different options. For example, if you select the option A pair of devices per Queue, the Device Queue table in the right pane will list all devices neighbors (you could use this option to compare data of a device and its neighbors, see use case in Chapter 9), and if you select the option Include All Interfaces, the Device Queue table will lists all interfaces of a device. 71
77 In creating the Qapp Show Version, we will not use device interfaces or devices neighbors and we here leave the options as default: Device Selector: as its name indicates, it is used to define which column (this device or its neighbor column) in its upstream Device Queue will be used for its downstream CLI Command. If you have selected the option One device per Queue, there is one option this in the drop-down menu; If you have selected the option A pair of devices per Queue, there will be two option- this and nbr. The Device Selector here will be inherited by its downstream node- CLI Command. If you select nbr, the Qapp will execution CLI command on retrieve a device neighbor rather than a device itself in CLI command node. 72

.")
78 You could also define the branch condition by the device properties such as device type in Device Selector. When a device is passed to Device Selector from Device Queue, Device Selector checks the condition of each branch to decide which command will be executed on the device. One of key use case for DS is the multi-vendor support (see Chapter 15 for details). CLI Command: CLI Command is used to define how to retrieve data of a device and rules to parser the retrieved data. 73

79 Export Retrieved Data: The node- Export Retrieved Data is marked with the sign. In this node, you could export the variable data retrieved in CLI Command node to the downstream Table node for subsequent analysis. Table: The table node is used to store the data parsed from a device for further analysis. Clicking this node, you will find that all variables and their sample values that you have exported in the upstream node are listed. Now, we start to define these component to create the Canvas for the Qapp Show Version step by step: (1) Define Device Queue. Since we do not need device interface and device neighbor data in creating the Qapp, here we leave Device Queue options as default. (2) Set Device Selector This is only one option this in the drop-down menu if you do not select the option a pair of device per Queue. Leave all options in this node as default. 74
 and select a Cisco IOS device.")
 and click the Define Variable option.")
80 (3) CLI Command. (a) Enter the CLI command show version. (b) Retrieve the sample output. Click the Retrieve Sample button (field 2) and select a Cisco IOS device. (c) Define the parser To retrieve the version number, highlight the value of version (15.1 for this sample output) and click the Define Variable option. The keyword Parser window opens with the following fields: 75


81 Here they system automatically creates a parser Version $double:var1\(4\)m5, RELEASE. The variable type is double which is used to parser floating number. For different devices, the number in the brackets behind the number version may vary, but they has a common characteristic in version number- version number ( To let the parser be able to parser other devices version number correctly besides the sample device, here we need to modify the parser to Version $double:var1\( You could leave variable name var1 as default and here we give it a meaningful name version Click the Save Parser button to save this parser. In the right pane Define Parser you will see the variable and variable value parsed. 76
 Export Retrieved Data (a) Select the variable version (b) Click the export arrow to export the selected variable (c) Click Apply button to finish variable exporting.")

82 Hint: Highlight the value to be exactly what you want to retrieve and do not include the spaces before and after this value. (4) Export Retrieved Data (a) Select the variable version (b) Click the export arrow to export the selected variable (c) Click Apply button to finish variable exporting. In the right table, you could see imported variable and value Note: (5) Table: The table node is used to store the data parsed from a device for further analysis. Clicking this node, you will find that all variables and their sample values that you have exported in the upstream node are listed Analyze Variables and Define Output Through the above two steps, we have obtained the required data for the devices that we are interested with. In this step, based on the data, we will define analysis and output analysis results for the data. Click the Output node and the Output editing window will show as the following figure: 77
 and if the condition you have set is reached, the Qapp will generate actions you")
83 Node Name: The name of the output node. You could give it a meaningful name, such as check version number. Logic Node: Logic Node is used to define conditions for the Qapp to take actions (give an alert, highlight a device ) and if the condition you have set is reached, the Qapp will generate actions you have define in Action Node. There are three types of logic nodes: If, else if and else Action Node:Action Node is used to define result output for a logical node. You could define multiple actions under an If condition. Here we are going to define a logical node and Action node as follows: If a device IOS version number is less than 17.1 Then give an alert message to tell user to upgrade IOS version. You could define this analysis and output the analysis results by the following steps: (1) Click If button in Logic Node and drag and drop it in to table below (an If logic node is already created by the system). In the right pane, enter a description, for example, Compare retrieved version with defined threshold value in the Description field, click drop-down menu of expression A and select $version from drop-down menu. Then select < and enter


84 (2) Click Alert button in Action Node and drag and drop it under If node in the table below. In the right pane, select information option (There are three message levels: information, warning and error. You could define one of them based on your actual need) and enter the IOS version is $Table.version. Please upgrade! When you enter $, the IntelliSense provided by the software can help you to find the available variables. For example, after typing $ in the Message field, there is a dropdown window showing all variables which can be used here. After selecting $Table and entering the dot (.), another IntelliSense window is displayed with available variables that you can use. Hint When you enter $, you could directly select version from IntelliSense window. In this Canvas, $Table.version and $version represent same content. 79

85 5.2.4 Save and Run General Qapp Click Save button in the Qapp Editor window and Save as window pops up. Select a location, enter a meaningful name- Show Version in the File name field and click Save to save it. Click Run button in Qapp Editor and Run Qapp window opens. Click Device Input button Device(s) window and click OK button to save and exit, select the devices that you are interested with in the Select 80
 Before")


86 Click Run in the Run Qapp window to run the Qapp. A sample result is shown as follows: Note (1) Before running a Qapp, please save it first, otherwise you will get a prompt message asking you to save the Qapp. (2) You could also run a Qapp by click Run Qapp button in the Qapp Operation ribbon under Qapp tab of your workstation. 81
, DrawMapNote( snote, smap='', spage='').")

87 5.2.4 Define Advanced Output Advanced Output offers a platform to analyze data and output analysis results by combining python scripts (python syntax) and NetBrain built-in API, such as HighlightDevice( Dev, slegendname, smap='', spage=''), DrawMapNote( snote, smap='', spage=''). For NetBrain builtin API, please refer to NetBrain Built-in Functions in the Appendix, and for basic introduction to Python Scripting, please refer to Brief Introduction of Python Scripting in the Appendix. Like Basic Output, Advanced Out mainly consists of two elements: conditions (if, else if, else) and actions (draw device on a map, add a device note ) based on each condition. 82

88 if $totaluse and $totalmem: DrawDeviceSmartNote($this,"EIGRP Running Status","EIGRP processes memory usage: "+str($memusage)+"%",sn_append) In Advance Output, you could analyze row data of a table and you could also analyze table attribute value of a table Let us modify the general Qapp Show Version to give out analysis result by Advanced Output. if $version < 17.1: AddMessage("plese upgrade IOS version") When you enter a letter in script window, NetBrain built-in functions start with this letter will pop up in the drop-down list automatically. For example, when input a letter a, NetBrain built-in functions starting with a all list in the pop-up window. The content in the brackets of a function is the style to call a function. For example, AddMessage(str:msg, int:msg, str:var_name, int var_index) 83
 Retrieve from live network: The Qapp logs into the devices and retrieve real time data.")
89 5.2.5 General Qapp Settings Run a General Qapp and Click the Execution Options hyperlink in Run Qapp window. The Execution Options window opens, where you can modify: Select Data Source (1) Retrieve from live network: The Qapp logs into the devices and retrieve real time data. If you Check Use cached data live data if it is old under this option, it will use cached live data if the 84
90 data is less than time interval you have specified. This option is useful to improve the performance of a Qmap. If the Qapp runs on a map, you could save the data retrieved on the map folder by checking the option Add to existing map Datafolder (2) Via cached data: to retrieve data with current baseline or local folder. Export Report Table: export the document to the file folder you specify. You could also set file type for exported file. Set as Default Option: check this option and execution setting is effective for all Qapp. 5.3 Add Multiple Action Nodes in one Output In the Qapp Show Version created in section 5.2, we have defined one Alert action (tell user to upgrade IOS version if a device IOS version is less than 17.1) in the Output. Actually, you could add multiple action nodes in Output and to understand how to create multiple action nodes, we are going to modify if conditions and Action nodes the Output of the Qapp Show Version as follows: If a device IOS version number is less than 13.1 Then: (1) give an alert message to tell user to upgrade IOS version (2) draw and highlight low-version device on map Else Give an information message to tell user that IOS version is fine Open the Qapp Show Version and go to Output node of the Canvas. (1) Click If row in the table of the left pane and set the condition as $version < 13.1 in the right pane. (2) Click Draw Map in the Action Node and Drag it to the table below. You could drop the Draw Map node under Alert1 row, the number of Draw Map is 3. If you drop it between If1 row and Aler1 row, the number of Draw Map is 2 and that of Alert1 will change into 3 85


91 Here we add two action node and the two actions are both under If1 condition. The execution sequence of them do not matter too much and it is both ok for you drop the Draw Map node under Alert 1 row or between If1 row and Alert 1 row. Edit the Draw Map in the left pane: Check the checkbox of Draw Device. Based on actual need, you could also draw the device s interfaces and Hops (for traffic path) on map. Here we leave them unchecked. Check the checkbox of Auto Link. If two devices drew on map are neighbors, the system link them automatically. If nbr devices are available in Canvas Table, you could check Include 2 nd Device checkbox and draw nbr devices on map. Check Highlight checkbox and you could select color to display devices on map (Random color by default). Legend filed is use to enter a string (could be a variable) and the system bases on the string to display color for devices on map. Devices with same variable values or string content will be highlight in same color and if you leave this filed empty, the devices on map will not highlighted. In this sample, we enter variable $version in this field. 86

92 You could also check the checkbox of Add Note and attach a note message to the devices on map (3) In this step, we will add an else logic node. Else here refer to conditions except the condition defined and it could be translated as follows: Else (for device whose version is larger than or equal to 13.1) Give an information message to tell user that IOS version is fine. Click else in Logic Node and drag and drop it under the last action node of If1 (in the sample, drop it under Alert1 row. Do not drop it between actions nodes of If1, since the actions under else take else as judging condition. Click Alert button in Action Node and Drag and drop it under else1 row. Edit the alert in the right pane, set alert level as Information and enter IOS version is fine in the message field. Save and run the Qapp. A sample output results are showed as follows: 87

93 6. Using General Qapp for Dynamic mapping With the mapping function of General Qapp, you could not only map a device on map when the device reaches a set condition, you can also map some particular configuration of a device on map. Configuration command and Filter parser are often used for this purpose. The following are a few use cases: Create alerts for the devices containing a particular configuration line and draw these devices on map. For example, find the devices with the no service password-encryption configuration, which violates basic security policies. Highlight or draw a particular configuration in the Q-map. The design reader can be used to filter the configurations or you can create a filter parser to parse any configuration. Do a preliminary check before applying an additional troubleshooting Qapp. This can improve the Qapp performance since the CLI Command uses the baseline configurations without retrieving the data from the devices. For example, we can check whether OSPF is configured to run on a router before applying any Qapp to troubleshoot OSPF routing issues. 6.1 Check Configuration Compliances Let us create a General Qapp (Check password encryption) to find the devices with the no service password-encryption" configuration. Create a new General Qapp, and in the Canvas block delete default CLI command and Add a Configuration Command. To delete default CLI command and its downstream nodes, click them 88


94 and press Delete key. To add a Configuration Command, hover mouse pointer on this node, drag right as the mouse pointer changes to hand sign, release your mouse and select Configuration Command in the menu. Click Configuration Command node, in the right pane, there is a built-in variable $_orginal_result and it is the baseline configuration of the seed device. We only check whether $_orginal_result contains any special configuration, and so we do not define any variables in the parser. 89


95 According to the way of creating Configuration Command, we create a Table node to store $_orginal_result for further analysis Click Export variable button, export orginal_result to the table under Table tab and click Apply to finish exporting. Create a Basic Output node for data in Table. In the Basic Output, define a condition to check whether $_orginal_result contains no service password-encryption (Don t forget the double quotation marks). If so, it prints a warning message password encryption is not enabled. 90


96 Run the Qapp. In our lab indeed there are a few devices having unencrypted passwords: Another simple but useful use case is if an NTP server is retired and you need to find all devices using this server as the NTP server so that they can be configured to use a new NTP server. A Qapp similar to this one can be created to do this work. 91

97 6.1.1 Create a map for devices with unencrypted passwords Besides displaying an alert message, you can also create a map to draw all devices with unencrypted passwords and draw a device note of no service password-encryption on the thsese devices. In the Output, click Draw Map button in Action Node, drag and drop it to the table below. Click Draw Map row in the table and edit it in the right pane. Check the checkbox of Draw Device. If Device Queue table have only this "column and do not have nbr column, only one option $_device in the drop-down menu of Select Device, so just leave it as default. Check the checkbox of Auto Link and devices will automatically connect to each other if they are in neighbor relationship. Check the checkbox of Add Note, enter Password Encryption is not enabled in the note field and select device to attach the note to the devices on map. Save and run the Qapp. A sample output result is illustrated as the figure below 92
.")
98 6.1.2 Run Change management to fix the issue With the change management module you can fix the security loophole easily. From the map floating menu, select Run > Define Network Change. (Save the Qmap if asked). The Network Change Task window appears. 93

99 Select Config Template from the left pane and enter the following commands, then click the Apply button to apply the template to all devices: config t service password-encryption Select the Execution button in the workflow bar to push the configuration change to all devices. 6.2 Map Network Design Let us create a Qmap to filter the EIGPR configurations and draw the devices with EIGRP configured in the Q-map and attach the EIGRP configurations as device notes. Create a new General Qapp, and in the Canvas block delete default CLI command and Add a Configuration Command. Click the Retrieve Sample button to retrieve a sample configuration. The configuration usually comes from the Data Folder ::CurrentBaseline. 94
 filter to filter the configuration or create a standard filter.")

100 Select Filter as the parser type in the Define Parser pane. Enter a name for the Filter parser, e.g., eigrp_config. For the configuration command there are two options for filter parser: use a builtin Design Reader (DR) filter to filter the configuration or create a standard filter. The filter parser for other types of commands such as CLI command has only the standard filter. To filter all EIGRP configurations, Click Design Reader Filter option and select Global\Cisco IOS \EIGRP\All EIGRP Configuration in the drop-down menu. The EIGRP configurations are highlighted in the sample and are assigned to the variable $eigrp_config. A standard filter can also be applied to get the same results. A standard filter filters the configurations between a beginning line keyword and ending line keyword. For example, to filter out the EIGRP configuration for just one AS number, define a variable $eigrp_as as a string and set the beginning line keyword as router eigrp $eigrp_as and the ending keyword as!. 95


101 Hint: To create a standard filter, you could also highlight eigrp configuration and select Define Filter option in the pop-up menu. In the Filter Parser window, change the name as eigrp_config, in the Beginning line filed, replace the sample AS number with a variable $eigrp_as and add a $ (it means the ending of the variable) behind the variable so that the Qapp can target the variable. 96


102 Click Save Variable and the eigrp configuration will highlight in yellow. Export eigrp_config to Table and in Output, define output conditions and actions. We will create two pairs of conditions and actions in the Output. Condition1: If the eigrp configuration does not exist, give a message: no matched configuration Click If1 row and edit it in the left pane. Select $eigrp_config from the first drop-down menu and then select Is None. Create an Alert for this condition: no matched configuration 97

 Run the procedure and all EIGRP devices and EIGPR configurations will be drawn in the current map page (a new")
103 Condition2: If the eigrp configuration exists, draw a device on map and attach eigrp configuration to it. Drag and drop else if to the table and edit it as follows: $eigrp is not none Create an action node Draw Map for this condition and edit it as follows: Check the checkbox of Draw Device Check the checkbox of Add Note and enter $eigrp_config in the note field (When you enter $, the system will automatically pop up a window listing all variables that you can use) Run the procedure and all EIGRP devices and EIGPR configurations will be drawn in the current map page (a new map is created automatically if no map is opened). 98

104 7. Using Qapp for Change check and Delta Analysis In this section, we are going to introduce another function of Qapp: to analyze increment changes of devices in a certain time interval and check network stability. An important concept, Delta operator, will be introduced in this function. It is used to compare whether a variable changes within a certain time interval. We will create a new Qapp to check the connectivity of a cable connected to an interface. One way to do so is to show the interface status and check whether CRC errors increase for an interface. If so, the cable connected to the interface may not be in good condition. 7.1 Define Loop for Delta Operator To contrast changes of a variable within a certain time interval, we need to retrieve data of the variable at least twice. Since Monitor Qapp loops periodically, we will create a monitor Qapp to retrieve the data of a variable periodically and contrast the difference of the data between two polling cycles. Click New Qapp button in Qapp Operation ribbon under the Qapp tab and 99

105 select Monitor template in New Qapp window. To resolve this problem, we need to define loop way for Delta Operator. Keep the Input as the default: Device Group type and Auto option, meaning that the Qapp takes all devices visible in the map and run on these device as a group. Click the Loop block to define the frequency this Qapp is executed, for example, every 30 seconds. Double-click Canvas to enter Canvas Editing window. Leave options in Device Queue and this as default. In CLI Command, enter show interface, and click Retrieve Sample to show a sample command. Highlight the value before CRC (for example, 0 CRC), and click Define Variable in the menu. The system automatically creates a keyword parser and finds 6 matched lines for this sample output as displayed under the Sample field. Click the link Define Variables Under Paragraphs. The Paragraph Parser window opens, where you can set the Paragraph Identifier and define more Keyword Parsers. 100

106 The Paragraph Identifier is the keyword parser to identify the start of a new paragraph. Highlight the partial start line of each paragraph, Ethernet0 is up, line protocol is and click the Set Paragraph Identifier option. The selected context is copied to the Paragraph Identifier field. This line includes the keywords which are always same and the sample values which can change. Keep the keywords and replace the sample values with the variable name and so we end up with the following Paragraph Identifier: $intf_nm is $status, line protocol is Press the enter key or click the Refresh icon to apply the change, modify the variable var1 to crc and click Save Variable. 101


107 Export the variables crc and intf_nm to Table for further use. Here we need to export the variable intf_nm since we will use the variable as the key for the Qapp to define a crc value belong to which interface. 7.2 Define Delta Operator In the Table, we have obtained the variable crc and its value, but to calculate the delta value, we still need crc value at next running time so that we can calculate the difference of crc value. Now it is time to introduce Delta Operator, a kind of Table Operator, which is designed for delta 102
108 calculation of a variable in a certain time interval. Hover mouse pointer on Table icon, drag right as the mouse pointer changes to hand sign, a menu will pop up as you release your mouse and select Table Operator option in the menu. A Operator node is created, followed by a Table node. Table Operator is used to manage Table and the data in the Table, such as merging variables of two tables into a table, deleting a variable and etc. There two types of Table Operator: 1 table input and 2 table input. (1) 1 table input: there is just one table leading to Table Operator. There are three operators under this type: Convert, Delta and Sub Table Convert: Convert a general Table into a Global Data Table. A general table can only store data for one device for further analysis in one loop, but the Global Data Table is able to store all devices data rather than just a device in Device Queue. Delta: this operator is to calculate delta value in a certain time interval. Sub Table: this operator is to remove or keep a row in a table (2) 2 table input: there are two or multiple tables leading to Table Operator. There are two operators under this type: Neighbor Join and Merge Neighbor Join: this operator is to move a device s variables (in this table) and its neighbor s variables (in neighbor table) to one table by a certain rule. Merge: this operator is to merge the rows of two tables with the same variable value into the row of one merged table. Since there is only one table pointing to this Table Operator, 1 table input is selected by default and 2 table input is in grey and not available. Click drop-down menu of Operator and select Delta. Click drop-down menu of Select Key for Delta calculation. This key variable will be used as an index to find variables to be calculated and associate calculated variables to the key variable so 103


109 that the variables can be correctly placed. Here we select Intf_nm as the key and a crc value will be placed under its corresponding interface after calculation. In the drop-down menu of Select column for calculation, select the variable for calculation. Here we select crc. Click the downstream Table2 node of Operator. There are four headers in the table: intf_name, crc_now, crc_last, crc_delta. crc_now is the the crc value successfully retrieved in the current poll cycle, crc_last is the crc value retrieved in last poll cycle and crc_delta is the difference of its values in these two cycles. 7.3 Define Delta Analysis and Output Through previous steps, we have obtained the difference of crc values in two poll cycles 104

.")
110 successfully and in this step, we will analyze the delta value and output analysis results. Create a Monitor output after Table node. In the Output node, the table variables and attributes are displayed in the left pane. The variables here are related to the interface and should be monitored as interface items. Click the Interface Items node to highlight it, then select a variable $crc_delta and click the > button to add it as an interface item. A Dialog window opens asking you to select the primary key for comparison (interface). This variable will be used as the key to find other variables associated with an interface so that the variables can be correctly displayed in the map. Therefore select the variable name here and it is marked with the key icon in the left pane. Select a postion such as Interface Postion 1 from the pull down menu and click the Apply button to save the setting. Click Create Alert tab, select the variable such as $crc_delta and enable Error alert. Let us define a basic analysis as following: 105
![If [now] > [threshold], default is 1.](/docs-images/89/99262880/images/111-0.jpg "Enter the alert message as bad Connectivity, please check the cable and Check Show")

111 If [now] > [threshold], default is 1. Enter the alert message as bad Connectivity, please check the cable and Check Show as Device Note On Map to display the alter message on map. Save and run the Monitor Qapp. For demo purpose, modify the threshold value from 1 to 0 in Monitor Qapp window and a sample output is as follows: 106

112 8. Using General Qapp for Dynamic Documentation In this section, we are going to introduce the CSV Report function of Qapp. By this function, you could export retrieved data of all devices to your local CSV file and view these data in the CSV file generated. One important concept, Convert operator, will be introduced in this function. It is used to transform a general table to a global data table that could store data of all devices in Device Queue. We will create a new Qapp to export version information of all devices to be upgraded to a CSV file so that another team can check version information of these devices in the CSV file and finish the version upgrade for devices provided in the CSV file 8.1 Create CSV Files for Variables To export data of all selected devices to a CSV file, it typically takes three steps: (1) Retrieve data and export needed data to a general Table node (2) Convert a general table to Global Data Table (3) Define the Action Node CSV Export to export data of all selected devices to CSV file. To retrieve data of device version, input show version in CLI command, and define parser as shown in the figure below(for details, you could refer to the Qapp show version created in Section 5.2): 107

 Device Selector CLI Command Table (R1 s data) Output A row in Device Queue Table (R2) Device Selector CLI")
113 After parsing the the variable version, export it to Table Export Variables to a Global Data Table by Convert Operator For a general Qapp, in most cases it can only store data of one device in one loop and the data in the table will be overwritten by the data of another device at next loop. For example, in a Device Queue there are five devices: R1, R2, R3, R4 and R5. The Qapp will loop the Canvas by the order as follows: A row in Device Queue Table (R1) Device Selector CLI Command Table (R1 s data) Output A row in Device Queue Table (R2) Device Selector CLI Command Table (R2 s data) Output A row in Device Queue Table (R3) Device Selector CLI Command Table (R3 s data) Output A row in Device Queue Table (R4) Device Selector CLI Command Table (R4 s data) Output A row in Device Queue Table (R5) Device Selector CLI Command Table (R5 s data) Output A Qapp loops just one row of Device Queue table one time. In this example, when Qapp loops R1, it will retrieve R1 s data and export R1 s data to Table. However, when it loops R2, it will retrieve R2 s data and overwrite R1 data with R2 data in the table. In one loop, if you want to append a device s data to a table rather than overwrite the data of the device at last loop, you need to convert a general table to a Global Data Table and the Global Data Table could store all device s data by appending a device s data to a table loop by loop. 108
114 To convert a general Table to a Global Data Table, we use Convert operator and it is one type of Table Operator. You could create a Table Operator node by the following way: Hover mouse pointer on Table icon, drag right as the mouse pointer changes to hand sign, a menu will pop up as you release your mouse and select Table Operator option in the menu. An Operator node is created, followed by a Table node. This table ( Table1 in the sample) is a global data table. Since there is only one table pointing to this Table Operator, 1 table input is selected by default and 2 table input is in grey and not available. Click drop-down menu of Operator and select Convert. Leave Append Data option selected by default. Note: Convert operator is the only way to transform a general table to a global data table Define Action Node to export GDT in CSV file After obtaining all devices version information in the Global Data Table, in this step we will define CSV Export Action Node to export the information to a CSV file. Click Output button in the Global Data Table, select Basic Output and an Output node will be created after the global data table. In Output, drag and drop CSV Export in the Action Node and click if row to define condition in the right pane. 109
CSV File Name: by default the name of the csv file created is Table1.")

115 Here we want to export all devices whose version number is less than 15.1 and we define the condition as follows: $version < 15.1 Click CSV Export row and define it in the right pane: (1)CSV File Name: by default the name of the csv file created is Table1. Here we give it a more meaningful name Devices to Be Upgraded (2) Select Variables that you would like to export. In this sample, we select to export variables _device and version. Click any variable exported, you could modify Header for it. For example, click _device, modify it to hostname and then click Apply button. (3) Advanced: click Advanced hyperlink to open Advanced setting window. You could set the Qapp to export Table Attribute (if there are values or variables in Table Attribute of a Global Data Table). Under CSV File Setting, you could set the Qapp to export device data to multiple csv files (by the row of Global Data Table, one row for one CSV file) or one csv file if the option Loop by Table is enabled. You could also export Qapp execution time as a table attribute to CSV file. 110


116 Note: To enable Loop by Table, click loop button on the upper left corner of a Canvas block. Check the checkbox of Loop by table, click plus sign and select a global table for the Qapp to loop. Save the Qapp and name the Qapp as Check Device Versions. When running the Qapp, you could click the hyperlink Execution Options In the Run Qapp window and make some settings for this Qapp. Here you could click the button to select a folder in which the file will be exported. If you want your settings applied to all Qapps, you could check the checkbox of Set as Default Option. 111
 is created when opening the folder in which CSV file is saved.")
. Open the CSV file and all devices with version number less than 15.1 are listed in the CSV file.")
117 After the Qapp finishes execution, you will see that a folder named by the Qapp s name (in this sample, the folder s name is Check Device Versions ) is created when opening the folder in which CSV file is saved. Opening the folder, you will see the CSV file (in this sample, the name of the CSV file is Devices to Be Upgraded ). Open the CSV file and all devices with version number less than 15.1 are listed in the CSV file. 112

118 8.2 Set Customized Fields The customized fields of a device, interface and module can be set by a Qapp. Let us create a Qapp to retrieve the image file using the show version command and add an Image File field to the Customized Information section of device property for all Cisco IOS devices. Note: before using Qapp to retrieve value of a customized filed, you need first to create the customized filed in Asset Report of your workspace. 113


119 Create a new general Qapp. In the CLI Command of Canvas block, enter the command show version. Highlight the flash information and define parser for it. Replace the variable var1 with a more meaningful name image_file and click Save Parser to save settings. 114


120 Export the variable to Table and create a basic output for the table. In the Output, drag and drop the action node Device Property under if row in the table below. Click the If row and define it in the right pane as follows: $image_file is not None Click the Device Property row and define it in the right pane. In the drop-down menu of Property Type, there are three options- Device, Interface and Module and here we select Device since the customized filed image file in the Asset Report is created under Device Info. 115


121 For the Select Variable filed, select image file in the drop-down menu of Property name and $image_file in the drop-down menu of Select variable. Click Add button to add the customized filed. 116

122 Save and Run the procedure against all IOS devices and the Image File field will be added as a customized field and the value will be set. Right click on a device and select the Properties option to confirm this. 117

123 9. Using General Qapp for Neighbor Check In this chapter, we are going to use Qapp to analyze and trouble problems between a pair of neighbor devices. We will introduce how to build neighbor relationship for a pair of neighbor devices by Device Queue as well as how to integrate a device and it neighbors data into one table for easy comparison and analysis by the table operator Neighbor Join. To understand the process of creating Qapp for a pair of neighbor devices, we will create a Qapp for a common problem: the MTU value of the neighbor interfaces are mismatched, illustrated in the following map: We can follow these steps to troubleshoot MTU mismatch problem: (1) Find out a device and its neighbors (2) Find out MTU value of interfaces of this device (3) Find out MTU value of the neighbor interfaces and compare interfaces MTU with their neighbor interfaces. Note: A preinstalled Neighbor Check template is available in New Qapp window and by this template, you could easily and rapidly create a Qapp to troubleshoot network problems of a pair of neighbor devices. However, to help understand concepts involving creating this type of Qapp, we here create the Qapp by General Qapp template. 118


124 9.1 Build Device Pair in Device Queue By default, when you create a general Qapp, there is only one flowchart in the Canvas block: Device this Comnad1 Table1. This flowchart is used to retrieve and analyze data for a device itself. To retrieve data of a device s neighbor at the same time, you need to add another flowchart for neighbor devices in the Canvas. Click Device Queue, select the option A pair of devices per Queue in the Device Queue setting and you will find that the system inputs devices into Device Queue Table by pair of this and nbr. 119

125 Under the option of A pair of devices per queue, there are many sub-options, by which you could further specify more logics to build the relationship of a device and its neighbors. Options Order of device is significant This & its L3 neighbors Filter neighbors by group Logic The system takes neighbor relationship This: R1-Neighbor: R2 and This R2- Neighbor: R1 as the different neighbor pairs and the device queue table will list both of them. Build a pair of devices by L3 topology neighbor Build device neighbors from device group input. Devices not in device group will be omitted Filter visible neighbors by map Build the neighbor pairs for devices displayed on the map and neighbor devices not showed on the map will not participate in neighbor pair building. This & its L2 neighbors Any Combination Do not include interface Include all interfaces Filter visible interfaces by map Build a pair of devices by L2 topology neighbor Build device pair for non-neighbor devices The Device Queue table will not list any interface of a device A device interfaces and its connected neighbor interfaces will be included in the Device Queue Table and every row of the table will be filled by the order of this device this interface neighbor device connected neighbor interface. The system will only build the neighbor pairs based on device interfaces displayed on the map and interfaces not showed on the map will not participate in neighbor pair building. Here we want to compare a device s interface MTU value and itsl3 neighbor s MTU value, and based on neighbor building logic we check the option This & its L3 neighbors, Filter neighbors by group and include all interfaces and Order of device is significant. 120


126 After finishing building neighbor relationship, hang your mouse cursor over Device Queue and create a Device Selector node. In Device Selector node, select nbr in the drop-down menu of Select device column and the name of Device Selector in the flowchart changes to nbr. Following the device selector nbr, you could respectively create CLI Command and Table nodes. 121


127 9.1.1 Retrieve MTU data of this device After building the flowchart for nbr device, now we are going to define CLI command and retrieve Duplex and Speed data of this and its neighbor device respectively. First we retrieve the data for this device interfaces. Enter show interface in CLI command, highlight MTU value in the sample out and define parser as follows: Paragraph Identifier: $intf_nm is $status, line protocol Modify the variable var1 to mtu Export the variables intf_nm and mtu and check them in the Table node. 122
. 9.")
128 9.1.2 Retrieve MTU data of nbr device Following the way to define command and retrieve MTU value for this device, we could define CLI Command and retrieve MTU value for nbr device. Export the variables mtu and intf_nm 0f nbr device and check them in the Table node ( Table1 in the sample). 9.2 Neighbor Join In the previous steps, we have successfully obtained the MTU value of one interface of this device and that of this interface s neighbor interface. In this section, we will introduce how to join data of two tables into one common table by the Table Operator Neighbor Join and compare both MTU values in one table. Hover your mouse on any of the two tables and create Table Operator node. By default, 1 table input is selected. Hover your mouse over the other table, drag the arrow line, and make the line lead to Table Operator and you will find that the type has switched to 2 tables input. 123
129 Click the drop-down menu of Operator and select Neighbor Join. The Qapp will automatically move the data from the two table to one table and allocate values to the corresponding variables by corresponding neighbor relationship in Device Queue table. Click any row in Key Matching table and you could view a variable and its corresponding variable name in the Device Queue. For example, click this.intf_nm, its corresponding variable name in Device Queue is this_intf : this.intf_nm <---> this_intf. Hover mouse cursor over Neighbor Join and create a Table node. Click the new table and you could see that the variables of two tables after Neighbor Join are arranged by the order of their corresponding neighbor relationship in Device Queue table. 124


130 9.3 Define Analysis and Output for Neighbor Check In the Table node after Neighbor Join, click Output button and select Basic Output to create an Output node. In this Output, define analysis and output for MTU consistency. Click if row in the table in left pane and then define condition (MTU consistency) in the right pane: $this_mtu!= $nbr_mtu Drag Alert from Action Node to table and then define alert message: MTU mismatch: $this_intf_nm: $this_mtu<->$nbr_intf_nm: $nbr_mtu 125
 Draw notes attached to the interfaces with mismatched mtu Save and run the Qapp.")
131 Drag Draw Map from Action Node to table and define it in the right pane as follows: (1) Draw a device and its neighbor on map (2) Draw an interface and its connected neighbor interface (3) Highlight interface on map (4) Draw notes attached to the interfaces with mismatched mtu Save and run the Qapp. After finishing running the Qapp, devices with mismatched MTU value will be mapped. 126
132 10. Troubleshoot Connection Problems via Qapp Besides the CLI and Configuration commands, you can also use Qapp to automate the Ping, Traceroute and SNMP commands. In this chapter, we are going to cover Ping and Traceroute command via creating a Qapp to troubleshoot the routing issue: (1) Create the Ping probe to ping the core device or server from the network devices. Output an error message if the ping fails. (2) Create a Traceroute probe for the IP addresses which cannot be pinged Ping Command In the Canvas block, create a Ping Command behind this node. 127

 $this: the device in Device Queue that is running Qapp.")
133 In Ping Command node, we first need to define the ping settings, mainly the source (the device to ping from) and the destination (the IP to ping to). We could define three types of sources Local PC: ping from the local PC. Network Server: ping from the Network Server. Select one network server or the Specified Server in the device settings (of the destination device). Device: ping from the selected devices. Here we have two options: (1) $this: the device in Device Queue that is running Qapp. (2) Select a device from the workspace: In this case, you can also check the Interface option and select an interface from the drop-down menu. The system will execute the extended ping operation and the source will be the IP address of the interface. 128

134 For the destination, you can either enter the IP address to ping to or select a device and then an interface on the device. In our example we check the IP Host option and enter the IP address of main server to define the IP address to ping to Define Ping Parameters We can also define the ping parameters shown in the Ping node. Often, you can leave these options as their defaults. Here Packet count is the number of the ping packets to be sent. Check the checkbox Set Don t Fragment flag in packet so that the packet is not fragmented. Check this option and change the packet size to find out the MTU Define Variables and Parser A default sample (Sample1) is automatically created for every ping command. The system has built-in default samples for the standard ping output and extended ping output. Three variables: $lost_rate (integer), $average_time (integer) and $ping_result (Boolean indicating whether the ping succeeded) are defined in the samples. In most cases, including our example, the default sample is sufficient. It can be used to parse the standard formats of ping commands and extended ping commands. The following are examples 129
135 of ping outputs supported by this default sample: The output of the standard ping command: Pinging with 32 bytes of data: Reply from : bytes=32 time=28ms TTL=117 Reply from : bytes=32 time=26ms TTL=117 Reply from : bytes=32 time=40ms TTL=117 Reply from : bytes=32 time=36ms TTL=117 Ping statistics for : Packets: Sent = 4, Received = 4, Lost = 0 (0% loss), Approximate round trip times in milli-seconds: Minimum = 26ms, Maximum = 40ms, Average = 32ms The output of the extended ping command: NB3-BST-CORE#ping Protocol [ip]: Target IP address: Repeat count [5]: 5 Datagram size [100]: 64 Timeout in seconds [2]: 2 Extended commands [n]: n Sweep range of sizes [n]: Type escape sequence to abort. Sending 5, 64-byte ICMP Echos to , timeout is 2 seconds:... Success rate is 0 percent (0/5) If the ping output has different formats, you can add that to Sample1 or add another sample. Click the plus sign at right of Sample1 and a new sample Sample2 is created Define ping result analysis and output The analysis and output for the Ping command follows the same rule as the CLI command. For our example, we will define a Basic Output. It will check whether the ping succeeds. If successful, it will output an info message (for debugging purpose). Otherwise it prints out an error message. if: $ping_result == True Message 1 (Information): Ping succeeded else: Message 1 (Error): Ping failed from $_device to main server


136 First create a Table node following the ping command and export the variable $ping_result to Table node. And then create a Basic Output node after Table node. In Output node, Click If row and define it in the right pane: $ping_result equal to true Drag and drop Alert from Action Node and define it in the right pane. Information: Ping Succeeded Drag else in the Logic Node to table below and then drag and drop an Alert under it. Click Alert2 and define it in the right pane. Error Message: Ping failed from $_device to main server Save and run the Qapp. A sample output is shown as the figure below: 131


 and the destination (the IP to")
137 10.2 Traceroute Command Now we will create a new Qapp to run a traceroute command from a core device to a main server. In the Canvas block of the new Qapp, create a Traceroute Command behind this node. Like Ping command, in most cases you only need to set the source (the device to run the traceroute from) and the destination (the IP to traceroute to). Ping from: loop device Ping to: (main server IP address) 132
138 Define Variables and Parser A default sample (Sample1) is automatically created for the traceroute command. This default sample parses the standard traceroute output and creates two local variables: $last_hop (string, the IP address of the last hop) and $traceroute_result (Boolean indicating whether the traceroute succeeds). In most cases, including our example, the default sample is sufficient. It can be used to parse standard format of the traceroute command: NB3-BST-CORE#Traceroute Protocol [ip]: Target IP address: Source address: Numeric display [n]: Timeout in seconds [3]: Probe count [3]: Minimum Time to Live [1]: Maximum Time to Live [30]: 30 Port Number [33434]: Loose, Strict, Record, Timestamp, Verbose[none]: Type escape sequence to abort. Tracing the route to msec 4 msec 0 msec 2 * * * 3 * * * Define Traceroute result analysis and output Like Ping Command, the analysis and output for the Traceroute command follows the same rule as the CLI command. For our example, we will define a Basic Output. It will check whether the Traceroute succeeds. If successful, it will output an info message (for debugging purpose). If not, it will check whether the last hop exist. If the last hop exists, give an error message that traceroute stops at last hop. If the last hop does not exist, give an error message that the traceroute failed at first hop: if: $TraceRT1.traceroute_result == True Message 1 (Informational): Traceroute succeeded. 133
: Traceroute from $_device to $main server failed at first hop First create a Table node following")
 and then respectively create an action node under each logic node.")
139 else if: $TraceRT1.last_hop!= None Message 1 (Error): Traceroute from $_device to main server stopped at $last_hop else: Message 1 (Error): Traceroute from $_device to $main server failed at first hop First create a Table node following the Traceroute Command and export the variables $traceroute_result and $last_hop to Table node. And then create a Basic Output node after Table node. In Output, create three logic nodes (if, else if and else) and then respectively create an action node under each logic node. If: $traceroute_result equal to true Alert1 (information): traceroute succeeded 134
: Traceroute from")


140 Else if: $last_hop Is not none Alert2 (Error): Traceroute from $_device to main server stopped at $last_hop Else: Alert3 (Error): Traceroute from $_device to $main server failed at first hop 135


141 10.3 SNMP Command and Merge Table Operator In this section, we are going to introduce two concepts: SNMP Command and an operator type- Merger Operator. SNMP command provides a flexible way for you to retrieve the data via SNMP OIDs. Merge Operator is used to merge the variables of two tables into one merged table according to the variables that the two tables both have SNMP Command Now we create a new Qapp to run SNMP command to retrieve device data. In the Canvas block of the new Qapp, create a SNMP Command behind this node. Enter an SNMP OID and the system will walk through this OID. For example, enter the OID to retrieve the interface name for each index. A sample is shown here. 136
142 For last number of each OID, it indicates an interface. For example, in the sample command, = OCTETS: FastEthernet0/0, here 1 is the index of FastEthernet0/ = OCTETS: Loopback11, 10 is the index of Loopback11 Highlight last number and define parser in Keyword Parser window. Click Define Variables under Paragraphs hyperlink to retrieve the interface name for each index. Set the paragraph identifier as $int:index = OCTETS: $intf_nm 137
143 The paragraph defined by this parser has only one line. Since the variable Var1 conflicts with the variable $index defined in Paragraph Identifier, delete the variable var1. The parser output will be a table with two columns: $index and $intf_nm Create another SNMP command after this node to retrieve the interface status. The SMNP OID to retrieve the interface status is

144 Retrieve the sample and define a paragraph parser with the following paragraph identifier: $int:index = INTEGER: $int:status The SNMP OID description for the interface operation status is: OID value: OID description: ifoperstatus OBJECT-TYPE SYNTAX INTEGER { up(1), down(2), testing(3) } ACCESS read-only STATUS mandatory DESCRIPTION "The current operational state of the interface. The testing(3) state indicates that no operational 139
145 packets can be passed." ::= { ifentry 8 } So $status = 1 means that interface is up, 2 means down and 3 means testing Merge Table In the Command 1, we have successfully obtained the interface status by an OID, but the annoying thing is that the interface name is indexed by number such as and so on. Actually, we could use Merge operator to convert the index to concrete interface name by merging the same row ($index) of two tables just created. For the SNMP Command to retrieve interface name, export the variables $index and $intf_nm to Table node. For the SNMP Command to retrieve interface status, export the variables $index and $status to Table1 node. Hover your mouse on any of the two tables and create Table Operator node. By default, 1 table input is selected. Hover your mouse over the other table, drag the arrow line, and make the line lead to Table Operator and you will find that the type has switched to 2 tables input. Click the drop-down menu of Operator and select Merge. Since we are going to merge data of two tables in to one table by a common variable of two tables, we select $index as the key for both tables. 140


146 Click Table2 node after Merge operator and the merged table is as follow: Now define a basic output so that an error message is created if the interface is down and an info message is created if the interface is up. 141

147 Save and run the Qapp. A sample result is shown as figure below: 11. Multiple Canvas Execution Flow and Loop Control So far all Qapps we have created just contain one Canvas. In this chapter we are going to create a more complex Qapp with multiple canvases. To understand the execution flow and loop control of multiple canvases, we will create a Qapp to monitor CPU usage for devices configured with OSPF routing protocol. This Qapp contains two canvases. The first canvas is to filter out OSPF devices and the second canvas is to monitor the CPU usage for OSPF devices. 142


148 11.1. Filter out Devices configured with OSPF Protocol Create a new Qapp and in the command node of Canvas block, enter the command show ip protocols. Select a device with OSPF routing protocol with the Retrieve Sample button, and an output like the following will appear in the left pane: Highlight area number of an OSPF and define parser as follows: 143


149 Export the variable ospf_as to the Table node Canvas Execution Flow In the first Canvas, we plan to filter out OSPF devices by checking whether the value of the variable ospf_as exists. In the Canvas, we will use the OSPF devices retrieved in Canvas1 and display their cpu usage. However in Qapp the variables defined or obtained in a Canvas can be referenced only inside the Canvas itself. To this problem, we could convert a general table to a global data type whose data can be referenced by any canvas in the Qapp. To check whether a variable exist and remove the variable if it is none, create a Table Operator and define it as follows: To convert a table to a global data table, create a Table Operator after a general table and select Convert operator. 144
 configured with OSPF by the variable ospf_as and in the second canvas, we will call the variables $_device in the global")

150 The sample global data table is shown as the figure below: 11.3 Call Variables in Global Data Table In Execution Flow window, create an another canvas and the system names the new canvas as Canvas1. In the first canvas, we have filter devices ($_device in global data table) configured with OSPF by the variable ospf_as and in the second canvas, we will call the variables $_device in the global data table. Double-click the Canvas1 block to enter Canvas1 window and set the Canvas by the following steps: (1) In the Canvas1 block, click Device Queue node and set it. Click the drop-down of Create Device Queue from and select Table option. Since there is only one global data table (Table1 of the first canvas Canvas ) in the Qapp, The system list it automatically in the second drop-down menu. 145

 In CLI command node, enter show process cpu. Retrieve a sample command and define parser.")
151 In the pane of variables list all variables of the global data table. Export the variable _device to device queue table, set this variable as device and click Apply button. (2) Click this node and set Device Selector. Since there is only variable, Device Selector automatically take it as input. (3) In CLI command node, enter show process cpu. Retrieve a sample command and define parser. Export the variable to Table node and create a Monitor output. As the way we have introduced before to define a monitor output, define analysis for the variable cpu_1m. 146

152 12. Canvas Block and Dialogue A Qapp to troubleshoot a general problem or document a complex design often requires the user input or control during the execution. For example, when you run a Qapp to highlight the BGP AS number, you may want the Qapp to allow you to input a specific AS number for highlighting rather than highlight all BGP AS. In this chapter, Dialog is introduced for this purpose. A dialog is a GUI component to receive the input from the user. Qapp Execution Flow can contain multiple Canvas and/or dialogs. Each Canvas has its own loop control. By default, a Qapp containing multiple Canvas blocks executes in the order defined by the overall execution flow, such as Canvas1, Canvas2, etc. However users can instruct it to skip a Canvas or jump into a specified Canvas Create a Dialog Let us create a simple Qapp to understand the basic concepts of a dialog: create an alert if a device CPU is higher than a threshold value. However instead of hard coding the threshold value, a dialog will pop up for you to enter the threshold value. 147
153 Create a new Qapp. The system automatically creates a canvas within Execution Flow. In Command node of the Canvas we can enter a CLI command, show process cpu and define the parser to retrieve the CPU as you know well. Now we will add a Dialogue block. As the dialog will be used to get the input of the threshold value from the user and it should be executed before Canvas. Delete default Canvas block in Execution Flow, hover your mouse cursor over Input block and drag to create a Dialog block. After creating the Dialog, create a Canvas block after the Dialog block Click the Dialog and in the Dialog pane are the visual programming interfaces for you to create the dialog, which contains four fields: 1. Toolbox: list all the components you can use in a dialog. 2. Action pane: list all operations you can perform on the components in a dialog and adjust the dialog background. 3. Working area: where you edit the controls to generate the dialog. 4. Properties pane: display and edit the properties of the selected component. 148


154 To add a component to a dialog, simply drag and drop the component from the toolbox to the working area and then edit the properties of this component in the properties pane. To delete a component, click on the component in the working area and press the Delete key in the keyboard. Drag and drop the Edit Control from the toolbox to a desired position of working area. Adjust the position and size of the control as you like. In the property pane, enter a name such as cputhreshold. No space or special characters are allowed for the object name. You can keep the default name. However it is recommended to change the name to something meaningful since this object will be referenced later. Now drag and drop a static text to the dialog to let user know what to enter in the edit control. Usually you do not need to change the name of a text object since it will be not referred later. In its property pane change the text to Please enter a CPU threshold: Adjust its size and position so that it is nicely aligned next to the edit object. Similarly add another text object after the edit object and change its text to %. You may also want to adjust the position of default OK button to finish the dialog. 149


155 In Canvas block, enter show process cpu in command field and define the keyword parser one minute: $int:cpu_1m%. Export the variable cpu_1m to Table node of the Canvas and in Output compare $cpu_1m against the threshold value the user will enter in the edit control object cputhreshold. The text value of an edit object is a string and can be retrieved by <Dialog name>.<edit control name>.text, for example, Dialog. cputhreshold.text. Therefore we fine logic node and action node in Output as follows: If: $CLI1.cpu >= $ Dialog. cputhreshold.text Message 1 (warning): The CPU is high! 150


156 Save and run the Qapp. Select two Cisco IOS devices as input devices. A dialog window opens as expected. Enter a threshold value such as 5 for testing and click the OK button. The system executes the Canvas and outputs warning message if its CPU is higher than the threshold value. 151
157 12.2 Dialogue Control Components The toolbox provides a list of controls or resources for you to create dialogs for different purposes. These components are like the standard programming development environment such as Visual Basic. They can be divided into three categories: Execution controls These components allow users to control the Qapp execution flow. They are displayed as a button. OK Cancel Exit Go to Continue Break Qapp will continue to run based on your selection. Qapp will continue to run but the selection does not take effect. Exit the Qapp. Exit from the current block and jump to the specified block. Qapp will stop running on the current device and continue to run on the next device in the device queue. Exit the current block. Basic components These components are similar to those in the Visual Basic. Four components, Combo Box, List Box, List Control and Filter Box, require variable definitions. For these four components, besides getting the user input from the dialog, their variable values are often set by the probes prior to it. Check Box Edit Control Combo Box Radio Button Static Text List Box List Control Filter Box For the user to select one from the multiple choices. For the user to enter a text which can be referred in the subsequent probes. A combo box consists of a list and a selection field. The list presents the options that a user can select, and the selection field displays the current selection. Similar to the check box. The static text which is often used to illustrate the meaning of other user editable control such as edit control. A control window containing a simple list of items from which the user can choose. It contains information about the programming elements used with list boxes. For the user to select one or more options. Extended Components These components call the system built-in components or operations to implement a specific function. 152
158 Select Device Control Select Interface Control Select File Control Select Folder Control IP Address Control Hyperlink Picture Control Open the built-in Select Device window Open the built-in Select Interface window. Select a file from the window file system. Select a file folder from the window file system. For the user to enter an Internet Protocol (IP) address in an easily understood format. Create a hyper link. Add a picture. The operations listed in the action pane are primarily used to align multiples control objects in the dialog. To align two or more objects, select them (press Ctrl and object to select multiple objects in a dialog) and select the align method in the action pane: Icon Effect Left Edges: align the left edges of all selected objects with the left-most object. Right Edges: align the right edges of all selected objects with the right-most object. Top Edges: align the top edges of all selected objects to the position of the top-most object. Bottom Edges: align the bottom edges of all selected objects with the lowest object. Adjust all selected objects to the same length according to the length of the last object you dragged to the dialog. Adjust all selected objects to the same length according to the length of the last object you dragged to the dialog. Adjust them to the same size according to the size of the last object you dragged to the dialog. The dialog patterns can be also set in the action pane: Icon Operation Add or remove the dotted filling patterns Add or remove the bounding box. To understand these components better, let us create a more complex Qapp to map and highlight BGP AS configurations and neighbors with the following steps: 153

159 (1) Use the BGP AS number from the configurations. (2) Create a dialog for the user to select the BGP AS number. (3) Create a map for the devices running BGP AS numbers and the related configurations. Creating a Qapp containing multiple blocks or Canvas requires careful planning works before writing the Qapp: for example, you have to think through how many canvas to be created; what functions each Canvas or dialog performs. In this example, we create three blocks in Execution Flow: Block 1(Canvas): use Configuration commands to get BGP AS numbers. Block 2(Dialogue): create a dialog containing a List Control for the user to select the AS numbers. The AS numbers available for the selections are set at the Block1. In order to set the values of the list control, you must add a list control to the dialog. Block 3(Canvas1): get the BGP AS numbers the user selected and map out the device and its BGP configurations if the device includes the BGP AS number the user selects Dialogue Control In this Qapp, since the primary purpose of Dialog is used to receive AS number from Canvas, let us complete components of Dialogue first in the execution flow so that in Canvas can push variable (AS number) to Dialogue. Drag and drop a List Control to the dialog. Enlarge the list control and you will see that there are two columns for the list control. Set its properties in the properties pane such as the name. There are two key properties: Multiselect: specifying whether the user can select multiple entries from the list. Here we keep 154

: Also")
160 the default value True since the user may want to create a map for multiple BGP AS devices. Variables: the variables related to the columns. Click the Add Variables link at the bottom of the properties pane to add a variable. You can add multiple variables for the list control. Here let us add a string variable AS. Add a static text field above the list control to tell the user what can be done for this object, such as Please select AS number(s): Also change the text of default OK button to Map and add a Cancel button. Align these objects nicely in the dialog. 155

161 Push Variable Value to Dialogue After finishing dialog settings, set Canvas block. In the Canvas, create a Configuration Command after this node. To retrieve the BGP AS number in Command, select the Filter parser and then built-in Design Reader Filter to filter out the BGP configurations. Under the filter parser, define a child keyword parser, router bgp $as Export the variable AS to Table node and then define output. Rather than define Alerts, Map or Highlight in Basic Output, we need to define a particular output to push the AS number retrieved in the Canvas to the List Control columns of Dialog for selection and this function can be achieved in Advanced Output by scripting. Create an Advanced Output and define scripts under Script for Row Data Analysis tab: if $as not in $Dialog.Listctrl.AS: $dialogvalue = {"AS":$as} $Dialog.Listctrl.AddRow($dialogvalue) (1) The AS variable of the list control must be referred $Dialog.Listctrl.AS. (2) $dialogvalue = {"AS":$as}, this script is to assign the value of the variable $as to the AS variable of the list control. (3) $Dialog.Listctrl.AddRow($dialogvalue), this script is to add a row for list control and the row value is the value of $as 156

 in $Dialog.Listctrl.Selected.")
162 Analysis and Output Based on Selection in Dialog In this step, we will set the Qapp to map out and highlight the devices if the device includes the BGP AS number selected in Dialog. In the Block 3, add a Configuration Command and define parser exactly as Block 1. Export the variables $as to Table node and create an Advanced Output for data in Table node. Define scripts under Script for Row Data Analysis tab as follows: if str($as) in $Dialog.Listctrl.Selected.AS: DrawDevice($this) HighlightDeviceEx($this,"BGP AS: "+str($as)) (1) if str($as) in $Dialog.Listctrl.Selected.AS: this script is to check whether the variable $as is in 157
 is one of NetBrain Built-in scripts, by this script, you could draw a device on map.")

163 the $Dialog.Listctrl.Selected.AS, which means that AS number is selected by the user. (2) DrawDevice($this). DrawDevice() is one of NetBrain Built-in scripts, by this script, you could draw a device on map. (3) HighlightDeviceEx($this,"BGP AS: "+str($as)): HighlightDeviceEx () is one of NetBrain Builtin scripts to highlight a device according to the string legend name. Here the legend name is the string $as Save and run the Qapp. The dialogs are displayed as follows: 158

164 A sample out is as follows: 13. Using Predefined Tables to Analyze Network Problems In Qapp, there is a special kind of command and this kind of command exists in table format. In writing Qapp, you could directly use and analyses the data in these tables without creating a command to retrieve and parser them again. 159


165 13.1 Understanding Built-in Data table There are six types of built-in data tables and they are respectively Route Table, ARP Table, MAC Table, CDP Table, STP Table and NCT Table. The data of these six tables can be generated in retrieving live data and system benchmark. Once these data are generated, you could use them directly in writing Qapp if needed. Retrieve Live Data 160

166 Server Benchmark 13.2 Use and Analyze Predefined Data Table in Qapp In this section, we are going to create a Qapp to highlight a device s interface with VRF information configuredand we will use these predefined tables. Create a new Qapp. In the Canvas block, instead of creating a Command node to retrieve a router s route table by CLI command show ip vrf, here we select the predefined table NCT Table after this node. 161


167 In NCT Table node, click the drop-down menu and select MPLS VRF. Click Retrieve Sample button and select a device with VRF information. In the table of the right pane, a sample vrf table is displayed. By default, the data source is Live Network, and you could select Current Baseline from the drop-down menu if you have run server benchmark before. Mouse over the Command_Table node. Click and drag the mouse from the right edge of Command_Table node to the right side. Release the mouse and select the Advanced Output option in the popped-up menu In the Advanced Output, we define Hightlight as follows: if $Interface is not None: DrawDevice($this) HighlightInterface($this,$Interface,"VRF") 162
.")
 In str:ocurdev, enter the current")
168 The above scripts mean that if a devices has interfaces configured with VRF, the Qapp draw the device on a map and hightlight the interface with VRF configured. When you enter a netbrain built-in function in script window, the system will pop up all related functions and thses functions calling style and you could follow the style to enter scrpits). For example. When HightlightInterface is entered, the system pop up the style of this function as follow: HightlightInterface(str:oCurDev, Str:sIf, str:legend, str:smap="",) In str:ocurdev, enter the current device that the Qapp is executed on.(in most cases, the current device is $this) Str:sIf means the device s interface and enter the interface you want to highlight. str:legend means the map legend and the Qapp will display the legend name and hightlight map based on legend. There are other fields following these three most important fields, since they do not affect our hightlight, just leave them empty. Save and run the Qapp. A sample result is as follows: 163
169 14. Using Qapp to Analyze Data of Imported Table In previous sections, all Qapps we have created are based on Device Input and the devices we have input at Qapp execution are directly from workstation. In this section, we will introduce how to create a Qapp based on Table Input. With Table Input, you could import a CSV with device information, analyze the information and give analysis results by Qapp. In this section, we will import a table with core devices information to Qapp and create a Qapp to check these devices version number for upgrade reference and export devices with relatively lower version. 164
 Create a table from New button Click New button and a table with Name Table will be created.")

170 14.1. Define Table input Create a new General Qapp. In Execution Flow window, click Table Input Tab. There are two ways to create a table: New and New from CSV. (1) Create a table from New button Click New button and a table with Name Table will be created. In the table of the right pane, you could edit this table and fill in information. For example, click the default header name Col1 and modify it to Hostname. Click and create a new column by Static Variable For example, create a column by Static Variable and modify the default header name var1 to IP. For imported table, it value type is string by default and you could click the drop-down menu of 165

 you have edit in the table.")
171 value type to define it if necessary. For example, set the value type as ip address for IP column. If you check the checkbox Allow editing at run time, row values such as IP address and Device are changeable and you could modify them at Qapp execution. After creating a new table and finishing editing row values, we need to go to Device Input tab and set the Qapp to obtain devices from imported table. Under Device Group type, select the option Import from a table defined in Table Input. When you run the Qapp, the Qapp can automatically obtain the device(s) you have edit in the table. You could also click option button to modify the row values. (2) Create a table from New from CSV button You could also create a table by importing a table to Qapp. Click New from CSV button and Import Table window opens. 166
=3 Management IP(ip address) BJ-R1 10.10.10.1 BJ-R2 10.10.10.2 BJ-R3 10.10.10.3 The First Row: the description of this table.")
172 To import a table successfully, there are some requirements about the format of imported table:!! core devices and each device's Management IP ##table1 Device count_device(int)=3 Management IP(ip address) BJ-R BJ-R BJ-R The First Row: the description of this table. The description contents must start with!!. This row is optional and your table do not have to have this row. The Second Row: the first column of the second row is the table name that starts with ## and it is required. The second column and its subsequent columns of the second row could be the attribute about the table, such as row counts. The Third Row: Header of each column, such as hostname, IP. The value type of imported headers are string and please modify them after importing the table. In our sample, we are going to import a table with core devices. To import the table successfully, fill in table content as follows: 167

173 Import the table to Qapp and it displays as shown in the figure below: After importing the table successfully, go to Device Input tab and check the option Import from a table defined in Table Input so that the Qapp could obtain devices defined in the table. 168


174 If there are multiple tables, you need to define the table that you want to input in the step 1. In the step2, define which column is used as the index of device Define Variables and Parser for Imported Data In this step, we are going to define variables for the data in table and define parser to retrieve wanted variables and values. In Canvas, click Device Queue node and select to create Device Queue from Table. Export the variables that you are interested with to device queue table. In this sample, export Hostname and IP. Click the variable Hostname and check the checkbox Set as device to 169

175 set Hostname column as device list. After finishing settings, click Apply button and the device queue table will display as follows: Click this node and select Hostname as device selector. Since there is only one device column, the system selects Hostname by default. In Command node, input show version and define variable and parser as follows: Version $double:version\(3\), RELEASE Export the variable version to table node. 170


176 14. 3 Analyze Table Data In this step, we are define analysis and export the version number of devices defined in the imported table to a CSV file. Since Export CSV is only available for a global data table, it needs to convert the table to global type by the table operator Convert. After Table1 (a global table), create an Output node and define it as follows: If $_device is not none Create a CSV Export 171


177 Save and run the Qapp. The Qapp automatically obtains the devices defined in the input table. 15. Using Qapp in Multi-vendor environment Quite often, in our network, there are devices from different vendors or even different device types from one same device vendor. To resolve network problems in multi-vendor network, it is relatively complicated since we sometimes need to define different CLI commands based on different device vendors or different types from one same vendor. To tackle with this challenge, Qapp integrates a multi-vendor platform by Device Selector, allowing users to writing one Qapp that could be applicable to multi-vendor devices. 172

178 In this chapter, we will create a Qapp to highlight devices(cisco IOS XR, Cisco Nexus switch and Cisco IOS Router Switch) configured with EIGRP routing protocol. We are going to check whether a Cisco IOS XR is configured by CLI command show ip protocols, Cisco Nexus switch by show ip eigrp and Cisco IOS Router Switch by show ip protocols Set Branch Conditions for Different Device Types (Vendors) Create a new General Qapp. In the Canvas block, click this node. By default, a Qapp has one branch named as Default. Click Insert Branch button to create another branch. For three types of devices, we here create three branches. Click one branch tab and edit it accordingly. For Cisco IOS Router Switch, define as follows: 173


179 For Cisco Nexus switch, define it as follows: For Cisco IOS XR, define it as follows: 174
180 15.2 Define Different Commands for Different Device Types (Vendors) Based on different device types/vendors, we could respectively define different commands for them. When a device is passed to Device Selector, the Device Selector will check the device type of this device and decides to use which branch (which command node). In our sample, after this node, we define three command nodes. For Cisco IOS Router Switch, select Cisco IOS Router Switch in the drop-down menu of Apply to Device Selector Branch: and enter CLI command show ip protocols ; For Cisco Nexus Switch, select Cisco Nexus Switch in the drop-down menu of Apply to Device Selector branch: and CLI command show ip eigrp For Cisco IOS XR, select Cisco IOS XR in the drop-down menu of Apply to Device Selector Branch: and enter CLI Command show ip protocols. After defining device selector branch for a command, the realtion between a device selector branch and a command in the flowchart is show as the figure below: 175


181 Highlight EIGRP As number and define parser to retrieve the AS value. Cisco IOS Router Switch: Cisco IOS XR: Cisco Nexus switch: 176


182 Click any of these three command nodes and create a Table node. Hover your mouse over the one of the other two command nodes, drag the arrow line, and make the line lead to Table Node. Export the variable AS to Table node respectively for these three command nodes. Please note that for different command nodes, it is suggested to define the variable with same name. For a device, it just belongs to one device type or device vendor and will therefore pass one branch. That is why it is ok to define just one table node for multiple device type or vendors. Next, we could define an output node and highlight the devices with EIGRP routing protocols. If $AS is not none (which means that a device is configured with EIGRP) 177

183 Then map the device and Highlight AS number: Save and run the Qapp, a sample output is as follows: 178

 for")
184 16. Qapp Management 16.1 Degug Qapp Debug Qapp function is to execute Qapp node by node and check whether the procedures in Qapp run correctly. During Debug, you can check the correctness of any table data visually by click any canvas node. Here we take the Qapp created in Chapter 15 (Qapp to highlight devices configured with EIGRP routing protocol) for example. (1) To debug a Qapp, click the Debug icon at the top menu bar. The Qapp will run in debug mode. 179


185 (2) Click the Continue (F5) button and Debug Input dialogue box pops up. Click button to select devices for debug and click OK to start debug. (3) To view detail of each step, click Step Into (F11) and the Qapp debug will display the step it is processing. Click the V button to extend more detailed debug information. In Canvas block, keeping click Step Info(F11), you could view what the Qapp have done at each node in the Canvas. For example, at this node, the devices match the branch Cisco IOS Router Switch and the Cisco IOS Router Switch tab are highlighted and its content are in grey; 180
 till the Qapp goes to Output node.")
186 By the debug, you will find that a Qapp just loop one row of the Device Queue table at one time. In our sample, we have selected two devices. It first loop the first row BJ*POP and then loop the second row BSTX.Core after finishing retrieving and analyzing the value of BJ*POP. Keep pressing Step Info(F11) till the Qapp goes to Output node. If Qapp works properly, it will give out analysis results according to your settings in Output node. For the devices we have selected for debug, the sample result is as follows: 181
 to step over the current step and Step Out (F12) to step out of the current step. 16.")
187 Click View Logs hyperlink, you could click execution logs of the Qapp and data table retrieved during execution process. During debug, you could click Step Over (F10) to step over the current step and Step Out (F12) to step out of the current step Qapp Task Management Qapp Task is used to group Qapps together for a common task or technology. The Device and Table Input for each Qapp can be defined in advance so that Qapps can be run directly. If import a map to task, the devices on map will be considered as Device Input, and the execution result will be displayed on this map directly. It takes two steps to create Qapp Task: 1. Define Task Under Qapp tab, click New Task in Qapp Task Operation ribbon to open Qapp Task Properties window. 182


188 Name: by default, the name of the task is Task1. You could replace it with a more meaningful name. Description: To describe the function of Qapp in this field. Qmap Page: you could save important devices to a map. Import the map to a task and the task will automatically take devices in the map as device input at execution. Add Qmap: Click Add Qapp button and the Run Qapp window opens. Select one or multiple Qapps to the task. Device Input: after adding Qapps to task, define devices on which you want to run the task. If you have imported a map by Map Page, the task will display From Map. Besides the devices on a map, you could also add more devices. 183


189 2. Save and run the Task Click OK and save the task. In Qapp Task Operation ribbon, click Run Task and select the task that you want to run. Click Run button, a sample out is as follows: 184


190 Note: (1) In the Qapp Center pane, right-click a file folder, such as Built-in Files, Shared Files or My Files and select Import Files to add a local task file to the Qapp Center for management. (2) You could follow the same way to create General Qapp Task to create Monitor Qapp Task 16.3 Qapp Recommendation Qapp Recommendation is to recommend one or multiple frequently used Qapps for certain devices. When running a Qapp, the system will prompt recommended devices related to the Qapp for reference. 185

191 When right-clicking a device to run a Qapp, recommended Qapps related to the device will be displayed in the menu. 186
192 To create Recommendation Qapps for certain devices, under Qapp tab, click Recommendation in the Other ribbon. 187

193 Click Add button and Add Shared Recommendation window opens. In comment field, enter description about the recommended Qapp, and under Device, click Add button to add recommended devices. 188


194 Under Qapp, click Add button to add recommended Qapps in Qapp Center for the recommended devices. Please note that only built-in and shared Qapp in Qapp Center is available for recommendation. 189


195 Click OK button and in Qapp Recommendation window click close to save and exit. Run any Qapp you have recommended and under Recommend Qapp check the recommended devices for the Qapp. Right-click the recommended devices map, in the menu view recommended Qapps for the device. The number behind is each recommended Qapp is the counts the Qapp run on the device. 190
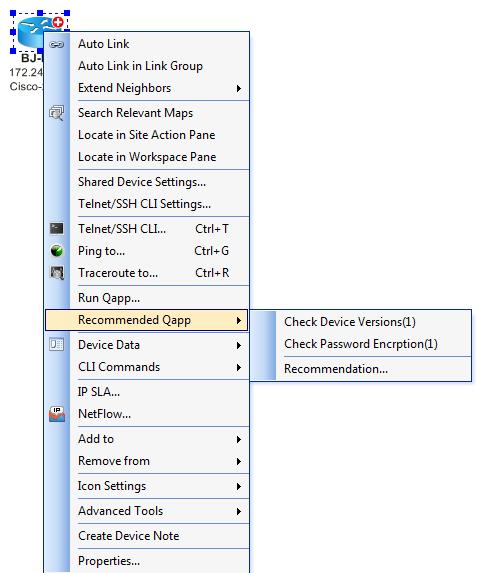
196 191
197 Appendix 1. NetBrain Built-in Variables NetBrain Built-in Variables: Variable Name Description Note $_device A global PyDevice object It is a simple PyDevice representing the device on object and not an array of which the Qapp is run. PyDevice objects. The Qapp is automatically looped through each of the selected devices and $ _device is the device on which the Qapp is run now. $_device_queue A variable representing the device queue table that the Qapp loops on. $_command The Command that the output is based on 192
198 Appendix 2. NetBrain Built-in Functions 2.1 Global functions: General Functions Function Name Description Example list() PyTable() PyIP(stringip) Create an empty Array, same as the function List() of Python script. Create an empty table. It returns a PyTable object. Create a PyIP object. The input string can have the following formats: / $list1 = list() $Table1= PyTable () $ip1 = PyIP( ) PyMac(strmacaddress) PyInterface(stringsIP) PyInterface( Create a PyMac object. The input MAC address string can have the following formats: aaaaaa.bbbbbb aaaaaa-bbbbbb aaaaaabbbbbb aaaaaa:bbbbbb aaaaaa/bbbbbb aaaa.bbbb.cccc aaaa-bbbb-cccc aaaabbbbcccc aaaa:bbbb:cccc aaaa/bbbb/cccc aa.bb.cc.dd.ee.ff aa-bb-cc-dd-ee-ff aa:bb:cc:dd:ee:ff aa/bb/cc/dd/ee/ff Create a PyInterface object from an IP address. Create a PyInterface object from a hostname and an interface name. $mac1= PyMac( aaaaaa.bbbbbb ) $interface1 = PyInterface( ) $interface1 = PyInterface( R1, e0/0 ) 193
199 stringsdevice, stringsinterface) PyDevice(stringdev) Create a PyDevice object with a hostname. $dev1 = PyDevice( R1 ) GetMax (list:array) Get the maximum value from a list. List1 = [1,2,4,5,6] $variable1 = GetMax(List1) GetMin (list:array) Get the minimum value from a list. List1 = [1,2,4,5,6] $variable1 = GetMin(List1) GetInterface(string sip) Get an interface object from an IP address. $inteface1 = GetInterface( ) GetDevice(string snameorip) Get a device object by the hostname or IP address. $device1 = GetDevice ( ) $device2 = GetDevice ( R1 ) GetDevice(PyIP IP) NewDeviceAttribute(sFiel d) NewInterfaceAttribute(sF ield) Get a device object by the IP address (the input is a PyIP object, not a string). Add a new customized attribute for the device properties. Add a new customized attribute for the interface properties. $ip1 = PyIP( /24 ) $device1 = GetDevice ($ip1) NewDeviceAttribute( Field 1 ) NewInterfaceAttribute ( Field1 ) NewModuleAttribute(sFi eld) Add a new customized attribute for the module properties. NewModuleAttribute ( Field1 ) SetDeviceAttribute(sDev Name, sfield, svalue) Set the value of a customized attribute for a device. SetDeviceAttribute( R1, Field1, value1 ) SetInterfaceAttribute(sD evname, sifname, sfield, svalue) SetModuleAttribute(sDev Name, smodule, sfield, svalue): Set the value of a customized attribute for an interface. Set the value of a customized attribute for a module. SetInterfaceAttribute ( R1, e0/0, Field1, value1 ) SetModuleAttribute ( R1, slot1, Field1, value1 ) 194
200 IfNameFullToBkn(sIfNam e) Return the short interface name given a full interface name. $ifname = IfNameFullToBkn( ethernet 0/0 ) $ifname will be e0/0 IfNameFullToMib(sIfNam e) IfNameBknToFull(sIfNam e) IfNameBknToOriFull(sIfN ame) IfNameBknToMib(sIfNam e) IfNameMibToFull(sIfNam e) IfNameMibToBkn(sIfNam e) IfNameBkn(sDev, sifname) Return the MIB interface name given a full interface name. Return the full interface name given a short interface name. Return the original full interface name given a short interface name. Return the MIB interface name given a short interface name. Return the full interface name given a MIB interface name. Return the short interface name given a MIB interface name. Return the short interface name given a device and a long interface name. $ifname = IfNameFullToBkn( ethernet 0/0 ) $ifname will be eth0/0 $ifname = IfNameFullToBkn( e0/0 ) $ifname will be ethernet0/0 $ifname = IfNameFullToBkn( e0/0 ) $ifname will be ethernet0/0 $ifname = IfNameFullToBkn( e0/0 ) $ifname will be eth0/0 $ifname = IfNameFullToBkn( eth0/0 ) $ifname will be ethernet0/0 $ifname = IfNameFullToBkn( eth0/0 ) $ifname will be e0/0 $ifname = IfNameFullToBkn( R1, ethernet0/0 ) $ifname will be e0/0 MapAutoLayout( smap='', spage='', npagetype=1) Auto layout a map page. The inputs are: smap: the full filename of the map. If it is empty, then the function is applied to the current map; if no current map is open, the system will create a new map. spage: the name of the page. If it is empty, the function will apply to the current page of the current map; if no MapAutoLayout( c:\\test.q map, L3 Page1 ) 195
201 f current page exists, the function is applied to the first page of the map. npagetype : the page type (int) 1 for L3 page (default). 2 For L2 page. MapAutoLink( smap='', spage='') DrawDevice( Dev, bautolink=true, smap='', spage='') DrawDeviceIf(Dev, sif, smap='', spage='') DrawNeighbor( Dev, snbrdevice, smap='', spage='') Autolink a map page. Refer to the function MapAutoLayout for the inputs. Draw a device in a map page. Dev: the string (device name) or PyDevice object. bautolink: autolink between this device and other devices already in the map page. smap and spage: see the function MapAutoLayout. Draw a device interface in a map page. Dev: the string (device name) or PyDevice object. sif: the interface name (string). smap and spage: see the function MapAutoLayout. Draw a device and its neighbor in a map page. Dev: the string (device name) or PyDevice object. snbrdevice: the neighbor device name (string). smap and spage: see function MapAutoLayout. MapAutoLink ( c:\\test.qmap, L3 Page1 ) DrawDevice( R1, True, c:\\test.qmap, L3 Page1 ) DrawDevice( R1, e0, c:\\test.qmap, L3 Page1 ) DrawNeighbor ( R1, R2, c:\\test.qmap, L3 Page1 ) DrawIfNeighbor( Dev, sif, snbrdevice, smap='', spage='') Draw an interface and the neighbor device connected by the interface in a map page. Dev: the string (device name) or PyDevice object. sif: the interface name (string). SNbrDevice: the name of the neighbor device (string). If it is empty, only the interface is drawn. smap and spage: see function MapAutoLayout. DrawIfNeighbor ( R1, e0, r2, c:\\test.qmap, L3 Page1 ) 196
202 DrawDeviceNote( Dev, snote, smap='', spage='') DrawDeviceNoteEx( Dev, stitle, snote, nstyle, smap='', spage='', npagetype=1) DrawMapNote( snote, smap='', spage='' ) DrawMapNoteEx( stitle, snote, nstyle, smap='', spage='', npagetype=1 ) DrawDeviceSmartNote( Dev, stitle, snote, nsntype = SN_APPEND, bexpand = False, fontcolor = RGB(0,0,0), fontsize = 8, fontalign = ALIGN_LEFT, framecolor = RGB(0,0,0), backgroundcolor = RGB(255,255,128), smap='', spage='', npagetype=1): Draw a device note in a map page. Dev: the string (device name) or PyDevice object. snote: the note content (string). smap and spage: see the function MapAutoLayout. Draw the device note in a map page. Dev: the string (device name) or PyDevice object. stitle: the note title (string) snote: the note content (string) nstyle: the map note style (int): 0 is the error (read), 1 is the warning (green) and 2 is information (black) smap, spage and npagetype: see the function MapAutoLayout. Draw a map note in a map page. snote: the note content (string). smap and spage: see the function MapAutoLayout. Draw the map note in a map page with the title and customized style: stitle: the note title (string) snote: the note content (string) NStyle: the map note style (int). 0 is the error (read), 1 is the warning (green) and 2 is information (black). smap, spage and npagetype: see the function MapAutoLayout. Draw the device note in a map with customized style of font, color and display. Dev: the string (device name) or PyDevice object. stitle: the note title (string) snote: the note content (string) nsntype: display method of new device note (int) : 0 (default value): Only two duplicated device note entries can be shown within device note field, each with the time stamp that the entry was generated. If a DrawDeviceNote ( R1, My R1 Note, c:\\test.qmap, L3 Page1 ) DrawDeviceNoteEx( R1, Title, My R1 Note, 0, c:\\test.qmap, L3 Page1, 1) DrawMapNote ( My Map Note, c:\\test.qmap, L3 Page1 ) DrawMapNoteEx( Title, M y Map Note, 2, c:\\test.qmap, L3 Page1 ) DrawDeviceSmartNote( R1, Title, My Map Note, snote, 0, False, RGB(0,0,0), 8, 0, RGB(0,0,0), , c:\\test.qmap, L3 Page1 ) 197
203 new device note entry is duplicated with an existing note, the system will only update the time stamp of the 2nd duplicated entry. The new device note entry that is not duplicated with any of the existing entries will be appended at the end with the time stamp. 1: new generated device note entry will overwrite the exiting device note entry no matter it is duplicated or not. 2:Only one duplicated device note entry can be shown within device note field. If the new device note entry is duplicated with existing note, the system will update the time stamp of the existing entry. New device note entry that is not duplicated with any of the existing entries will be appended to the end with the time stamp. bexpand: show the device note in the collapse mode or expanded mode. True: expanded mode. False (default value): the collapsed mode. fontcolor: Define the fond color. fontsize: Defines the font size. fontalign: Defines the alignment method. ALIGN_LEFT = 0 CENTER = 1 ALIGN_RIGHT = 2 framecolor: Defines the color of the frame. backgroudcolor: Defines the background color. Note: To define the color for fontcolor, fontsize and framecolor, you can use the format of RBG(a,b,c), or use the RBG int calculated by these three primary colors. Frequently used RGB Int are shown as below: 198
204 DrawHyperLink( sdisplay, surl, smap='', spage='') DrawProcedureHyperLin k( sdisplay, listproc, IsAttachMap=False, smap='', spage='') DrawHop( Dev0, If0, Dev1, If1='', stext='', nstyle=0, smap='', spage='') BLACK_COLOR = 0 RED_COLOR = 255 ORANGE_COLOR = GREEN_COLOR = YELLOW_COLOR = BLUE_COLOR = PINK_COLOR = CYAN_COLOR = WHITE_COLOR = smap, spage and npagetype : see function MapAutoLayout Draw a hyperlink in a map page. sdisplay: the content displayed in the hyperlink (string). surl: the URL (string). smap and spage: see function MapAutoLayout. Draw a hyperlink pointing to the procedures in a map page. sdisplay: the content displayed in the hyperlink (string). listproc: the list of procedures and their input variables. IsAttachMap: whether to attach the procedures to the map. smap and spage: see function MapAutoLayout. Draw a path hop in a map page. Dev0: the source device name (string) or PyDevice object. If0: the output interface name of the source device (string). Dev1: the destination device name (string) or PyDevice object. If1: the input interface name of the destination device (string). stext: the content of the hop (string). DrawHyperLink ( My Map Hyperlink, c:\\test.qmap, L3 Page1 ) $Procedure1=[ c:\\procedur e1.qapp, { SrcIP : }] $Procedure2=[ c:\\procedur e2.qapp, { DestIP : }] $ Procedurelist = [$Procedure 1,$ Procedure 2] DrawProcedureHyperLink ( Run Procedure1, $Procedurelist, False, c:\\test.qmap, L3 Page1 ) DrawHop( r1, e0, r2, e1, , -1, c:\\test.qmap, L3 Page1 ) 199
205 HighlightDevice( Dev, slegendname, smap='', spage='') HighlightInterface( Dev, sif, slegendname, smap='', spage='' ) DeleteDeviceNoteInMap( Dev, stitle, snote, smap='', spage='', npagetype=1 ): GetRootDir() GetCurrentWorkspaceDir ( ) GetL2NeighborIPs(sDevic e, sinterface) GetL2Neighbors(sDevice, sinterface) sstyle: the style of the hop (string). Can be -1 (random) or 0-4 (different built-in styles). smap and spage: see function MapAutoLayout. Highlight a device in a map page. Dev: the string (device name) or PyDevice object. slegendname: the name of the legend. smap and spage: see function MapAutoLayout. Highlight an interface in a map page. Dev: the string (device name) or PyDevice object. sif: the interface name (string). slegendname: the name of the legend. smap and spage: see function MapAutoLayout. Delete a device note in a map page. Dev: the string (device name) or PyDevice object. stitle: the note title (string) snote: the note content (string) smap, spage and npagetype : see function MapAutoLayout. Return the full directory of the NetBrain OE Workstation installation folder. Return the full directory of the current workspace folder. Get the IP address(es) of L2 neighbor(s) from a hostname and an interface name. L2 neighbors are retrieved from the backend L2 topology. The return variable is a list and each entry within the list is a PyIP. Get the interface name(s) of L2 neighbor(s) from a hostname and an interface name. L2 neighbors are retrieved from the backend L2 topology. The return variable is a list and each entry within the list is a PyInterface. HighlightDevice ( r1, BGP 100, c:\\test.qmap, L3 Page1 ) HighlightInterface ( r1, e0, Ospf 1, c:\\test.qmap, L3 Page1 ) DeleteDeviceNoteInMap ( R1, Title, My R1 Note, c:\\test.qmap, L3 Page1, 1) $dir = GetRootDir() $dir = GetCurrentWorkpaceDir () $IPs = GetL2NeighborsIPs( R1, e0/0 ) $Interfaces = GetL2Neighbors ( R1, e0/1 ) 200
206 GetDevicesInLan(sLan) Get the devices within a LAN segment from the workspace data. The return variable is a list and each entry within the list is a PyDevice. $Devices = GetDevicesInLan( /24 ) GetConnectedSwitchPort (sdevice, sinterface) Get the interface name(s) of L2 neighbor(s) from a hostname and an interface name. L2 neighbors are retrieved from the backend L2 topology. The return variable is a list and each entry within the list is a PyInterface. GetConnectedSwitchPort ( R1, e0/1 ) AddSwitchConn(strDevic e1, strport1, strdevice2, strport2, bindiscover) AddOnIpMacTable(strLan, strip, strmac, stralias, strgateway, istatus, strdevicename, strinterface, iservertype, iswitchtype, strswitchname, strportname, iuserflag, ivlan) GetARandomDevice() Add a switch connectivity entry to the existing switch connectivity table. bindiscover: Represents whether the entry was added via the live L2 discovery. You can set this to be False for manually added entries. Add an entry to the one-ip-table. strlan: the LAN segment to which the entry belongs. strip: the IP address of the entry. strmac: the Mac address of the entry. stralias: the alias of the entry. strgateway: the gateway device of the IP to be added. istatus : strdevicename: the switch name connected to the IP address. strportname: the port name connected to the IP address. iuserflag: can be 0 (manually added) or 1. (auto discovered). ivlan: VLAN number to which this IP address belongs. Get a random device from the workspace. The return variable is a list; the only entry within the list is a PyDevice. AddSwitchConn( switch1, port1, switch2, port2,fal se) AddOnIpMacTable ( /24, , FFFF::FFF::FFFF, alias1, gate1,1, r1, e0/1, 1,1, switch1, port1, 0,100) $device1 = GetARandomDevice() 201
207 GetRandomDevicesInIsla nd() FindVendorbyMac(mac): Get random devices from the workspace, one random device will be select for each island automatically created by the system. The return variable is a list; each entry with the list is a PyDevice. Get the vendor information from the MAC address. $devices = GetRandomDevicesInIsland $string1 = FindVendorbyMac ( FFFF::FFF::FFFF ) ReadFile(sFileName, PathType = 0): WriteFile(sFileName, scontent, Mode= w, PathType = 0): GetCurrentRT(dev, vrf = "") Return the file content from a given path. The return value is None if the system fails to read the file. sfilename: the path of the file, can be absolute path or relative path depending on the input value given by PathType. PathType: 0: the absolute path. 1: the relative path relative to RootDir, see function GetRootRir function. 2: the relative path relative to the workspace directory. Write the content to a file. The return variable is True or False indicating whether the operation is successful. ename: see function ReadFile. ontent: The content to be written to the file. de: The method to write the content. w : Overwrite the existing content within the cified file with the input content. ap : Append the input content to the end of the ting content within the specified file. thtype: see function ReadFile. Return the (vrf) routing table for the device. The routing table is retrieved from the live network. The return variable is a PyTable. $content1 = ReadFile( c:\test.txt, 0) WriteFile ( c:\test.txt, ddddfssdfsd, w, 0) GetCurrentRT( r1, red ) GetBaselineRT(dev, vrf = ""): Return the (vrf) routing table for the device. The routing table is retrieved from the current workspace. The return variable is a PyTable. GetCurrentRT( r1, red ) 202
208 DeleteMapNote(sTitle, snote, smap='', spage='', npagetype=l3page) HighlightDeviceEx(Dev, slegendname, color = RANDOM_COLOR, bappend = True, smap='', spage='', npagetype=l3page) Delete a map note in a map page. snote: the note content (string). smap, spage and npagetype : see function MapAutoLayout. Highlight a device in a map page. This is an improved function for HighlightDevice(). You can append highlight color to existing highlight color. Dev: the string (device name) or PyDevice object. slegendname: the name of the legend. Color : Define the color of the highlight line, by default it is the random. See function DrawDeviceSmartNote on how to define color code. bappend: Whether to append the highlight color. smap, spage and npagetype : see function MapAutoLayout. DeleteMapNote( title, note content ) HighlighDeviceEx( r1, r1_legend, 255) DrawInterfaceNoteEx(De v, sif, stitle, snote, fontcolor = RGB(0,0,0), fontsize = 8, fontalign = ALIGN_LEFT, framecolor = RGB(0,0,0), backgroundcolor = Draw interface note in a map page. Dev: the string (device name) or PyDevice object. sif: the interface name (string). stitle: stitle: the note title (string) snote: the note content (string) tcolor, fontsize, fontalign, framecolor and RGB(255,255,128), kgroundcolor: see function smap='', spage='', wdevicesmartnote npagetype=1) ap, spage and npagetype : see function AutoLayout. DrawInterfaceNoteEx( R1, e1/1, Title, My Map Note, RGB(0,0,0), 8, 0, RGB(0,0,0), , c:\\test.qmap, L3 Page1 ) DrawInterfaceSmartNote ( Dev, sif, stitle, snote, nsntype = SN_APPEND, bexpand = False, fontcolor = RGB(0,0,0), fontsize = 8, fontalign = ALIGN_LEFT, framecolor = RGB(0,0,0), backgroundcolor = RGB(255,255,128), smap='', spage='', npagetype=l3page): Draw interface smart note in a map page. This is an improved function for DrawInterfaceNoteEx(). Dev: the string (device name) or PyDevice object. sif: the interface name (string). stitle: the note title (string) snote: the note content (string) other arguments: see function DrawDeviceSmartNote() DrawInterfaceSmartNote( R1, e1/1, Title, My Map Note, snote, 0, False, RGB(0,0,0), 8, 0, RGB(0,0,0), , c:\\test.qmap, L3 Page1 ) 203
209 DeleteDeviceNoteInMap ( Dev, sif, stitle, snote, smap='', spage='', npagetype=l3page ) Delete a device note in a map page. Dev: the string (device name) or PyDevice object. sif: the interface name (string). stitle: the note title (string) snote: the note content (string) smap, spage and npagetype : see function MapAutoLayout. DeleteInterfaceNoteInMap( bjgw, f0/0, t1, n1 ) HighlightNeighbor( ssrcd Highlight the neighboring device and draw an ev, sdesdev, slname, arrow from the source device to the ssrctext = '', sdestext = neighboring device. '', color = cdev : Source device. RANDOM_COLOR, esdev: Destination device. bsingle = False, Name: The legend name. nlinkthick = 2, ctext: Text on the source arrow. nlinestyle = PS_DOT, estest: Text on the destination arrow. smap='', spage='', or: Define the color of the highlight line, by npagetype=l3page ) ult it s random. See function wdevicesmartnote for how to define color e. ngle: defines the line type (bool). ue: one-arrow line pointed to the destination ce. se: two-arrow line pointed to the source and ination device. nkthick: Defines the width of the line. nestyle: Defines the style of the line: S_SOLID(0) S_DASH(1) S_DOT(2, default)... S_DASHDOT(3) _._._._ S_DASHDOTDOT(4) _.._.._ ap, spage and npagetype : see function AutoLayout. HighlightNeighbor( r1, r2, legend, r1_txt, r2_txt ) HighlightInterfaceEx( Dev, sif, slegendname, color = RANDOM_COLOR, smap='', spage='', npagetype=l3page ) Highlight an interface in a map page. This is an improved function of HighlightInterface. Color: define the color of the highlight line. The default value is random. See function DrawDeviceSmartNote for how to define color code. HighlightInterfaceEx( bjgw, g0/0, legend, RGB(255,0,0) 204
210 CompareText(sDev1, stitle1, scontent1, sdev2, stitle2, scontent2) DRCompare(sDev1, sfiltername1, sdev2, sfiltername2) DrawEndSystemFromOn eip( sipormac, smap='', spage='', npagetype=l2page ) For other arguments, see function HighlightInterface. Check whether two paragraphs of texts are the same. sdev1: the source device to be compared. It can be the string (device name) or the PyDevice object. stitle1: the title of the device. scontent1: the contents of the source device. sdev2: the other device to be compared. It can be the string (device name) or the PyDevice object. stitle2: the title of the other device scontent2: the contents of the other device. Check whether the config lets for two devices filtered by design reader are same. ev1: the source device to be compared. It can be string (device name) or the PyDevice object. tername1: the Design Filter name applied to source device device1. ev2: The other device to be compared.. It can he string (device name) or the PyDevice object. tername2: the Design Filter name applied to ce2. Draw an end system to a map page. OrMac: the IP address (string) or MAC address ng) of the device. ap and spage: see function MapAutoLayout. npagetype: the page type (int). End system will be drawn on L2 map page by default. CompareText( txt1, title1, content1, txt2, title2, content2 ) DRCompare( bjgw, Full Configuration, LA_Core, Full Configuration ) DrawEndSystemFromOneI p( ) AddDeviceToDeviceGrou Add a device to a device group. p(dev, strgroupname, v: The string (device name) or PyDevice object. ntype = None) Strgroupname : device group name. ntype: the property of device group. It can be 1 (static) or 2 (dynamic). AddDeviceToDeviceGroup( r1, dg1, 1) 205
211 ET_AddDevice(sDev, itype) ET_AddDMVPN(devnam e, subnet) Note: the device group must exist in the workspace. Add a new device to the topology. vice Name: the hostname of the device. vice Type: the type of the device you want to (int). You need to enter the integer that esents the device type, refer to section endix 2H for device type code. Add a new DMVPN cloud to the topology. vname: the name of the DMVPN cloud bnet: the subnet address of the DMVPN cloud ET_AddDevice($_device.Ho stname(), 1004 ) ET_AddDMVPN($DMVPN, /24) ET_AddInterface(dev, ifname, iplist) Add a Layer 3 interface to a device. v: the hostname of the device. ame: an interface name that you want to add. ist: the optional argument, IP address of the rface you want to add and the format is Mask, for example /24. You can define e than one IP addresses for the interface. ET_AddInterface( nb_route r1, e1/1, /24 ET_AddIPtoInterface(dev an IP address to an interface of a device., ifname, ip) See function ET_AddInterface for the input. ET_AddIPtoInterface( R1, e1/1, /24 ) ET_AddLAN(lanname, subnet) Add a LAN Segment to the workspace. name: the name of the LAN segment. bnet: the subnet address of the LAN ET_AddLAN($LAN, /24 ) ET_AddLink(srcdev, srcif, Add a link between two interfaces. srcip, dstdev, dstif, dstip, dev: the string (device name) or PyDevice linktype) ct of the source device. urce Interface: the source interface of the link urce IP: the IP address of the source interface stination Device: the hostname of the ination device of the link stination Interface: the destination interface of ink stination IP: the IP address of the destination rface ET_AddLink( R1, e1/1, , R2, e2/1, , 1) 206
212 k Type (integer): the type of the link. : serial : VPN :StandBy ET_AddWAN(wanname, subnet) Add a WAN cloud. nname: the name of the WAN segment. bnet: the subnet address of the WAN cloud ET_AddWAN( R1, /24 ) ET_DisableInterface(dev, Disable an interface in the workspace. ifname) v: the string (device name) or PyDevice object of source device. ame: the interface name Note: if AN interface is disabled, all links connected to this interface will also be disabled. ET_DisableInterface( R1, e 1/1 ) ET_RemoveLink(srcdev, srcif, srcip, dstdev, dstif, dstip, linktype) Remove a link between two interfaces. See function ET_AddLink for the input arguments. ET_RemoveLink( R1, e1/1, , R2, e2/1, , 1) GetCurrentWorkspaceDir () Get the current workspace directory. $dir = GetCurrentWorkspaceDir() IfNameMibToFull(sIfNam e) GetOneIpRecords(strIp = "", strmac = "", dev = None, strport = "") Return the full interface name given a MIB interface name. Get a list of IP table entries: ip: the IP address. Mac: the Mac address v : the device name Port : the port name (string) Note: if no arguments are defined, all entries will be returned. $ifname = IfNameFullToBkn( eth0/0 ) $ifname will be ethernet0/0 GetOneIpRecords($IP) GetOneIpRecords() GetSwitchConnRecords(d Return a list of switch connectivity. ev = None, strport = "") v : the device name Port :port name (string) $swtich_connectivity = GetSwtichConnRecords ( $dev1, $port_name ) Note: if the port name is not specified, the function returns all connections of the specified 207
213 GetDevStatus(dev) device. If no device is specified, all switch connectivity entries will be returned. Return an integer: 1 if the device is up, 0 if the device is down, and -1 if the system fails to get the device status. dev: the string (device name) or PyDevice object. $dev_status = GetDevStatus($_device) GetIfStatus(dev, ifname) GetCpuUtilization(dev) Return an integer: 1 if the interface is up, 0 if the interface is down, and -1 if the system fails to get the interface status. Dev: the string (device name) or PyDevice object. Ifname : the interface name Return the CPU utilization (an integer). Dev: the string (device name) or PyDevice object. $inf_status = GetIfStatus($_device) $CPU = GetCpuUtilization($dev1) Return 50 meaning that the CPU utilization is 50% GetLinkErrorsUtilization( dev, ifname) GetMemUtilization(dev) Return a list of the link errors from the inbound and the outbound interface. Ret = (inlinkerror, outlinkerror) Dev: the string (device name) or PyDevice object. Ifname: interface name (string) Return the the memory utilization (an integer). Dev: the string (device name) or PyDevice object. $ret = GetLinkErrorsUtilization($d eva, e1/0) $MEM = GetMemUtilization($dev1) Return 50 meaning that the memory utilization is 50% GetTrafficUtilization(dev, sif, bbandwidthlive = True) Return traffic utilization for a specified interface. The return variable is a list meaning (InOctects, OutOctects, Bandwidth). Dev: the string (device name) or PyDevice object. sif: the interface name (string). bbandwidthlive: bool type, set it to True to retrieve the bandwidth information from live network, False to retrieve it from the cached data. $traffic_util = GetTrafficUtilization( R1, e1/1 ) 208
214 MonitorDevice($dev, "Type:itemName", $value) Return the value of monitored item on device such as the CPU utilization. This function is primarily used in Qapp. MonitorDevice($_device.Ho stname(), "Double:CPU", $CLI1.cpu) MonitorInterface($dev, $intf, "Type:itemName", $value) Monitornbr($dev1, $dev2, " Type:itemName", $value) AddToDeviceQueue(devi ce) RemoveFromDeviceQueu e(device) Return the value of monitored item on an interface such as the interface CRC error. This function is primarily used in Qapp. Return the value of monitored item on link (from one device to the other device) such as the BGP advertised routes. This is primarily used in Qapp. Add device to the device queue. Remove device from the device queue MonitorInterface($_device. HostName(), "Int:CRC_Error", $CLI1.infs.CRC_Error) MonitorNbr($_device, GetDevice($P2.bgp_nei_id), "int:prefix_advertised",$p3. adv_route_count) AddToDeviceQueue($dev) RemoveFromDevice($dev) ClearDeviceQueue() Remove all devices from the device queue ClearDeviceQueue() ResetToInitialDeviceQue ue() LoadDeviceGroupToDevi cequeue(groupname) InitDeviceQueue(deviceli st) GetInitialDeviceQueue() Reset the device queue to its initial status (device queue on which the probe is run in the first probe block) Add all devices of a device group to the device queue Use a device list to reset the device queue. Return a device list of original device queue when the procedure starts to run. ResetToInitialDeviceQueue LoadDeviceGroupToDevice Queue( All BGP Devices ) InitDeviceQueue($dev_list) $dev_list = GetInitialDeviceQueue() 2.2 PyMac Member Functions Name Description Example PyMac::IsValid() Return true if this is a valid MAC address. $mac1 = PyMac( aaaaaa.bbbbbb ) $bret = $mac1.isvalid() 209
215 PyMac::MacStr() Return the MAC address as a string. PyMac( aaaaaa.bbbbbb ) $ret = $mac1.macstr () 2.3 PyIP Member Functions Name Description Example PyIP:: Network() Get the network address. $ip1 = PyIP( ) $ret = $ip1.network () $ret will be /24 PyIP:: Mask () Get the mask address. $ip1 = PyIP( ) $ret = $ip1. Mask () $ret will be PyIP::GetIPAddress() Get the IP address without the mask. $ip1 = PyIP( ) $ret = $ip1.getipaddress() $ret will be PyIP::IPMaskLen() Get the mask length. $ip1 = PyIP( ) $ret = $ip1.ipmasklen () $ret will be /24. PyIP::IsSamesSubnet(PyIP ip) Check whether this IP address $ip1 = PyIP( ) is in the same subnet as the $ret = input IP address. $ip1.issamesubnet(pyip( /24 ) $ret will be True. PyIP::IsSupernet() Check whether the IP address is a superset. PyIP::IsSubnet() Check whether the IP address is a subnet IP address. PyIP::IsSummarynet(PyIP ip) Return true if the input IP address is a summary net of this IP address. PyIP::IsFullMask() Return true if the mask length is 32. $ip1 = PyIP( ) $ret = $ip1.getipaddress() $ret will be True PyIP::ClassMask() Return the class mask address. PyIP::GetIPInt() Return the integer format of the IP address. $ip1 = PyIP( ) $ret = $ip1.getipint() $ret will be PyIP:: Network() Get the network address. $ip1 = PyIP( ) 210
216 $ret = $ip1.network () $ret will be /24 PyIP:: Mask () Get the mask address. $ip1 = PyIP( ) $ret = $ip1. Mask () $ret will be PyIP::GetIPAddress() Get the IP address without the mask. $ip1 = PyIP( ) $ret = $ip1.getipaddress() $ret will be PyIP::IPMaskLen() Get the mask length. $ip1 = PyIP( ) $ret = $ip1.ipmasklen () $ret will be /24. PyIP::IsSamesSubnet(PyIP ip) Check whether this IP address is in the same subnet as the input IP address. $ip1 = PyIP( ) $ret = $ip1.issamesubnet(pyip( /24 ) PyIP::IsSupernet() PyIP::IsSubnet() PyIP::IsSummarynet(PyIP ip) PyIP::IsFullMask() Check whether the IP address is a superset. Check whether the IP address is a subnet IP address. Return true if the input IP address is a summary net of this IP address. Return true if the mask length is 32. $ret will be True. $ip1 = PyIP( ) $ret = $ip1.getipaddress() PyIP::ClassMask() Return the class mask address. $ret will be True 211
217 PyIP::GetIPInt() Return the integer format of the IP address. $ip1 = PyIP( ) $ret = $ip1.getipint() $ret will be PyInterface Member Functions Name PyInterface:: Ip () PyInterface::SecondaryIPs() PyInterface::Name() PyInterface::Device() PyInterface::IsInWorkspace() PyInterface::IsAccessable() PyInterface::Neighbors() PyInterface::NeighborInterfaces() PyInterface::L2Neighbors() PyInterface::L2NeighborInterface() PyInterface::IsSamesSubnet (string sip) PyInterface::HasIpAddress(string sip) Description Return the IP address of this interface object. Return a list of secondary IP addresses of this interface (the element is a PyIP object). Return the interface name such as e0/0. Return the device object (PyDevice) this interface belongs to. Check whether this Interface object is in the workspace. Check whether the device can be accessed from the OE via the shared device setting configured for this device. Return a list of L3 neighbor devices (PyDevice). Return a list of L3 neighbor interfaces (PyInterface). Return a list of L2 neighbor devices (PyDevice). Return a list of L2 neighbor interfaces (PyInterface). Check whether the Interface IP is in the same subnet of the input IP address. Check whether the input IP address is one of the IP address configured on Interface. 2.5 PyDevice Member Functions Name PyDevice:: HostName() PyDevice:: Interfaces() PyDevice::IsInWorkspace() Description Return the hostname (string) Return a list of interfaces of this device (PyInterface) Check whether this device is in the workspace PyDevice::LocalIfbyNeighbor(PyInterfaceNb rif) Get the local interface connected to a remote interface (PyInterface) 212
218 PyDevice::LocalfbyNeighborIp(string: Remote_IP) Get the local interface connected to the address (PyInterface) remote IP PyDevice::LocalIfbyIP(IP) Return the local interface having the given IP address (PyInterface) PyDevice::RemoteNeighborbylocalIf(String Local_If ) PyDevice::Neighbors() PyDevice::NeighborInterfaces() PyDevice::L2Neighbors() PyDevice::L2NeighborInterfaces() PyDevice::VisibleInterfaces() PyDevice::Config(string:sFilePath) PyDevice::GetMgmtIP() PyDevice::DeviceType() Return a list of remote interfaces (PyInterface) connected to the given local interface, which must be the short name such as e0/0 Return a list of all L3 neighbor devices (PyDevice) Return a list of all L3 neighbor interfaces (PyInterface) Return a list of all L2 neighbor devices (PyDevice) Return a list of all L2 neighbor interfaces (PyInterface) Return the visible interfaces of this device in a Q-map (visible interfaces are interfaces drawn in the map). Return the configurations of this device (string). sfilepath: the full path name of the configuration file. If it is empty, then return the configurations in the default DataFolder defined while running the procedure. Return the Management IP address of this device (CIP). Return the device type number of this device. (int) 2.6 PyTable Member Functions Name Description Example PyTable::GetColumnCount() Return the number of columns. PyTable::GetRowCount() Return the number of rows. PyTable::CompareWith(PyT ableanothertable, colmap) Return the compared results with another table. PyTableAnotherTable: the other table to be compared. colmap : the mapping from the columns of this table to the columns of the other table to be compared. table1 = PyTable({"f1":[11,22]}) table2 = PyTable({"f3":[11,33]}) $me = table1.comparewith(table2, [('f1', 'f3')])['me'] $other = table1.comparewith(table2, [('f1', 'f3')])['other'] $same = 213
219 table1.comparewith(table2, 'f3')])['same'] [('f1', PyTable::AllSame(string column) Check whether all entries in the column have the same value. column: the name of the column (string). $me will be {'f1': [22]} $other will be {'f3': [33]} $same will be {'f1': [11]} table1 = PyTable() $ret = table1.allsame( devicename ) PyTable::AllDifferent(string column) Check whether the values of the column are different. $table1 = PyTable() $ret = table1.alldifferent ( devicename ) PyTable::GetSame(string column, value) PyTable::GetDifferent(string :column, value) PyTable::GetPrefix(string:co lumn, string:ipaddress) Return all rows having the same value as the input value in the given column. The return variable is a PyTable. Return all rows having a different value from the input value in the given column. The return variable is a PyTable. Return all rows having an IP address which is in the same subnet of the input IP address in the given column. The return variable is PyTable. Note: the variable type of the given column must be CIP type. table1 = PyTable() $ret = table1.getsame ( devicename, R1 ). The return value is PyTable.$table1 = PyTable() $ret = table1.getdifferent ( devicename, R1 ) $table1 = PyTable() $ret = table1.getprefix ( Subnet, ) Or $ret = table1.getprefix ( Subnet, /24 ) PyTable::AllContain(string:c olumn, str:value) Check whether all entries in the column contain the input value. $table1 = PyTable() $ret = table1.allcontain ( devicename, R1 ) PyTable::GetOneColumn(str :ColumnName) Return all entries in the given column. The return variable is a list. $table1 = PyTable() $ret = table1.getonecolumn ( devicename ) 214
220 PyTable::GetOneRow ( int: index) PyTable::GetOneCell(str:Col umnname,int: index) Return a dictionary including the mapping of the column name to the value of the given row. The return variable is a dictionary. Return the value of the given column and index. $table1 = PyTable() $ret = table1.getonerow (3) $table1 = PyTable() $ret = table1.getonecell ( devicename, 3) PyTable::AddRow(dict:One DictRow) Add the row into the table. Note: The row must be a dictionary variable. It is the mapping from the value to the column name. $table1 = PyTable() $table2 = PyTable() $row = table1.getonerow (3)) $ret = table2.addrow($row) PyTable::SortByField(str:Col umnname, int:sorttype) Sort the table according to the method applied to the given column. ColumnName: the column to be sorted. sorttype: the type of values to be sorted. 0: for integer or other general types in ascending order. 1: for integer or other general types in descending order. 2: for the IP address in ascending order. 3: for the IP address in descending order. $table1 = PyTable() $table1.sortbyfield( devicename, 0 ) 2.7 Device/Interface/Module Property attributes PyDeviceProperty(sDev or IP) Return the device property object. The object will be used to get all the properties of the device. SDev or IP: hostname or IP address of 215
221 this device. DeviceType() Return the device type as an integer. $device_type_num = Refer to section Appendix 2H for the device type that each ID stands for. PyDeviceProperty($_device).Device Type() DeviceTypeName() Return the device type as the $device_type = meaning string. PyDeviceProperty($_device).Device TypeName() CategoryName() Return the category name of the $Category = device. PyDeviceProperty($_device).Categ oryname() Driver() Return the driver used for the device. $driver = PyDeviceProperty($_device).Driver( ) HostName() Return the hostname $hostname = PyDeviceProperty($_device).HostN ame() SysObjectOID() Return the system object ID $SysOID = PyDeviceProperty($_device).SysOb jectoid() Vendor() Return the vendor information $Vendor = PyDeviceProperty($_device).Vendo r() Model() Return the model information $Model = PyDeviceProperty($_device).Model () SoftwareVersion() Return the software version $Soft_ver = PyDeviceProperty($_device).Softw areversion() SerialNumber() Return the serial number $serial_num = PyDeviceProperty($_device). $device_type_num = PyDeviceProperty($_device).Serial Number() AssertTag() Return the asset tag $asset_tag = PyDeviceProperty($_device).Assert Tag() SystemMemory() Return the system memory $mem = PyDeviceProperty($_device).Syste mmemory() Location() Return the location $location = PyDeviceProperty($_device).Locati on() 216
222 Contact() Return the contact $contact = PyDeviceProperty($_device).Conta ct() HierarchyLayer() Return the hierarchy layer $hierachy_layer = PyDeviceProperty($_device).Hierar chylayer() Description() Return the description $description = PyDeviceProperty($_device).Descri ption() Site() Return the site that the device $site = belongs to PyDeviceProperty($_device).Site() ConfigFileTime() Return the time stamp that the $config_time = config files was last updated PyDeviceProperty($_device).Config FileTime() CustomData() Return the customized device $customized_data = property information. (dictionary) PyDeviceProperty($_device).Custo mdata() ManagementIp() Return the management IP address $mgmt_ip = of the device PyDeviceProperty($_device).Manag ementip() ManagementInterface() Return the management interface of $mgmt_inf = the device PyDeviceProperty($_device).Manag ementinterface() ManagementInterfaceMA Return the MAC address of the $mgmt_mac = C() management interface of the device. PyDeviceProperty($_device).Manag ementinterfacemac() SetPropertyValue(PropNa Set the device properties for THE PyDeviceProperty($_device).SetPro me, PropValue) specified filed. The properties, pertyvalue( location, $location) Vendor, model, softwareversion, serialnumber, asserttag, systemmemory, location, contact, hierarchylayer and description can be set by this function. 217
223 PyInterfaceProperty(s Dev, sinterface) Return the interface property object. The object will be used to get all the properties of the interface. SDev: the device name or PyDevice object. sinterface: the interface name. MIBIndex() Return the MIB index number $index = PyInterfaceProperty($dev1, $inf).mibindex() BandWidth() Return the bandwidth as an integer. $Bandwidth = PyInterfaceProperty($dev1, $inf).bandwidth() InterfaceName() Return the interface name $intf = PyInterfaceProperty($dev1, $inf). InterfaceName() DeviceName() Return the device name $dev = ModuleSlot() Return the module slot the interface belongs to PyInterfaceProperty($dev1, $inf). DeviceName() $index = PyInterfaceProperty($dev1, $inf). ModuleSlot() ModuleType() Return the module type $module_type = PyInterfaceProperty($dev1, $inf). ModuleType() InterfaceStatus() Return the interface status $intf_status = PyInterfaceProperty($dev1, InterfaceStatus() $inf). Speed() Return the speed $speed = PyInterfaceProperty($dev1, Speed() $inf). Duplex() Return the duplex $duplex = PyInterfaceProperty($dev1, $inf). Duplex() Description() Return the description $description = PyInterfaceProperty($dev1, Description() $inf). 218
224 MPLSVrf() Return the MPLS VRF info configured on the interface Vlan() Return the VLAN this interface belongs to VoiceVlan() Return the Voice VLAN name if available RoutingProtocol() Return the routing protocol running on the interface. Note: all routing protocols configured under the interface will be returned, for example OSPF 1 AREA ,RIP 2 Counter() Return the counter used for the interface. MulticastMode() Return the multicast mode running on the interface. Mode() Return the mode of the interface, Trunk or Access. IsPhysicaIf() Check whether this interface is a physical interface. $mpls_vrf = PyInterfaceProperty($dev1, $inf). MPLSVrf() $vlan = PyInterfaceProperty($dev1, $inf). Vlan() $voice_vlan = PyInterfaceProperty($dev1, $inf). VoiceVlan() $routing = PyInterfaceProperty($dev1, $inf). RoutingProtocol() $couter = PyInterfaceProperty($dev1, $inf). Counter() $multicast_mode = PyInterfaceProperty($dev1, $inf). MulticastMode() $mode = PyInterfaceProperty($dev1, $inf). Mode() $Is_physical = PyInterfaceProperty($dev1, $inf). IsPhysicaIf() InterfaceFullName() Return the interface full name $intf_full = PyInterfaceProperty($dev1, $inf). InterfaceFullName() CustomData() Return the customized data of the $customized_data = interface. (dictionary) PyInterfaceProperty($dev1, $inf). CustomData() InterfaceIp() Return the IP address of the interface. $intf_ip = The return variable is a CIP. PyInterfaceProperty($dev1, $inf). InterfaceIp() MACAddr() Return the MAC address of the $mac = 219
225 interface. The return variable is a CMA. PyInterfaceProperty($dev1, $inf). SetPropertyValue(PropNam e, PropValue) Set the interface properties for specified filed of an interface. The properties mibindex, bandwidth, interfacestatus, speed, duplex, description and interfacefullname can be set by this function. MACAddr() PyInterfaceProperty($dev1, $inf).setpropertyvalue( description, $description) CModuleProperty(sD Return the module property object. The ev, sslot) object will be used to get all the properties of the module. SDev: the device name or PyDevice object. sslot: the slot of the module. Slot() Return the slot name. $slot = CModuleProperty($dev1, slot1 ).Slot() DeviceName() Return the device name that the slot $dev = belongs to. CModuleProperty($dev1, slot1 ).DeviceName() CardType() Return the module type retrieved from $module = this device. CModuleProperty($dev1, slot1 ).CardType() Ports() Return the port number of the slot. $port_number = CModuleProperty($dev1, slot1 ).Ports() SerialNumber() Return the serial number of this slot. $serial_num = CModuleProperty($dev1, HWRev() FWRev() SWRev() Return the hardware revision of this slot. Return the firmware revision of this slot. Return the software revision of this slot. slot1 ).SerialNumber() $hw_rev = CModuleProperty($dev1, slot1 ).HWRev() $fw_rev = CModuleProperty($dev1, slot1 ).FWRev() $sw_rev = CModuleProperty($dev1, slot1 ).SWRev() 220
226 CardDescription() Return the description of this slot. $description = CModuleProperty($dev1, LastTimeStamp() Return the time stamp that the slot was last discovered. CustomData() Return the customized module property information. (dictionary) slot1 ).CardDescription() $time_stamp = CModuleProperty($dev1, slot1 ).LastTimeStamp() $cutomized_data = CModuleProperty($dev1, slot1 ).CustomData() MACAddr() Return the MAC address of this slot $mac = CModuleProperty($dev1, SetPropertyValue(PropNa me, PropValue) Set the module properties for specified filed of a module. The properties, cardtype, ports;serialnumber, hwrev, fwrev, swrev, and carddescription can be set by this function. slot1 ).MACAddr() CModuleProperty($dev1, slot ).SetPropertyValue( carddesc ription, $description) 2.8 Device type ID and name ID Name 1004 End System 1007 LAN 1008 WAN 1010 DMVPN 102 Juniper Router 1021 Unclassified Device 1024 MPLS Cloud 1025 Cisco WAP 1026 Mute LAN Dell PowerConnect Switch Xirrus Wireless Array Adtran Cisco ACE 1036 Unknown IP Device A10 Load Balancer 221
227 1037 Internet Wan Fortinet FortiGate Firewall Netscaler Load Balancer Sidewinder Firewall F5 Load Balancer-SNMP Hirschmann Switch Alcatel Lucent Service Router Alcatel OmniSwitch Radwin Radio Devices HuaWei Switch RuggedCom ROX Switch Riverbed WAN Optimizer 2 Cisco Router 2001 Cisco IOS Switch 2002 Cisco PIX Firewall 2003 F5 Load Balancer 2004 Cisco Nexus Switch 2007 Checkpoint Firewall 2008 NetScreen Firewall 2009 Cisco ASA Firewall 2011 HP ProCurve Switch 2012 Juniper EX Switch 2013 Arista Switch 2015 Dell Force10 Switch 2018 Juniper SRX Firewall 2021 Unclassified Router 2023 Extreme Switch 2024 Brocade Switch 2030 Unclassified Firewall 2035 Unclassified Load Balancer 2041 HP Menu-Driven Switch 2060 Cisco Catalyst Switch 2061 Unclassified Switch 2062 CSS 2110 Nortel Switch 2130 Palo Alto Firewall 2140 Ciena Switch 2150 Enterasys Switch 2999 Cisco IOS XR 3001 Call Manager 3002 IP Phone 222
228 3003 Cache Engine 3033 WLC 3034 LWAP Com Switch 223
229 224
230 Appendix 3 Brief Introduction of Python Scripting 3.1 Setting up the Python Environment The Python version used by NetBrain is Python 3.1x. Download Python from this link: Select the Windows x86 MSI Installer. Start the Python Shell by running Python 3.1/IDLE. 3.2 Python Programming Basics Python is an easy-to-learn, powerful programming language. It has efficient high-level data structures and a simple but effective approach to object-oriented programming. This section is not a tutorial of the Python script language. Instead this is going to give a brief introduction and hopefully cover what you need in order to write a complex NetBrain procedure. First start the Python GUI (the shell) and type the following commands in the shell UI: 225
231 You just learned some basic data types and data structures of Python. The first command assigns the numerical value (2+2) to the variable k. The second command print k tries to print out the value k but failed due to a syntax error. Print is a function and the correct syntax to call it is print(k) (it needs an argument between the parentheses). The third command prints the value k successfully. Unlike C or Java, you do not need to explicitly declare a variable to be an integer, a string, a list or other type of data. Instead, after the variable is assigned a value, its data type is defined. For example, the command after print(k) assigns a string to the variable str and so this variable str is a string, not an integer. You need to become familiar with the string data type and its functions. For example, the function len(str) returns the length of a string and the str.split() function splits the string str by the delimiter (by default, it is space) and returns a list of substrings. If you are not familiar with objectoriented programming, the function call str.split() may look a little strange. You can think about it this way: str is an object and it has the function split(). To call a function for an object, you put. between the object and the function, which means the function is applied to this object alone, not other objects. The most used data structure is list. The function str.split() returns a list and the command a = str.split() sets the variable a as a list. You can print a list by print(a). Another useful data structure is dictionary. An entry of the dictionary includes a key and a value. Dictionaries are indexed by keys, which can be any immutable type; strings and numbers can always be keys. The 226
232 command dict1[ dog ] = steven assigns the value steven (string) to the key dog. You often need to loop through a data structure. The frequently used flow through a list or dictionary is for loop. Try typing the following commands in the shell UI: Remember to add : in the control flow. Otherwise you will get a syntax error. Other common control flow statements are while, if, break and continue. The break statement breaks out of the smallest enclosing for or while loop. The continue statement, borrowed from C, continues with the next iteration of the loop. To illustrate these statements, the following code shows two ways to add all numbers from 1 to 100: The second method uses the range statement and produces a different result from the first 227
233 method. If we look closely, we can see why. This is a common error with the range statement range(1,100) means that i will loop from 1 to 99, and stop on 100. Now let us change the task to add the numbers from 1 to For these types of repeatable operations, you can define a function: The keyword def introduces a function definition. It must be followed by the function name and the parenthesized list of formal parameters. The statements that form the body of the function start at the next line, and must be indented. The return function returns a value from a function. Return without an expression argument returns Null. Falling off the end of a function also returns Null. This is different from some other languages where return is necessary to exit out of certain functions. Now that you have some basic understanding of Python, let us try a real task. For some type of device such as Extreme, the timestamp of a route table output has this type of formatting: 6d:22h:59m:17s. Now we will write a function to get the number of seconds for this timestamp. Up to now, we have been working on the shell interface for learning purposes. For real coding, you need to edit the code in a file. From the Python shell UI, open a new file under the File menu and write the code. If you are unsure of the syntax, you may want to refer to the following code example: # Transfer the timestamp 6d:22h:59m:17s to a second def getage(age): time = age.split(':') if (len(time)!= 4): return 0 for i in range(0, 4): time[i] = time[i].strip('dhms') rtn = (int)(time[3]) + ((int)(time[2]) + ((int)(time[1]) + (int)(time[0])*24)*60)*60 return rtn If this code is not easy to understand, it may be worth following the tutorial link at the end of this section. There are a few things worth pointing out here: You can add comment lines into Python. The comment lines start with #. 228
234 The age.split( : ) function splits the string by the delimiter :. time[0] to time[3] are string variables. To recast them as integers, you can put (int) before them. Python has strict indent rules. Make sure that your lines are indented correctly for each control flow or functions. Otherwise you will get a syntax error. Now, we can test the function. To do this, we need to add the following code. When the Python runs this code, it will execute the blocks starting from if ( name == " main "): if ( name == " main "): print (getage("6d:22h:59m:17s")) This is a brief introduction to Python to give you a quick start. Please refer to for a more in-depth Python tutorial. 3.3 If Conditions Defining the Analysis of a Qapp or Trigger of a Procedure often involves conditions. This section should cover all you need to know about conditions. The conditions are either True or False (with no quotes!). These are the only possible Boolean values. In Python the name Boolean is shortened to the type bool. It is the type of the results of true-false conditions or tests. The general Python syntax for a simple if statement is if condition : Indented code blocks If the condition is true, then do the indented code blocks. If the condition is not true, then skip the indented code blocks. The simplest condition is to compare two variables. All the usual arithmetic comparisons may be made, but many do not use standard mathematical symbolism, mostly for lack of proper keys on a standard keyboard. Meaning Math Symbol Python Symbols Less than < < Greater than > > Less than or equal <= Greater than or equal >= Equals = == Not equal!= There should not be space between the two-symbol Python substitutes. 229
235 Notice that the obvious choice for equals, a single equal sign, is not used to check for equality. An annoying second equal sign is required. This is because the single equal sign is already used for assignment in Python, so it is not available for tests. All variables can be also compared to None, the built-in variables for NetBrain system, such as following: $var1 is None Same as $var1 == None. True if $var1 is not set to $var1 is not None any value; False otherwise Same as var1!= None. True if $var1 has a value; False otherwise So you can have the following simple valid conditions: $var1 > 90 $var1 > $var2 ($var1 - $var2)/($var3-$var4) > 1 Two simple conditions can be combined by and and or to form the complex conditions such as: $var1 <90 and $var1>80 $var3 == 1 or $var4 == Basic Regular Expressions Regular expressions are powerful tools of pattern recognition in strings. A key task of the parser is to search the CLI show command output and retrieve any useful data. Since the CLI command output always follows certain patterns, this task can always be done with regular expressions. Regular expressions can contain both special and ordinary characters. Most ordinary characters, like 'A', 'a', or '0', are the simplest regular expressions; they simply match themselves. You can concatenate ordinary characters, so Version matches the string Version. Some characters, like ' ' or '(', are special. Special characters either stand for classes of ordinary characters, or affect how the regular expressions around them are interpreted. The following are some special characters frequently used: '.' Match any character except a newline. 230
236 '^' Match the start of the string or the line. '$' Match the end of the string or just before the newline at the end of the string. '*' Cause the resulting RE to match 0 or more repetitions of the preceding RE, as many repetitions as are possible. ab* will match a, ab, or a followed by any number of b s. '+' Cause the resulting RE to match 1 or more repetitions of the preceding RE. ab+ will match a followed by any non-zero number of b s; it will not match just a. '?' Cause the resulting RE to match 0 or 1 repetitions of the preceding RE. ab? will match either a or ab. *?, +?,?? The '*', '+', and '?' qualifiers are all greedy; they match as much text as possible. Sometimes this behavior isn t desired; if the RE <.*> is matched against '<H1>title</H1>', it will match the entire string, and not just '<H1>'. Adding '?' after the qualifier makes it perform the match in non-greedy or minimal fashion; as few characters as possible will be matched. Using.*? in the previous expression will match only '<H1>'. [] Indicate a set of characters. In a set: Characters can be listed individually, e.g. [amk] will match 'a', 'm', or 'k'. Ranges of characters can be indicated by giving two characters and separating them by a '-', for example [a-z] will match any lowercase ASCII letter, [0-5][0-9] will match all two-digit numbers from 00 to 59, and [0-9A-Fa-f] will match any hexadecimal digit. If - is escaped (e.g. [a\-z]) or if it s placed as the first or last character (e.g. [a-]), it will match a literal '-'. ' ' A B, where A and B can be arbitrary REs, creates a regular expression that will match either A or B. (...) Matches whatever regular expression is inside the parentheses, and indicates the start and end of a group; the contents of a group can be retrieved after a match has been performed. \s Matches any whitespace character; this is equivalent to the set [\t\n\r\f\v]. 231
237 \d Matches any decimal digit; this is equivalent to the set [0-9]. \w Matches any alphanumeric character and the underscore; this is equivalent to the set [a-za-z0-9_] Appendix 4 Table Operators Table Operator is used to manage Table node and the variable data in the Table node, such as merging variables of two tables into one table, deleting a variable in Table and etc. There are totally five types of table operators in NetBrain Qapp: Convert, Delta, Sub-table, Merge and Neighbor Join. 1. Convert Operator Convert Operator is used to convert a general table into a Global Data Table. A general table can only store data for one device for further analysis in one loop, and the data of device in last loop will be overwritten by the data of device in the current loop (for variables rows in Device Queue table, Qapp just loop one row one time), but the Global Data Table is able to store all devices data rather than just a device in Device Queue. In addition, variables in Global Data Table can be referenced by all Canvas blocks in a Qapp while variables in a general table can be referenced within one Canvas and if you want to call variables of other canvas, you want to convert a general table to global data table. There are two options under Convert Operator: (1) Append data: default option of Convert Operator. Add variables obtained in one loop to the global data table until all rows in Device Queue are looped. (2) Overwrite data: overwrite variables and data obtained in last loop with the variables in the 232
238 current loop. For use cases about Covert Operator, please refer to Using General Qapp for Dynamic Documentation and Multiple Canvas Execution Flow and Loop Control 2. Sub Table Sub Table is used to remove or keep a row in a table. There are two options under Sub Table Operator: (1) Remove Row: to remove a row from Table if a variable or multiple variables defined in expression below meet the condition set (2) Keep Row: to just keep the rows that a variable or multiple variables defined in expression below meet the condition set. It means that rows will be deleted if the variables of the rows do not meet the condition set. For use case about Sub Table, please refer to the Qapp to monitor CPU usage for devices configured with OSPF routing protocol in the Chapter Multiple Canvas Execution Flow and Loop Control. 3. Delta Operator: Delta Operator is used to calculate the difference of a variable between the current value and the value in the last polling cycle. 233

239 Delta Operator is only applicable to Monitor Qapp since Monitor Qapp loops periodically and can obtain the value of a variable in last loop and current loop. Select key for Delta calculation: the key is used as an index to target the variables for delta calculation. In most cases, if a variable for delta calculation is interface-level data, such as MTU, CRC and Input Error, Interface name is set as the key; If a variable for calculation is device-level data, such as CPU usage and version number, the device name is set as the key. Device-level Variable Interface-Level variable: 234

240 4. Neighbor Join This operator is used to integrate a device s data and it neighbors data into one table for comparison and analysis according to their neighbor relation in Device Queue. 235

241 For example, to check MTU consistency of a pair of neighbor interfaces. After obtaining a interface s MTU value and its neighbor interface s MTU value, you could put the two variables into one table according to the correspondence between the two variables in Device Queue. Neighbor Join Correspondence between the two variables in Device Queue Key Matching: the variables in the Device Queue are predefined, such as this, this_intf, nbr and nbr_intf and these variables may be different from the variables that you have named in Command node and Key Match is used to define variables you have defined to match which system predefined variables. For example, you may define the variable representing interface s 236
242 name as this_intf_nm which is different from system predefined this_intf and you could define that this _intf_nm is identical to this_intf in the key matching. For use cases on Neighbor Join, please refer to Using General Qapp for Neighbor Check 5. Merge Table Merge Operator is to merge the variables of two tables into one merged table according to the variable that the two tables both have. For example, by inputting in SNMP Command, you could retrieve the interface names and their corresponding index values. 237
243 By inputting SMNP OID in another SNMP Command, you could retrieve the interface status (1 represents Up and 2 represents Down ) and their corresponding index value (here index represents an interface). For two command nodes, they both have the common variable $index and you could merge the two tables into one table according this variable. 238
244 Under Merge 2 tables by specified key, select the common variable that the two tables both have and then click Calculate Table button to apply settings. Click the merged table and in this merged table, you could see clearly an interface and its status. For detailed use case on Merge Table, please refer to SNMP Command and Merge Table Operator Note: (1) Merge Table is not just applicable to SNMP command, it could be applicable to varieties of command types and the key factor is that two tables must have a common variable. (2) Merge Table and Neighbor Join belong to two-table operator and are used to put variables in two tables into one table. But they are different is in use situation. Merge Table is used to merge two tables with a common variable into a table by taking the common variable as an index, while Neighbor Join is used to join variables of two neighbor tables into one table based on correspondence of two neighbor devices in Device Queue. 239
245 Appendix 5 Command Types There are five Command types in NetBrain Qapp: CLI Command, Configuration Command, Ping Command, Traceroute Command and SNMP Command. Command nodes are used to retrieve data of a device and define rules to parser the retrieved data. These five types of command nodes are similar to each other in function but different in use cases. 1. CLI Command CLI Command is the most commonly used command type and it retrieves live data by various Show commands. For example, to monitor a device s health, CLI Command Show Process CPU is used to obtain CPU data and then based on CPU retrieved, Monitor Qapp could display the CPU value on map. 240
 Create a report for the devices containing a particular configuration line.")
246 2. Configuration Command The Configuration Command provides a way to use device configurations in more flexible ways. It retrieve data contained in Device Configuration without by Show Commands. Configuration Command is often used in the following cases: (1) Create a report for the devices containing a particular configuration line. For example, find the devices with the no service password-encryption" configuration, which violates basic security policies. (2) Highlight or draw a particular configuration in the Q-map. The design reader can be used to filter the configurations or you can create a Filter parser to parse any configuration. (3) Do a preliminary check before applying an additional troubleshooting Qapp. This can improve the Qapp performance since the Configuration Command uses the baseline configurations without retrieving the data from the devices. For example, we can check whether OSPF is configured to run on a router before applying any Qapp to troubleshoot OSPF routing issues. Create a Qapp to map devices without no service password-encryption. (1) Use Configuration Command after this node in Canvas. Configuration Command is often used based on current baseline. When click Retrieve Sample, you could define current baseline as datafolder and the Qapp will not retrieve live configuration data, which improves Qapp performance. 241


247 (2) The built-in variable $_orginal_result is the baseline configuration of a device. we only check whether $_orginal_result contains any special configuration(no service passwordencryption )in Output node. 242

248 (3) Run the Qapp and a sample output is as follows: (3) Ping and Traceroute Command Ping Command and Traceroute Command are used to troubleshoot network connection between two devices. For example, you could create a Ping probe to ping the core device or server from the network devices 243


249 For Ping command, the system has three built-in variables:$lost_rate, $average_time and $ping_result. You could use the variable $ping_result to check whether the ping from a source and destination IP is successful in Output node. For Traceroute Command, the system has two built-in variables:$last_hop and tracerout_result. You could use tracerout_result to check the traceroute result. For use instance, please refer to the chapter Troubleshooting Connection Problems via Qapp 244
NetBrain Instant Trial Edition 5.2. Quick Start Workbook
 NetBrain Instant Trial Edition 5.2 Quick Start Workbook NetBrain ITE 5.2 Quick Start Workbook Thank you for downloading NetBrain Instant Trial Edition (ITE). This workbook will help you make the most of
NetBrain Quick Start Guide For End Users
 NetBrain Quick Start Guide For End Users Dynamic Documentation Network Analysis Visual Troubleshooting Automation Qapp Network Change Management Thin Client NetBrain Technologies, Inc. 2004-2016. All rights
NetBrain Quick Start Guide For End Users
 NetBrain Quick Start Guide For End Users Dynamic Documentation Network Analysis Visual Troubleshooting Automation Qapp Network Change Management Thin Client NetBrain Technologies, Inc. 2004-2015. All rights
Lab Viewing Network Device MAC Addresses
 Topology Addressing Table Objectives Device Interface IP Address Subnet Mask Default Gateway S1 VLAN 1 192.168.1.1 255.255.255.0 N/A PC-A NIC 192.168.1.3 255.255.255.0 192.168.1.1 Part 1: Configure Devices
Configuring Gigabit Ethernet Interfaces
 This chapter explains how to configure the Gigabit Ethernet (GE) interface on the Cisco ASR 901 router. Configuring the Interface, page 1 Setting the Speed and Duplex Mode, page 2 Enabling the Interface,
GRE Tunnel with VRF Configuration Example
 GRE Tunnel with VRF Configuration Example Document ID: 46252 Contents Introduction Prerequisites Requirements Components Used Conventions Configure Network Diagram Configurations Verify Troubleshoot Caveats
Lab - Troubleshooting Connectivity Issues
 Lab - Troubleshooting Connectivity Issues Topology Addressing Table R1 ISP Objectives Device Interface IP Address Subnet Mask Default Gateway G0/1 192.168.1.1 255.255.255.0 N/A S0/0/0 10.1.1.1 255.255.255.252
Management IP Interface
 The management interface is used for the video control plane messages, such as session creation and deletion, between the Logical Edge Devices (LED) and the external Edge Resource Manager (ERM) server.
Prepared by: NetBrain Technologies Inc. How to Use Procerures 6.2
 Prepared by: NetBrain Technologies Inc. http://www.netbraintech.com How to Use Procerures 6.2 Table of Contents 1. CREATE AN INDEPENDENT PROCEDURE... 3 1.1 Define CLI command... 4 1.2 Define Trigger...5
CCNA Practice test. 2. Which protocol can cause high CPU usage? A. NTP B. WCCP C. Telnet D. SNMP Answer: D
 1. Which network would support at least 30 hosts? A. 10.0.0.0 255.255.255.252 B. 10.0.0.0 255.255.255.240 C. 10.0.0.0 255.255.255.224 D. 10.0.0.0 255.255.255.248 2. Which protocol can cause high CPU usage?
Switch configuration. By the end of this session, you will be able to: Describe basic switch configuration methods. Configure a switch.
 By the end of this session, you will be able to: Describe basic switch configuration methods. Configure a switch. 4 SESSION OVERVIEW... 2 MANAGEMENT OPTIONS... 3 WHY CONFIGURE SWITCHES?... 4 CONSOLE PORT...
Configuring IRB. Integrated Routing and Bridging CHAPTER
 CHAPTER 11 This chapter describes how to configure integrated routing and bridging (IRB) for the ML-Series card. For more information about the Cisco IOS commands used in this chapter, refer to the Cisco
NetBrain POC Walk-Through
 NetBrain POC Walk-Through For OE 4.1 Dynamic Documentation Visual Troubleshooting NetBrain Technologies, Inc. 2004-2013. All rights reserved +1.800.605.7964 support@netbraintech.com www.netbraintech.com
Chapter 5 Lab 5-1, Configure and Verify Path Control Using PBR. Topology. Objectives. Background. Required Resources. CCNPv7 ROUTE
 hapter 5 Topology Objectives onfigure and verify policy-based routing. Select the required tools and commands to configure policy-based routing operations. Verify the configuration and operation by using
NetBrain Instant Trial Edition 5.1. Quick Start Workbook
 NetBrain Instant Trial Edition 5.1 Quick Start Workbook NetBrain ITE 5.1 Quick Start Workbook Thank you for downloading NetBrain Instant Trial Edition (ITE). This workbook will help you make the most of
Address Resolution Protocol
 The (ARP) feature performs a required function in IP routing. ARP finds the hardware address, also known as Media Access Control (MAC) address, of a host from its known IP address. ARP maintains a cache
Chapter 5 Lab 5-1, Configure and Verify Path Control
 hapter 5 Lab 5-1, onfigure and Verify Path ontrol Topology Objectives Background onfigure and verify policy-based routing. Select the required tools and commands to configure policy-based routing operations.
Using Setup Mode to Configure a Cisco Networking Device
 Using Setup Mode to Configure a Cisco Networking Device Setup mode provides an interactive menu to help you to create an initial configuration file for a new networking device, or a device that you have
Configuring Link Aggregation on the ML-MR-10 card
 CHAPTER 34 Configuring Link Aggregation on the ML-MR-10 card This chapter applies to the ML-MR-10 card and describes how to configure link aggregation for the ML-Series cards, both EtherChannel and packet-over-sonet/sdh
1 of :22
 Feedback: Help us help you Please rate this document. Excellent Good Average Fair Poor This document solved my problem. Yes No Just Browsing Suggestions to improve this document. (512 character limit)
NetBrain Consultant Edition (CE)
") NetBrain Consultant Edition (CE) Quick Start Guide NetBrain Technologies, Inc. 2004-2013. All rights reserved +1.800.605.7964 support@netbraintech.com www.netbraintech.com Contents 1. Introduction 1) Install
NetBrain Consultant Edition (CE) Quick Start Guide NetBrain Technologies, Inc. 2004-2013. All rights reserved +1.800.605.7964 support@netbraintech.com www.netbraintech.com Contents 1. Introduction 1) Install
IPv6 Tunnel through an IPv4 Network
 IPv6 Tunnel through an IPv4 Network Document ID: 25156 Contents Introduction Prerequisites Requirements Components Used Conventions Configure Network Diagram Configurations (Manual IPv6 Mode) Configurations
Troubleshoot interface down issues in Cisco routers
 Troubleshoot interface down issues in Cisco routers Contents Introduction Prerequisites Requirements Conventions Troubleshoot Methodology Troubleshoot Examples Introduction This document describes troubleshoot
Configuring Interfaces
 CHAPTER 6 This chapter describes how to configure interfaces for the Catalyst 4500 series switches. It also provides guidelines, procedures, and configuration examples. This chapter includes the following
Lab - Exploring Router Physical Characteristics
 Topology Objectives Part 1: Examine Router External Characteristics Part 2: Examine Router Internal Characteristics Using Show Commands Background / Scenario In this lab, you will examine the outside of
Application Guide. VLANs for improved Q-SYS performance
 Application Guide Rev. A, 6 June 2018 OPTIMIZE Q-SYS PERFORMANCE: CREATE DEDICATED VLANS. One way to greatly ensure the reliability and performance of a Q-SYS network is putting Q-SYS traffic on one or
Configuring Interfaces
 CHAPTER 4 This chapter describes how to configure interfaces for the Catalyst 4500 series switches. It also provides guidelines, procedures, and configuration examples. This chapter includes the following
The configuration of the router at the initial stage was fairly simple (quoting only significant commands, not the entire config):
:") Gentlemen, As was to be expected, Joseph was correct on all accounts. My testbed consisted of a 2811 router running 12.4(24)T4 Advanced IP Services, and two PCs connected to it. One PC was used as the
Gentlemen, As was to be expected, Joseph was correct on all accounts. My testbed consisted of a 2811 router running 12.4(24)T4 Advanced IP Services, and two PCs connected to it. One PC was used as the
NetBrain for Beginners v6.1 Workbook
 NetBrain for Beginners v6.1 Workbook Dynamic Mapping Visual Troubleshooting Discovery of Your Network NetBrain Technologies, Inc. 2004-2016. All rights reserved +1.800.605.7964 support@netbraintech.com
configuring and connecting 24
 Lecture (01) configuring and connecting 24 ports switch Dr. Ahmed M. ElShafee ١ ٢ Step 1: connecting your PC to the Console Port. Open HyperTerminal software Press RETURN to get started. Switch> (User
Lecture (01) configuring and connecting 24 ports switch
 configuring and connecting 24 ports switch") Lecture (01) configuring and connecting 24 ports switch Dr. Ahmed M. ElShafee ١ ٢ Step 1: connecting your PC to the Console Port. Open HyperTerminal software Press RETURN to get started. Switch> (User
Lecture (01) configuring and connecting 24 ports switch Dr. Ahmed M. ElShafee ١ ٢ Step 1: connecting your PC to the Console Port. Open HyperTerminal software Press RETURN to get started. Switch> (User
Using Setup Mode to Configure a Cisco Networking Device
 Using Setup Mode to Configure a Cisco Networking Device First Published: August 9, 2005 Last Updated: December 3, 2010 Setup mode provides an interactive menu to help you to create an initial configuration
The objective of this lab is to become familiar with Cisco switches as well as the Spanning Tree Protocol.
 CIS 83 LAB 4 - Spanning Tree Protocol Rich Simms October 3, 2006 Objective The objective of this lab is to become familiar with Cisco switches as well as the Spanning Tree Protocol. Scenario This lab was
NetBrain OE 5.1 On-Site Trial. Quick Start Workbook
 NetBrain OE 5.1 On-Site Trial Quick Start Workbook NetBrain 5.1 Quick Start Workbook Thank you for downloading NetBrain. This workbook will help you make the most of your trial by introducing you to essential
Cisco Introduction to Cisco Networking Technologies Exam. Practice Test. Version 2.2. https://certkill.com
 Cisco 640-821 640-821 Introduction to Cisco Networking Technologies Exam Practice Test Version 2.2 QUESTION NO: 1 Refer to the exhibit. Why was this message received? A. No VTY password has been set B.
Lab - Configuring Basic Single-Area OSPFv2
 Lab - Configuring Basic Single-Area SPFv2 Topology Addressing Table Device Interface IP Address Subnet Mask Default Gateway G0/0 192.168.1.1 255.255.255.0 N/A R1 S0/0/0 (DCE) 192.168.12.1 255.255.255.252
Chapter 2 Lab 2-1, EIGRP Configuration, Bandwidth, and Adjacencies
 Chapter 2 Lab 2-1, EIGRP Configuration, Bandwidth, and Adjacencies Topology Objectives Background Configure EIGRP on multiple routers. Configure the bandwidth command to modify the EIGRP metric. Verify
Throughput Issues on ASR1000 Series Router
 Throughput Issues on ASR1000 Series Router Contents Introduction Prerequisites Requirements Components Used Conventions Problem Solution Scenario 1. High Bandwidth Ingress Interface(s) and Low Bandwidth
CS IT ports switch basic configuration. Lecture (01) Introduction to 24 ports managed switches By: Dr. Ahmed ElShafee.
 Introduction to 24 ports managed switches By: Dr. Ahmed ElShafee.") Lecture (01) Introduction to 24 ports managed switches By: Dr. Ahmed ElShafee CS IT Agenda 24 ports switch basic configuration Switch remote configuration peer2peer star network clients/server star network
Lecture (01) Introduction to 24 ports managed switches By: Dr. Ahmed ElShafee CS IT Agenda 24 ports switch basic configuration Switch remote configuration peer2peer star network clients/server star network
If this is your first time configuring the switch, you will notice that the Switch IOS is almost identical to Router IOS.
 Spanning Tree Lab Objective Create a basic switch configuration and verify it. Determine which switch is selected as the root switch with the factory default settings. Force the other switch to be selected
Lab Configuring Basic Switch Settings (Solution)
") (Solution) Topology Addressing Table Objectives Device Interface IP Address Subnet Mask Default Gateway S1 VLAN 99 192.168.1.2 255.255.255.0 192.168.1.1 PC-A NIC 192.168.1.10 255.255.255.0 192.168.1.1
(Solution) Topology Addressing Table Objectives Device Interface IP Address Subnet Mask Default Gateway S1 VLAN 99 192.168.1.2 255.255.255.0 192.168.1.1 PC-A NIC 192.168.1.10 255.255.255.0 192.168.1.1
Peter, Please approve us apply a new ISP connection to separate with CCA for ccahalmar. The bandwidth is 100M.
 All test are done in business time. Our testing are not professional. Not like ZBRELLA using www.speedtest.net as professional test. All testing report followed after. 1 From ISP s test shows the connection
CCNA Semester 2 labs. Part 2 of 2 Labs for chapters 8 11
 CCNA Semester 2 labs Part 2 of 2 Labs for chapters 8 11 8.2.4.5 Lab - Configuring Basic Single-Area OSPFv2 8.3.3.6 Lab - Configuring Basic Single-Area OSPFv3 9.2.2.7 Lab - Configuring and Verifying Standard
Lab Advanced Telnet Operations Instructor Version 2500
 Lab 4.2.4 Advanced Telnet Operations Instructor Version 2500 Objective Use the telnet command to remotely access other routers. Verify that the application layer between the source and the destination
Configuring IEEE 802.3ad Link Bundling and Load Balancing
 Configuring IEEE 802.3ad Link Bundling and Load Balancing This document describes how the IEEE 802.3ad link bundling and load balancing leverages the EtherChannel infrastructure within Cisco software to
Global Interface Commands on the Cisco ASR 9000 Series Router
 Global Interface Commands on the Cisco ASR 9000 Series Router This module provides global command line interface (CLI) commands for configuring interfaces on the Cisco ASR 9000 Series Aggregation Services
Configuring Interfaces on the ML-Series Card
 5 CHAPTER This chapter describes basic interface configuration for the ML-Series card to help you get your ML-Series card up and running. Advanced packet-over-sonet (POS) interface configuration is covered
Global Interface Commands on the. Cisco ASR 9000 Series Router.
 Global Interface Commands on the Cisco ASR 9000 Series Router This module describes the global command line interface (CLI) commands for configuring interfaces on the Cisco ASR 9000 Series Router. bandwidth
Lab- Troubleshooting Basic EIGRP for 1Pv4
 Lab- Troubleshooting Basic EIGRP for 1Pv4 Topology G0/0 G0/0 PC-A PC-C 2013 Cisco and/or its affiliates. All rights reserved. This document is Cisco Public. Page 1 of 27 Addressing Table efault Gateway
Flow-Based Redirect. Finding Feature Information
 The traffic from an IP session is redirected based on the destination address (for a simple IP session), and to a tunnel (for a mobile IP session). However, in some application scenarios, some of the traffic
Contents. Introduction. Methodology. Check for Output Drops. Introduction Methodology
 Contents Introduction Methodology Check for Output Drops Determine if the Drops are Unicast or Multicast Determine Which Output Buffer is Used Check the Active Buffer Monitoring Counters Actively Increment
Configuring the SS7 Q.703 High Speed Port Adapter
 CHAPTER 4 Configuring the SS7 Q.703 High Speed Port Adapter This chapter contains the following sections: Using the EXEC Command Interpreter, page 4-1 Configuring the Interfaces, page 4-2 Checking the
15d. PPPoE Troubleshooting
 Rev. 0800.0900 d. PPPoE Troubleshooting cc na c ookb ook.com PPPoE troubleshooting has been a part of the CCNA longer than certification guide authors have made any serious attempt to cover the topic.
Ethernet over GRE Tunnels
 The feature allows customers to leverage existing low end residential gateways to provide mobility services to mobile nodes using Proxy Mobile IPv6 (PMIPv6), General Packet Radio Service (GPRS) Tunneling
Flow-Based Redirect. Finding Feature Information
 The traffic from an IP session is redirected based on the destination address (for a simple IP session), and to a tunnel (for a mobile IP session). However, in some application scenarios, some of the traffic
Configuring T1/E1 Interfaces
 This chapter provides information about configuring the T1/E1 interface module on the chassis. It includes the following sections: For information about managing your system images and configuration files,
CIS 83 LAB 3 - EIGRP Rich Simms September 23, Objective. Scenario. Topology
 CIS 83 LAB 3 - EIGRP Rich Simms September 23, 2006 Objective The objective of this lab is to become familiar setting up and configuring EIGRP on three routers. EIGRP is a Cisco proprietary distance-vector
Domain Setup Guide. NetBrain Integrated Edition 7.1. All-in-One Appliance
 NetBrain Integrated Edition 7.1 Domain Setup Guide All-in-One Appliance Version 7.1a Last Updated 2018-09-27 Copyright 2004-2018 NetBrain Technologies, Inc. All rights reserved. Contents 1. Setting Up
Basic Router Configuration
 This section includes information about some basic router configuration, and contains the following sections: Default Configuration, on page 1 Configuring Global Parameters, on page 2 Configuring Gigabit
Lab 15d. PPPoE Troubleshooting
 MAC: 0:00:00:00:00:0 MAC: 0:00:00:00:00:0 Rev. 0808.88 Lab d. PPPoE Troubleshooting cc na c ookb ook.com T O P O L O G Y & G O A L Client Pool: 0.0.0. 0.0.0. Create a PPPoE connection from an edge router
Configuring T1/E1 Interfaces
 Effective Cisco IOS-XE Release 3.14.0S, the Cisco ASR-920-24SZ-IM, ASR-920-24SZ-M, ASR-920-24TZ-M Aggregation Services Router supports the following types of interface modules (IMs): 8x1G Cu IM (A900-IMA8T)
Global Interface Commands on Cisco IOS XR Software
 Global Interface Commands on Cisco IOS XR Software This module provides global command line interface (CLI) commands for configuring interfaces on the Cisco CRS Router. HR-613 bandwidth (global) Global
Chapter 3: Using Maintenance & Troubleshooting Tools and Applications
 Chapter 3: Using Maintenance & Troubleshooting Tools and Applications CCNP TSHOOT: Maintaining and Troubleshooting IP Networks Course v6 1 Chapter 3 Objectives Use Cisco IOS commands to gather information
BASIC CONFIGURATION CISCO SWITCH
 BASIC CONFIGURATION CISCO SWITCH switch#show running-config ( prikaz trenutne konfiguracije ) switch#show startup-config ( prikaz startne konfiguracije ) switch#configure terminal ( ulaz u global config
Lab QoS Manually Configured Frame Relay Traffic Shaping
 Lab 8.9.9 QoS Manually Configured Frame Relay Traffic Shaping Objective Failing to perform traffic shaping before injecting traffic into a Frame Relay permanent virtual circuit (PVC) is likely to lead
Configuring the Cisco ASR 1000 Series Modular Ethernet Line Card
 Configuring the Cisco ASR 1000 Series Modular Ethernet Line Card This chapter provides information about configuring the Cisco ASR 1000 Series Modular Ethernet Line Card on the Cisco ASR 1000 Series Routers.
NetBrain Technologies Inc. NetBrain Consultant Edition. Quick Start Guide
 NetBrain Technologies Inc. NetBrain Consultant Edition Quick Start Guide Content 1. Install NetBrain Workstation CE System... 3 1.1 Install and Activate NetBrain Gateway Server... 5 1.2 Install Workstation...
NetBrain Consultant Edition (CE)
") NetBrain Consultant Edition (CE) Quick Start Guide NetBrain Technologies, Inc. 2004-2012. All rights reserved +1.800.605.7964 support@netbraintech.com www.netbraintech.com Contents 1. Introduction 1) Install
NetBrain Consultant Edition (CE) Quick Start Guide NetBrain Technologies, Inc. 2004-2012. All rights reserved +1.800.605.7964 support@netbraintech.com www.netbraintech.com Contents 1. Introduction 1) Install
This document is exclusive property of Cisco Systems, Inc. Permission is granted to print and copy this document for non-commercial distribution and
 This document is exclusive property of Cisco Systems, Inc. Permission is granted to print and copy this document for non-commercial distribution and exclusive use by instructors in the CCNA Exploration:
Release Notes. NetBrain Integrated Edition 7.0
 NetBrain Integrated Edition 7.0 Release Notes Version 7.0b1 Last Updated 2017-11-22 Copyright 2004-2017 NetBrain Technologies, Inc. All rights reserved. Contents 1. Highlights... 3 2. Feature Summary...
IEEE 802.1Q Configuration
 CHAPTER15 This chapter describes: IP Routing over IEEE 802.1Q InterVLAN Routing and 802.1Q Trunking IP Routing over IEEE 802.1Q This section provides procedures for configuring protocols supported with
NetBrain for Beginners
 NetBrain for Beginners NetBrain Technologies 15 Network Drive Burlington, MA 01803 +1 800.605.7964 education@netbraintech.com www.netbraintech.com Training Flow o Set of slides to provide context o Demonstration
Configuring Interfaces
 CHAPTER 6 The chapter applies to the ML-Series (ML100T-2, ML100X-8, ML1000-2 cards. This chapter describes basic interface configuration for the ML-Series card to help you get your ML-Series card up and
Configuring Management Interfaces on Cisco IOS XR Software
 Configuring Management Interfaces on Cisco IOS XR Software This module describes configuration procedures for management interfaces on the route processors (RPs). Although the management interfaces on
Configuring Interfaces
 CHAPTER 6 This chapter describes how to configure interfaces for the Catalyst 4500 series switches. It also provides guidelines, procedures, and configuration examples. This chapter includes the following
Link Aggregation Configuration Commands
 Link Aggregation Configuration Commands Table of Contents Table of Contents Chapter 1...1 1.1...1 1.1.1 aggregator-group...1 1.1.2 aggregator-group load-balance...2 1.1.3 show aggregator-port...3 1.1.4
Configuring the 4-Port Serial Interface SPA
 This chapter provides information about configuring the 4-Port Serial Interface SPA on Cisco ASR 1000 Series Routers. Configuration Tasks, page 1 Verifying the Interface Configuration, page 11 Configuration
Chapter 5: Maintaining and Troubleshooting Routing Solutions
 Chapter 5: Maintaining and Troubleshooting Routing Solutions CCNP TSHOOT: Maintaining and Troubleshooting IP Networks Course v6 1 Troubleshooting Network Layer Connectivity 2 Routing and Routing Data Structures
NetBrain OE 4.0. Release Notes July NetBrain Technologies, Inc
 NetBrain OE 4.0 Release Notes July 2011 NetBrain Technologies, Inc. 2004-2011. All rights reserved +1.800.605.7964 info@netbraintech.com www.netbraintech.com NetBrain OE 4.0 Improvements New Features Site
Configuring EtherChannel and 802.1Q Trunking Between Catalyst L2 Fixed Configuration Switches and a Router (InterVLAN Routing)
") Cisco - Configuring EtherChannel and 802.1Q Trunking Between Catalyst L2 Fixed Conf... Page 1 of 13 Configuring EtherChannel and 802.1Q Trunking Between Catalyst L2 Fixed Configuration Switches and a Router
Cisco - Configuring EtherChannel and 802.1Q Trunking Between Catalyst L2 Fixed Conf... Page 1 of 13 Configuring EtherChannel and 802.1Q Trunking Between Catalyst L2 Fixed Configuration Switches and a Router
Configuring Virtual Interfaces
 Configuring Virtual Interfaces Virtual interfaces are software-based interfaces that you create in the memory of the networking device using Cisco IOS commands. Virtual interfaces do not have a hardware
NetBrain Technologies, Inc. 65 Network Drive Burlington, MA Phone: Website:
 o o o o NetBrain Technologies, Inc. 65 Network Drive Burlington, MA 01803 Phone: +1 781 221 7199 Email: info@netbraintech.com Website: www.netbraintech.com Release Highlights 1 New & Improved Change Analysis
Inverse MUX Application using Multilink PPP
 Inverse MUX Application using Multilink PPP Document ID: 10235 ontents Introduction Prerequisites Requirements omponents Used Related Products onventions onfigure Network Diagram onfigurations Verify Troubleshoot
Chapter 4 Lab 4-2, Redistribution Between EIGRP and OSPF
 Chapter 4 Lab 4-2, Redistribution Between EIGRP and OSPF Topology Objectives Review EIGRP and OSPF configuration. Redistribute into EIGRP. Redistribute into OSPF. Summarize routes in EIGRP. Filter routes
Configuring the SS7 Port Adapter
 CHAPTER 4 To continue your SS7 Port Adapter installation, you must configure the card type as either T1 or E1 and then configure the interfaces. This chapter contains the following sections: Using the
PT Activity 2.5.1: Basic Switch Configuration
 Topology NOTE TO USER: This activity is a variation of Lab 2.5.1. Packet Tracer may not support all the tasks specified in the hands-on lab. This activity should not be considered equivalent to completing
NetBrain Instant Trial Essential Features Walkthrough
 NetBrain Instant Trial Essential Features Walkthrough Contents 1. Getting Started... 3 2. Product Tour... 4 2.1 Search and Map... 4 2.2 Data Views... 5 2.3 A/B Path... 8 2.4 Executable Runbooks... 10 3.
DOCSIS Interface and Fiber Node Configuration
 Hardware Compatibility Matrix for Cisco cbr Series Routers, page 1 Overview of DOCSIS Interfaces and Fiber Node Configurations, page 2 Configuring DOCSIS Interfaces and Fiber Nodes, page 4 Configuring
Configuring Interfaces
 CHAPTER 9 This chapter describes how to configure interfaces on the Catalyst 6500 series switches. This chapter consists of these sections: Understanding Interface Configuration, page 9-2 Using the Interface,
Lab QoS Manually Configured Frame Relay Traffic Shaping
 Lab 8.1.10.9 QoS Manually Configured Frame Relay Traffic Shaping Objective Scenario Step 1 Failing to perform traffic shaping before injecting traffic into a Frame Relay permanent virtual circuit (PVC)
Chapter 1 Frame Relay Configuration and Management
 Chapter 1 Frame Relay Configuration and Management 1 This chapter describes the configuration tasks for the Cisco frame relay packet-switched software. You will find the following information in this chapter:
This document is exclusive property of Cisco Systems, Inc. Permission is granted to print and copy this document for non-commercial distribution and
 This document is exclusive property of Cisco Systems, Inc. Permission is granted to print and copy this document for non-commercial distribution and exclusive use by instructors in the CCNA Exploration:
Application Notes for ADTRAN NetVanta 3205 Access Router and IP Office Using Frame Relay over T1 - Issue 1.0
 Avaya Solution & Interoperability Test Lab Application Notes for ADTRAN NetVanta 3205 Access Router and IP Office Using Frame Relay over T1 - Issue 1.0 Abstract These Application Notes describe a sample
Viewing and Configuring Performance Counters in RTMT
 CHAPTER 7 Viewing and Configuring Performance Counters in RTMT May 19, 2009 Cisco Unified Presence directly updates Performance counters (called PerfMon counters). The counters contain simple, useful information,
Configuring PPPoE Client on the Cisco 2600 to Connect to a Non Cisco DSL CPE
 Configuring PPPoE Client on the Cisco 2600 to Connect to a Non Cisco DSL CPE Document ID: 4105 Contents Introduction Prerequisites Requirements Components Used Conventions Configure Network Diagram Configurations
Procedure to Create Custom Report to Report on F5 Virtual Services
 Procedure to Create Custom Report to Report on F5 Virtual Services Summary: The purpose of this Application Note is to provide a procedure to report on F5 Load Balancer Virtual Services. The report uses
Auto In-Service State for Ports
 This document describes the Auto In-Service State (AINS) feature on the port. Effective Cisco IOS XE Everest 16.6.1, the Cisco NCS 4200 Series support management of equipment and port state model in two
Chapter 4 Lab 4-1, Redistribution Between EIGRP and OSPF. Topology. Objectives. CCNPv7 ROUTE
 hapter 4 Topology Objectives Review EIGRP and OSPF configuration. Summarize routes in EIGRP. Summarize in OSPF at an ABR. Redistribute into EIGRP. Redistribute into OSPF. Summarize in OSPF at an ASBR.
Configuring GRE Tunnel Over Cable
 Configuring GRE Tunnel Over Cable Document ID: 12084 Introduction Before You Begin Conventions Prerequisites Components Used Background Theory Configure Network Diagram Configurations Verify Troubleshoot
NetBrain Workstation AE Quick Start
 NetBrain Workstation AE Quick Start For Architect Edition Must-See Features Walk-through Ready-to-use Internet Lab for Test Run Link to Download Software and In-Depth Training Look for: Test Run over Intermet